What’s new in 8.12
editWhat’s new in 8.12
editHere are the highlights of what’s new and improved in 8.12.
Other versions: 8.11 | 8.10 | 8.9 | 8.8 | 8.7 | 8.6 | 8.5 | 8.4 | 8.3 | 8.2 | 8.1 | 8.0 | 7.17
General Availability of Service Level Objectives
editService Level Objectives (SLOs) have been updated from Beta to generally available for Platinum and Enterprise subscription customers. As part of this general release, the SLOs feature has added several updates for our SRE and DevOps users.
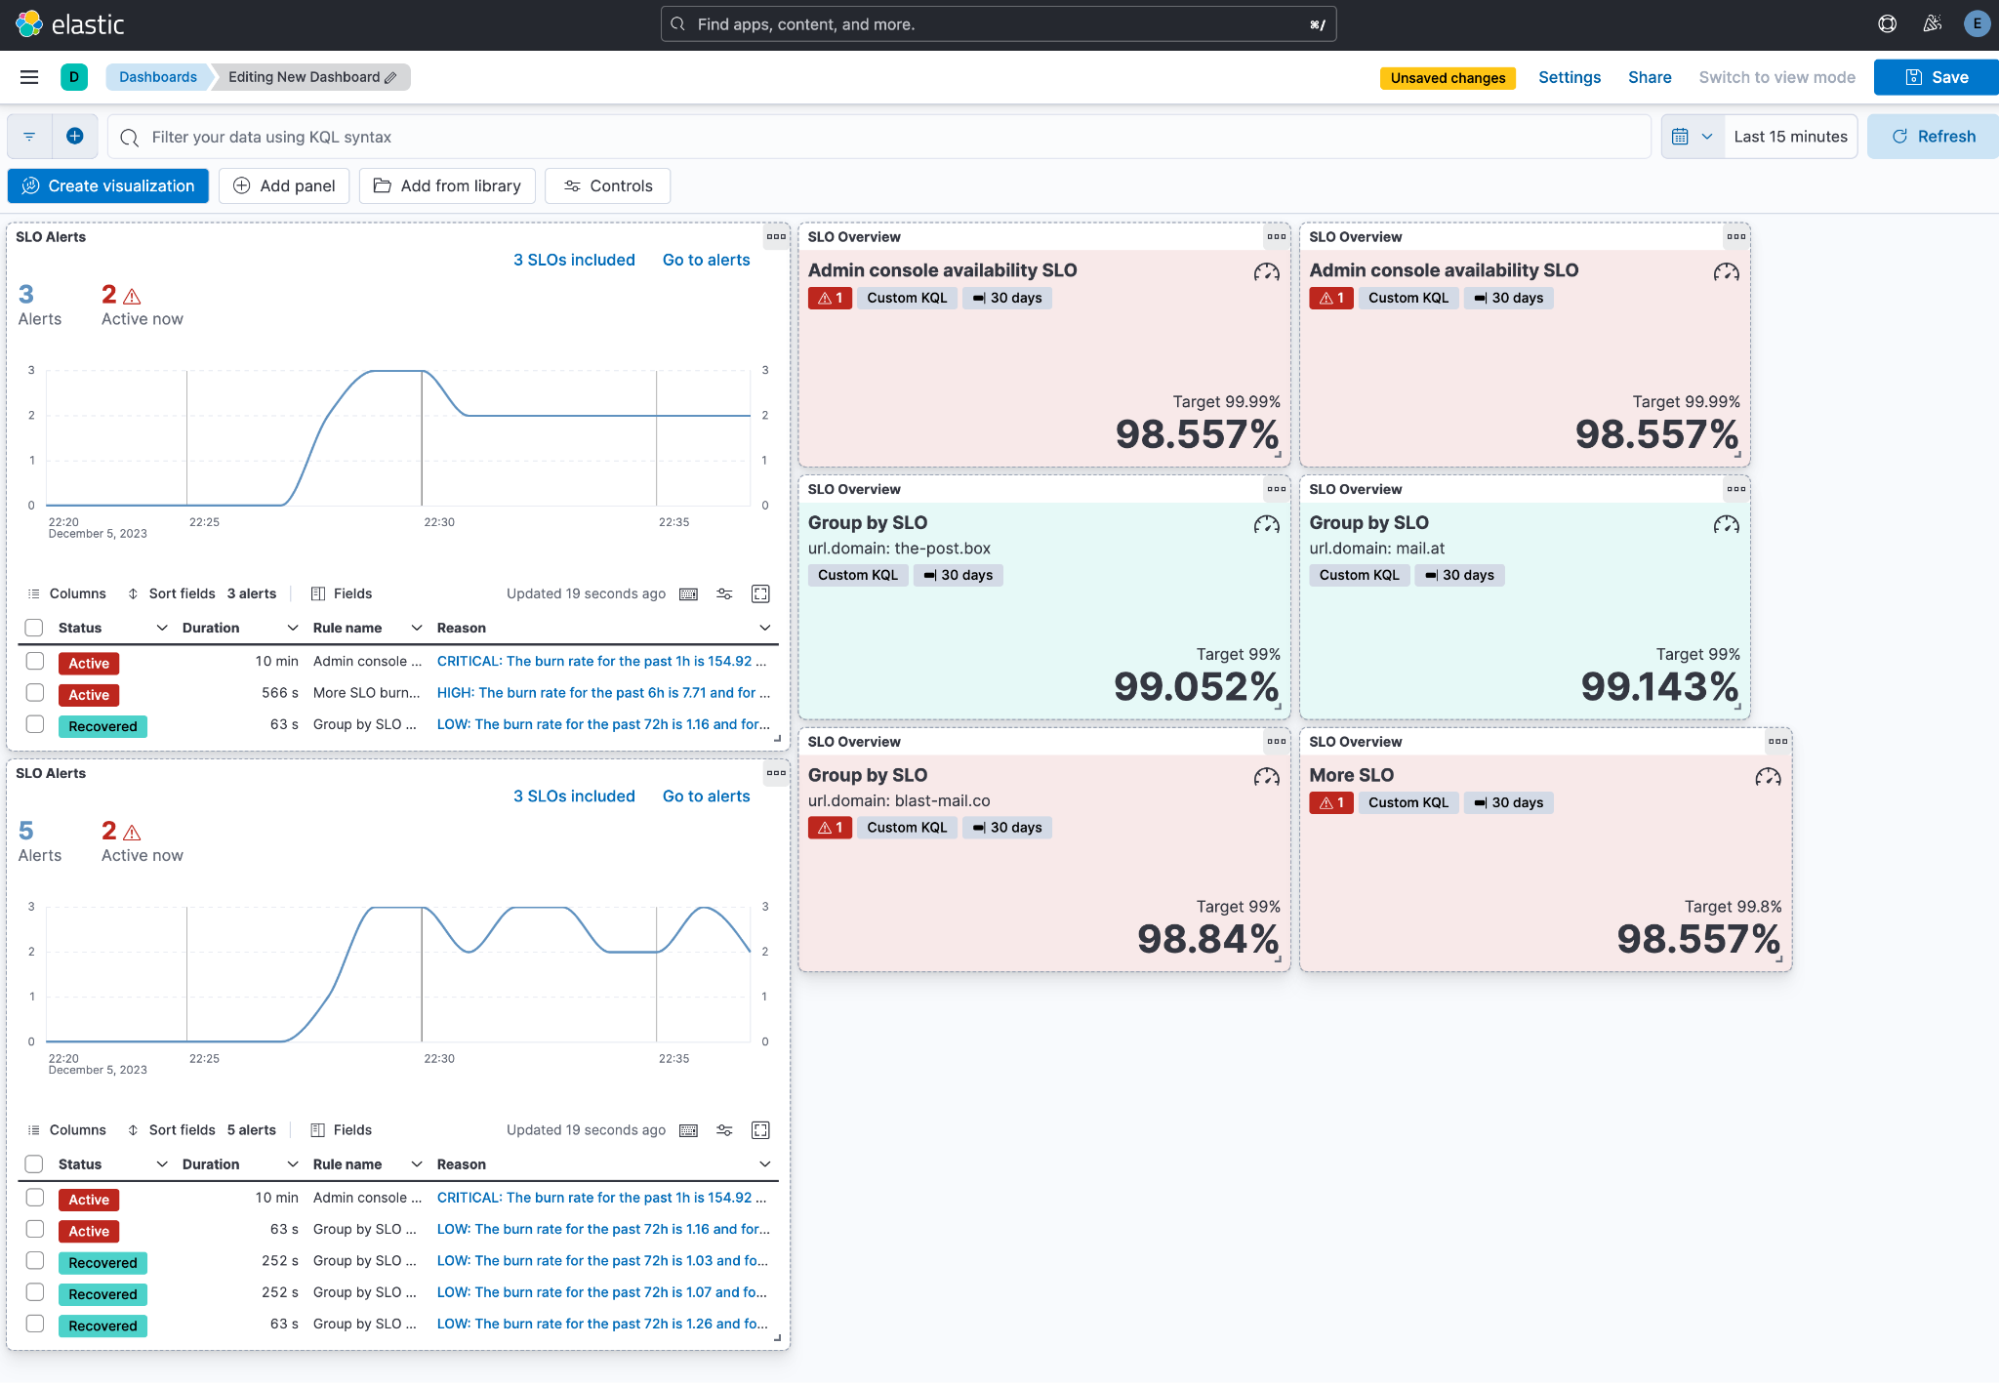
To make it easier to monitor large numbers of SLOs, users can now have multiple view options on the SLO overview page. New options for Card views and table views are also now available.
Now it’s easier to add the SLO overview in the SLO details page. You can also add an Alert visualization to dashboards as well. This enables you to view any burn rate alerts that are related to specific SLOs.
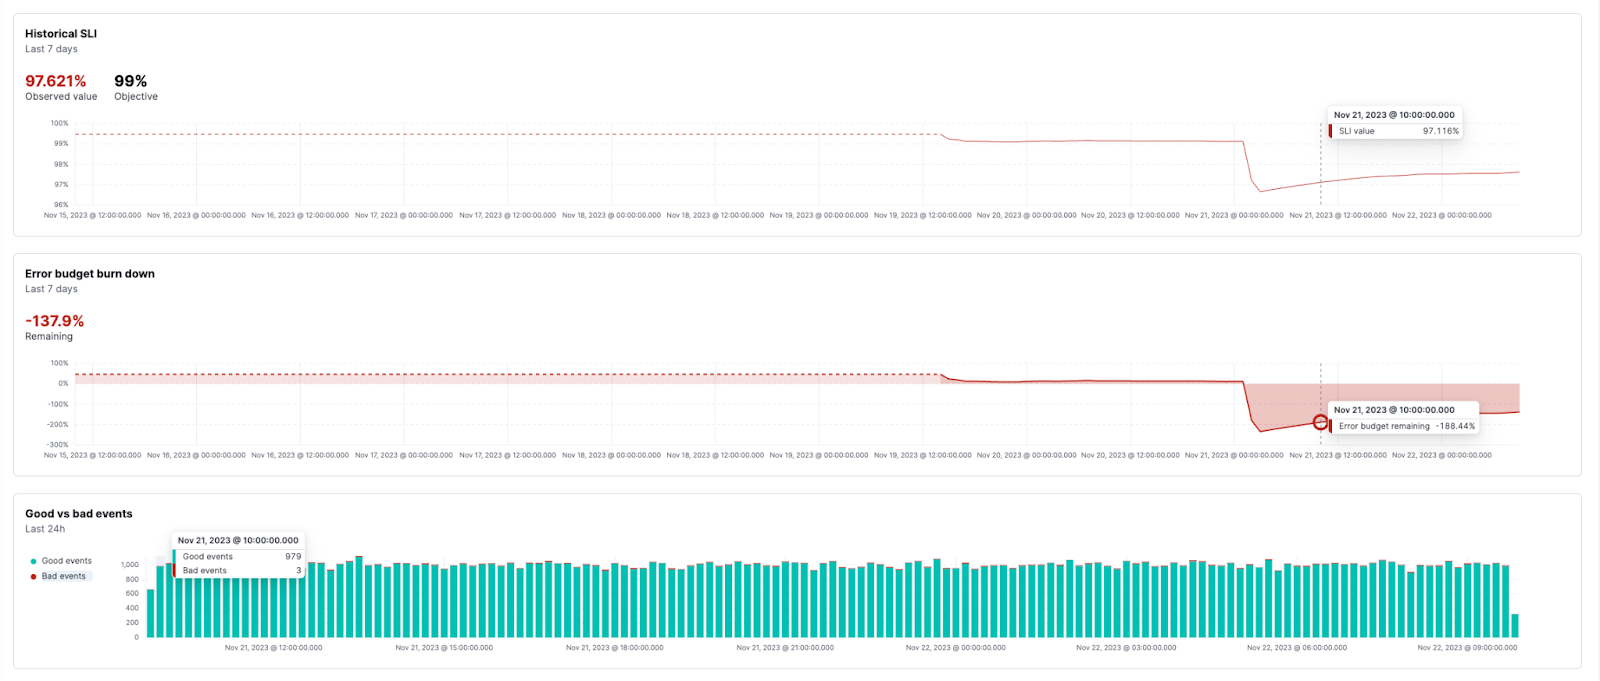
For faster investigation when an SLO is breached, there is a new chart on the SLO details page showing the good vs bad events that have happened over the past 24 hours.
For SLO burn rate alerting, there is a new way to define your burn rate windows based on the amount of budget consumed. This will allow SREs to define how much budget they are willing to spend before they receive the alert. There is an option to switch between “burn rate mode” and “budget consumed mode” using a toggle below the window definitions.
SLO’s also have a new Service Level Indicator (SLI) for Time Slice metrics in v8.12. This new SLI can be used for statistical aggregations, which allows for the use of aggregations like avg, max, min, sum, std_deviation, last_value, percentile, and doc_count, along with a custom equation and threshold. Because these aggregations are based on the windows size, they will be calculated based on a time slice budgeting method.
Train your AI Assistant with an internal knowledge base
editElastic’s AI Assistant for Observability has been upgraded from Tech Preview to generally available for our Enterprise customers in v8.12. The AI Assistant now comes with an integrated knowledge base, allowing organizations to link their application documentation and train AI Assistant responses on their Observability data.
The knowledge base allows users to add documents into an Elasticsearch index which the Assistant can then recall during interactions with the user to improve its reasoning about the user’s query. This allows the AI Assistant to link alerts with root cause troubleshooting guides, error messages with the context of what they mean, and processes with what they are dependent on or how to optimize them.
In 8.12 we’ve added a dedicated Settings page for the Assistant in Stack Management, which includes a UI for managing the knowledge base contents. This enables administrators to easily see the contents of the Knowledge base, add a single entry, import multiple entries via a file, and edit and delete entries.
Additionally, you can now populate the Knowledge base using Elasticsearch Connectors to import your application documentation from sources like GitHub, Confluence, and ServiceNow.
APM Attacher for Kubernetes
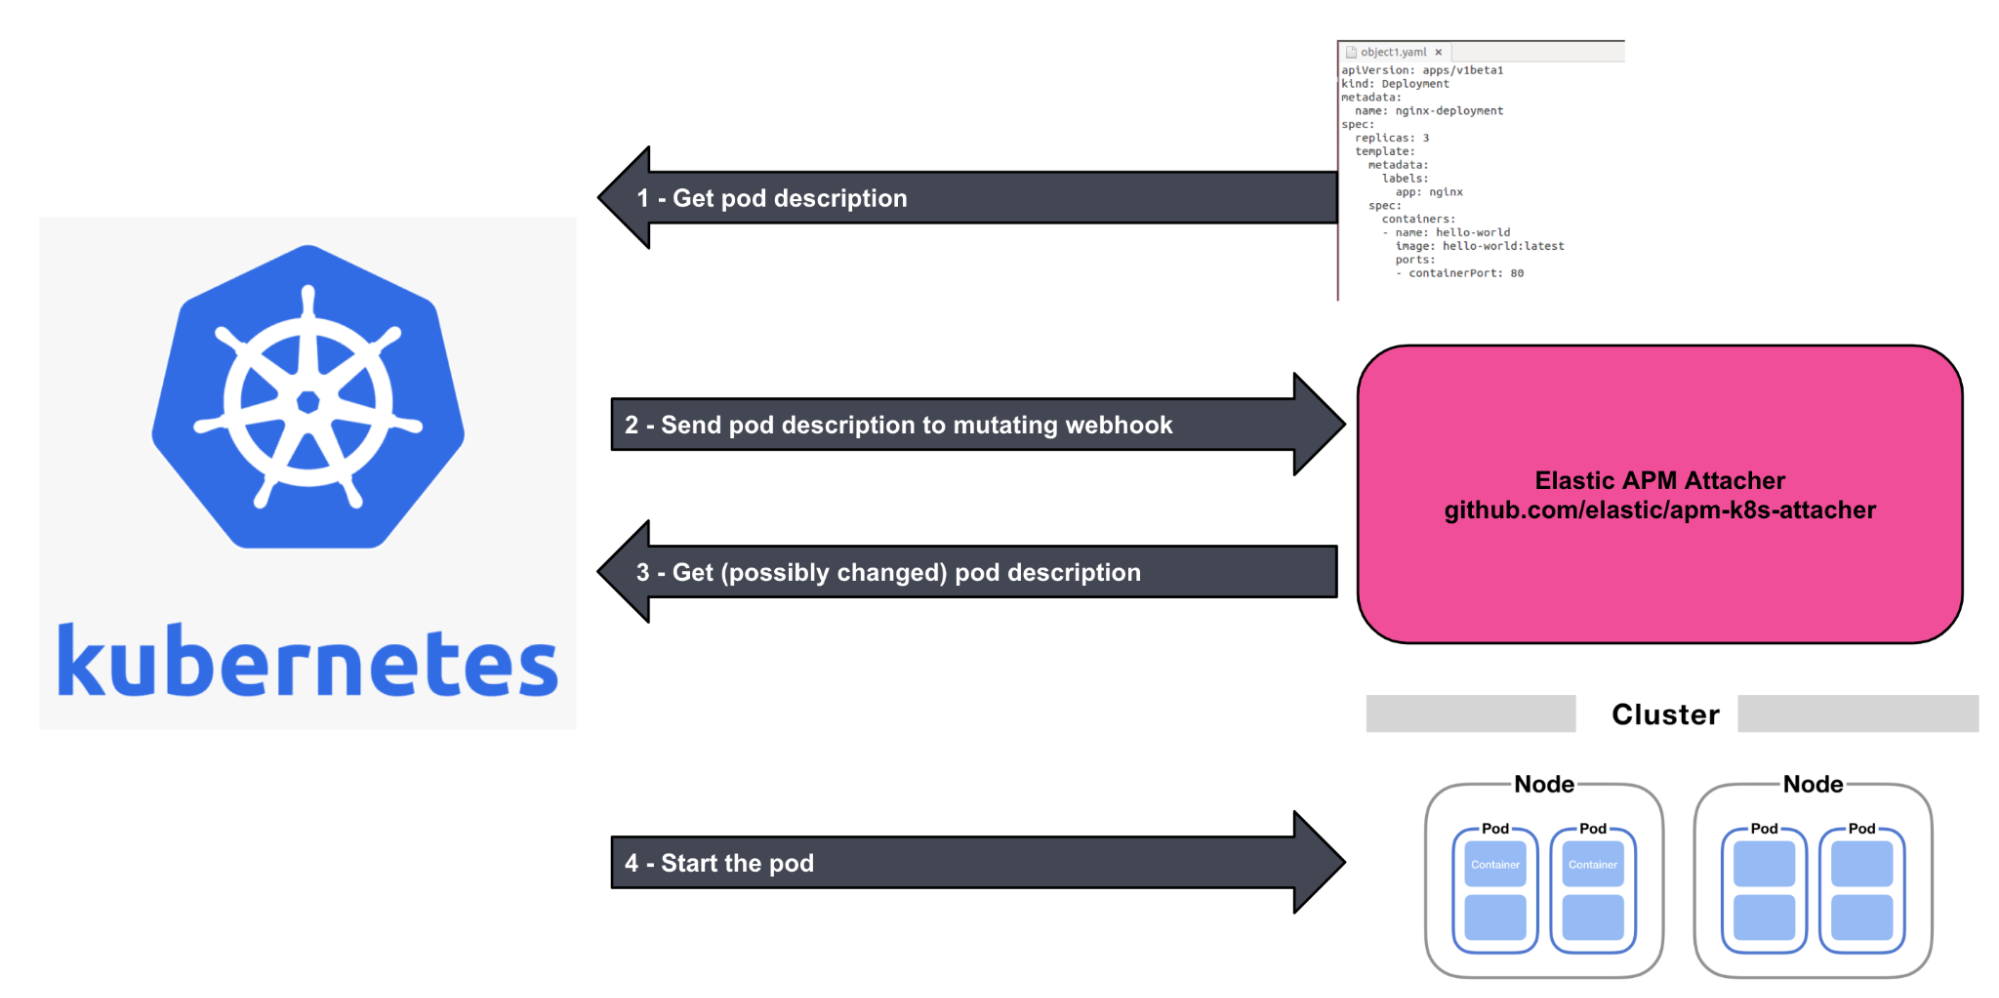
editVersion 8.12 announces the general availability of the APM Attacher for Kubernetes. This feature utilizes a webhook receiver and user-supplied annotation to automatically instrument applications written in Java and Node.js by an Elastic APM Agent. The APM Attacher is installed using a Helm chart. The webhook receiver is invoked on pod creation and it mutates the object definition depending on the user-supplied annotation. This approach allows for instrumentation of the application without any source code or configuration changes.
Mobile APM solution
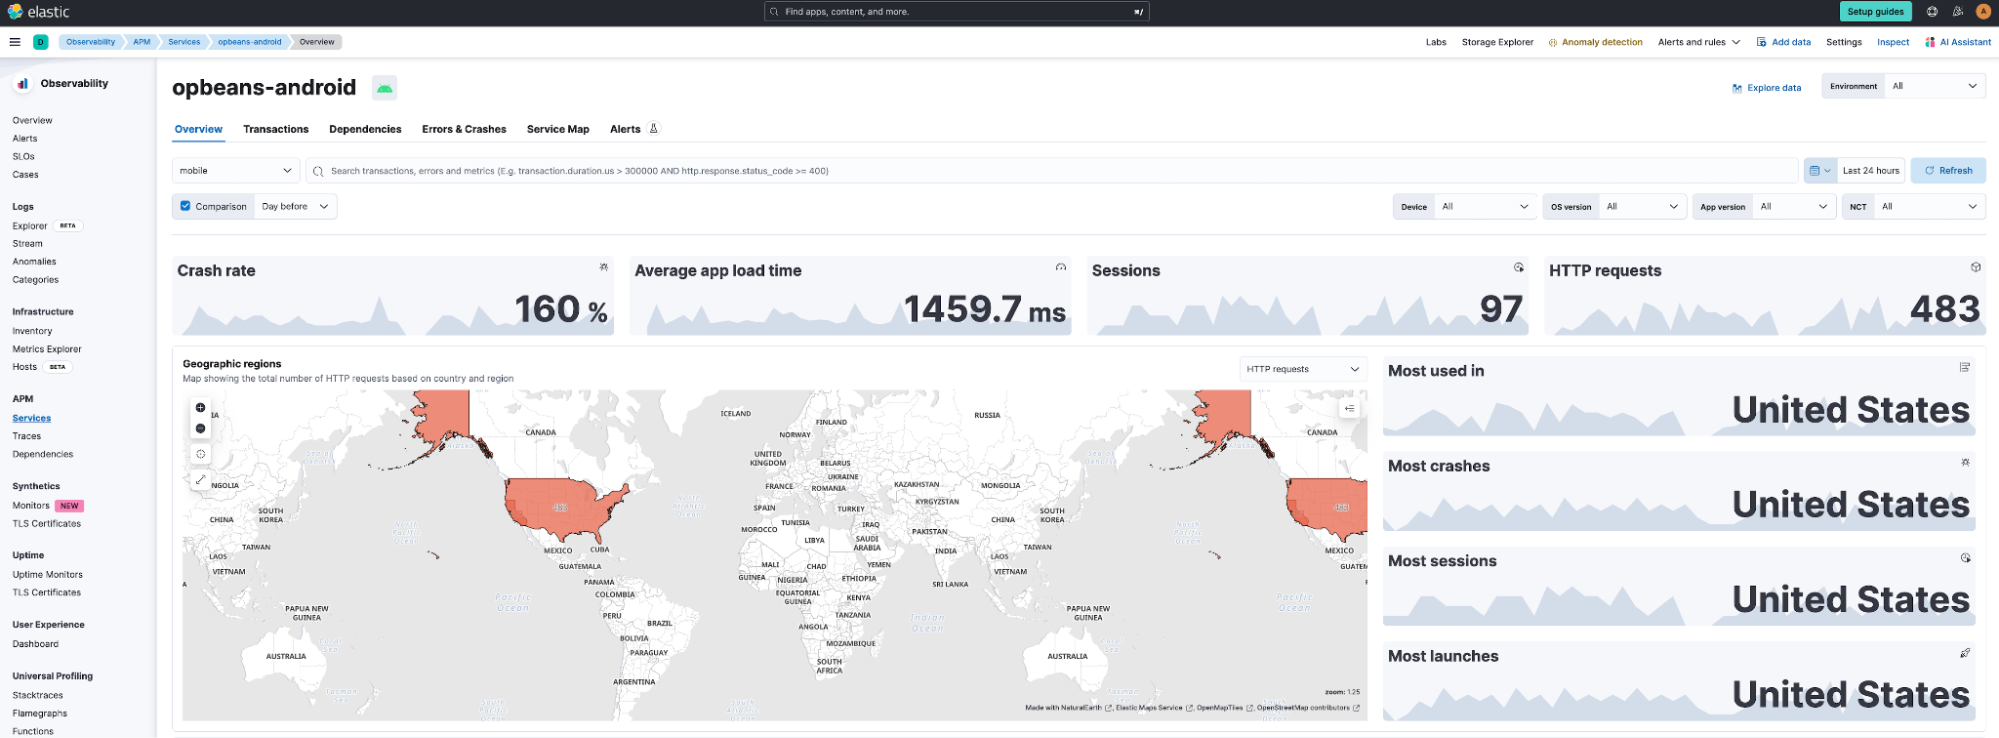
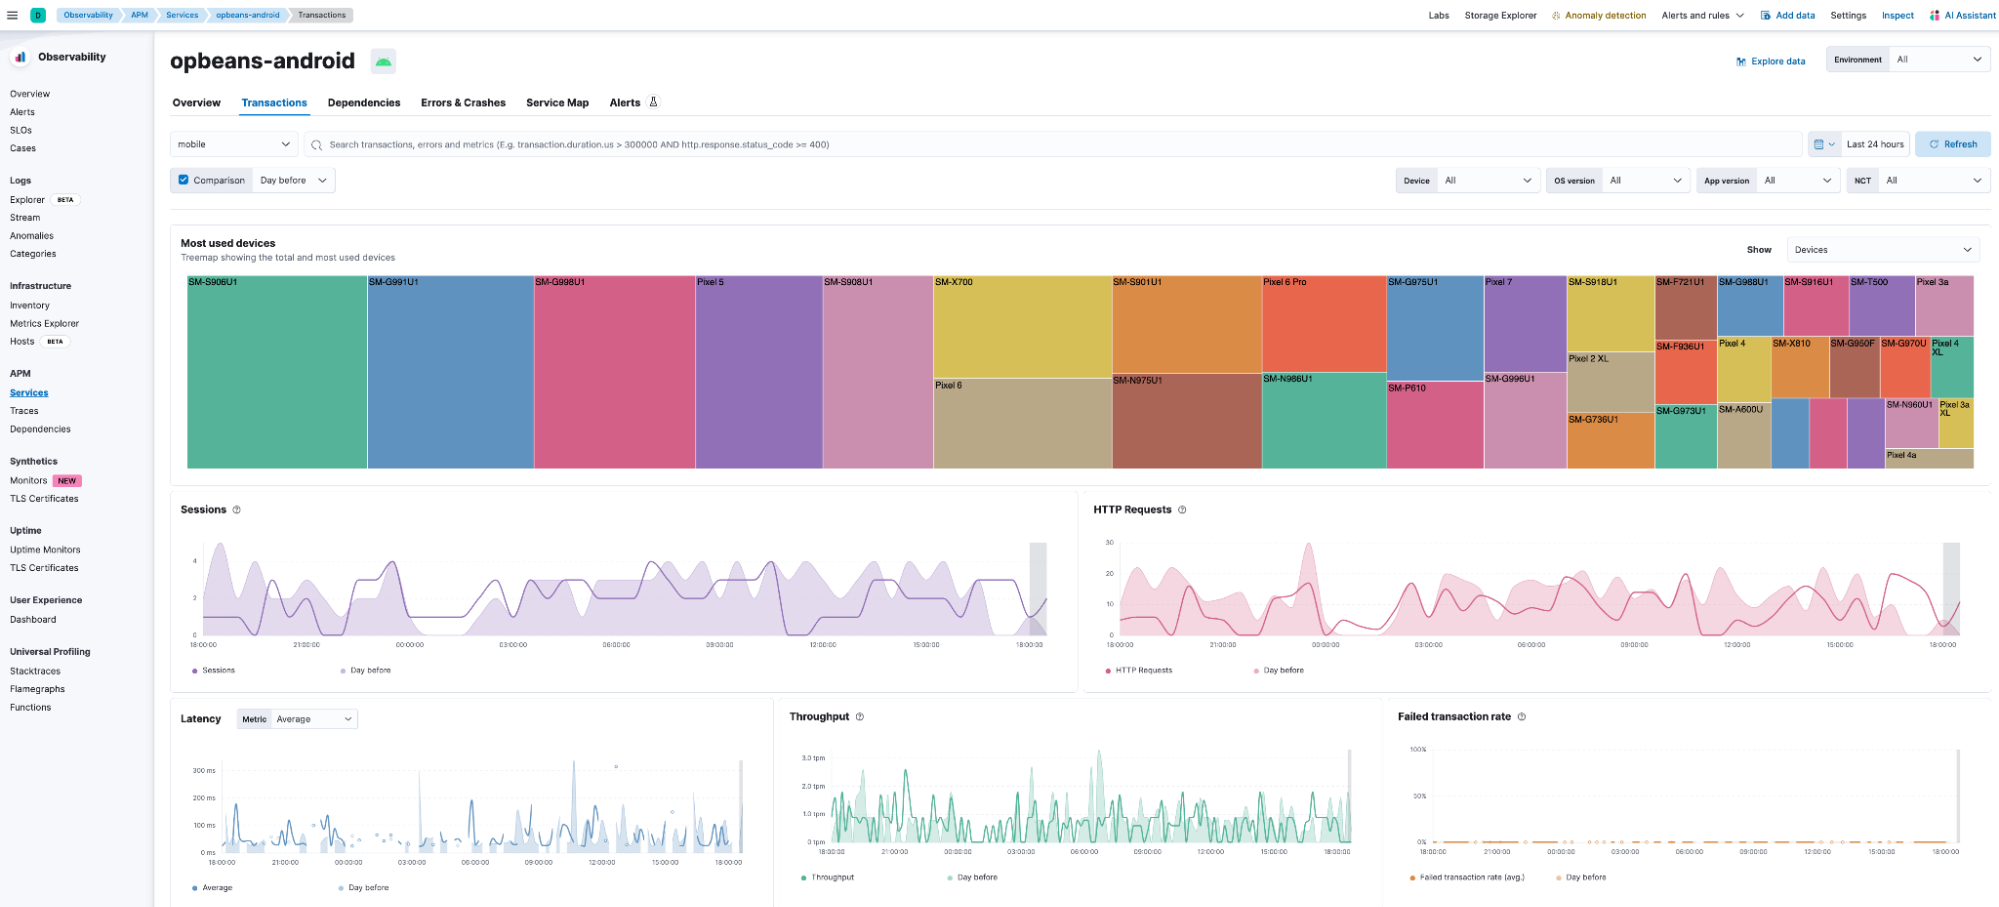
editThe APM solution for iOS and https://www.elastic.co/guide/en/apm/agent/android/current/index.html Native apps is now generally available. Alongside data collection enhancements, the solution includes pre-built dashboards for viewing service interdependencies, end-to-end trace waterfall, and for exploring the impact of app version, OS version, device make/model, geo location, etc., on app performance, as well as dashboards for error and crash analytics.
Private Beta Launch of Elastic Universal Profiling™ on Self-Managed Clusters.
editElastic Universal Profiling™ is a whole-system, always-on, continuous profiling solution that eliminates the need for code instrumentation, recompilation, on-host debug symbols, or service restarts.
Currently, Universal Profiling is generally available in Elastic Cloud (ESS). Owing to popular demand, we are now making it available on self-managed clusters.
Interested in experiencing Universal Profiling on self-managed Elasticsearch clusters? Join the beta program. Fill out this form, and we’ll reach out to start the process.
Hosts: Filtering by service
editEasily filter down to the hosts that your service is running on so you can more easily identify resource constraints, compare behavior across different hosts, and identify the root causes for incidents quicker:
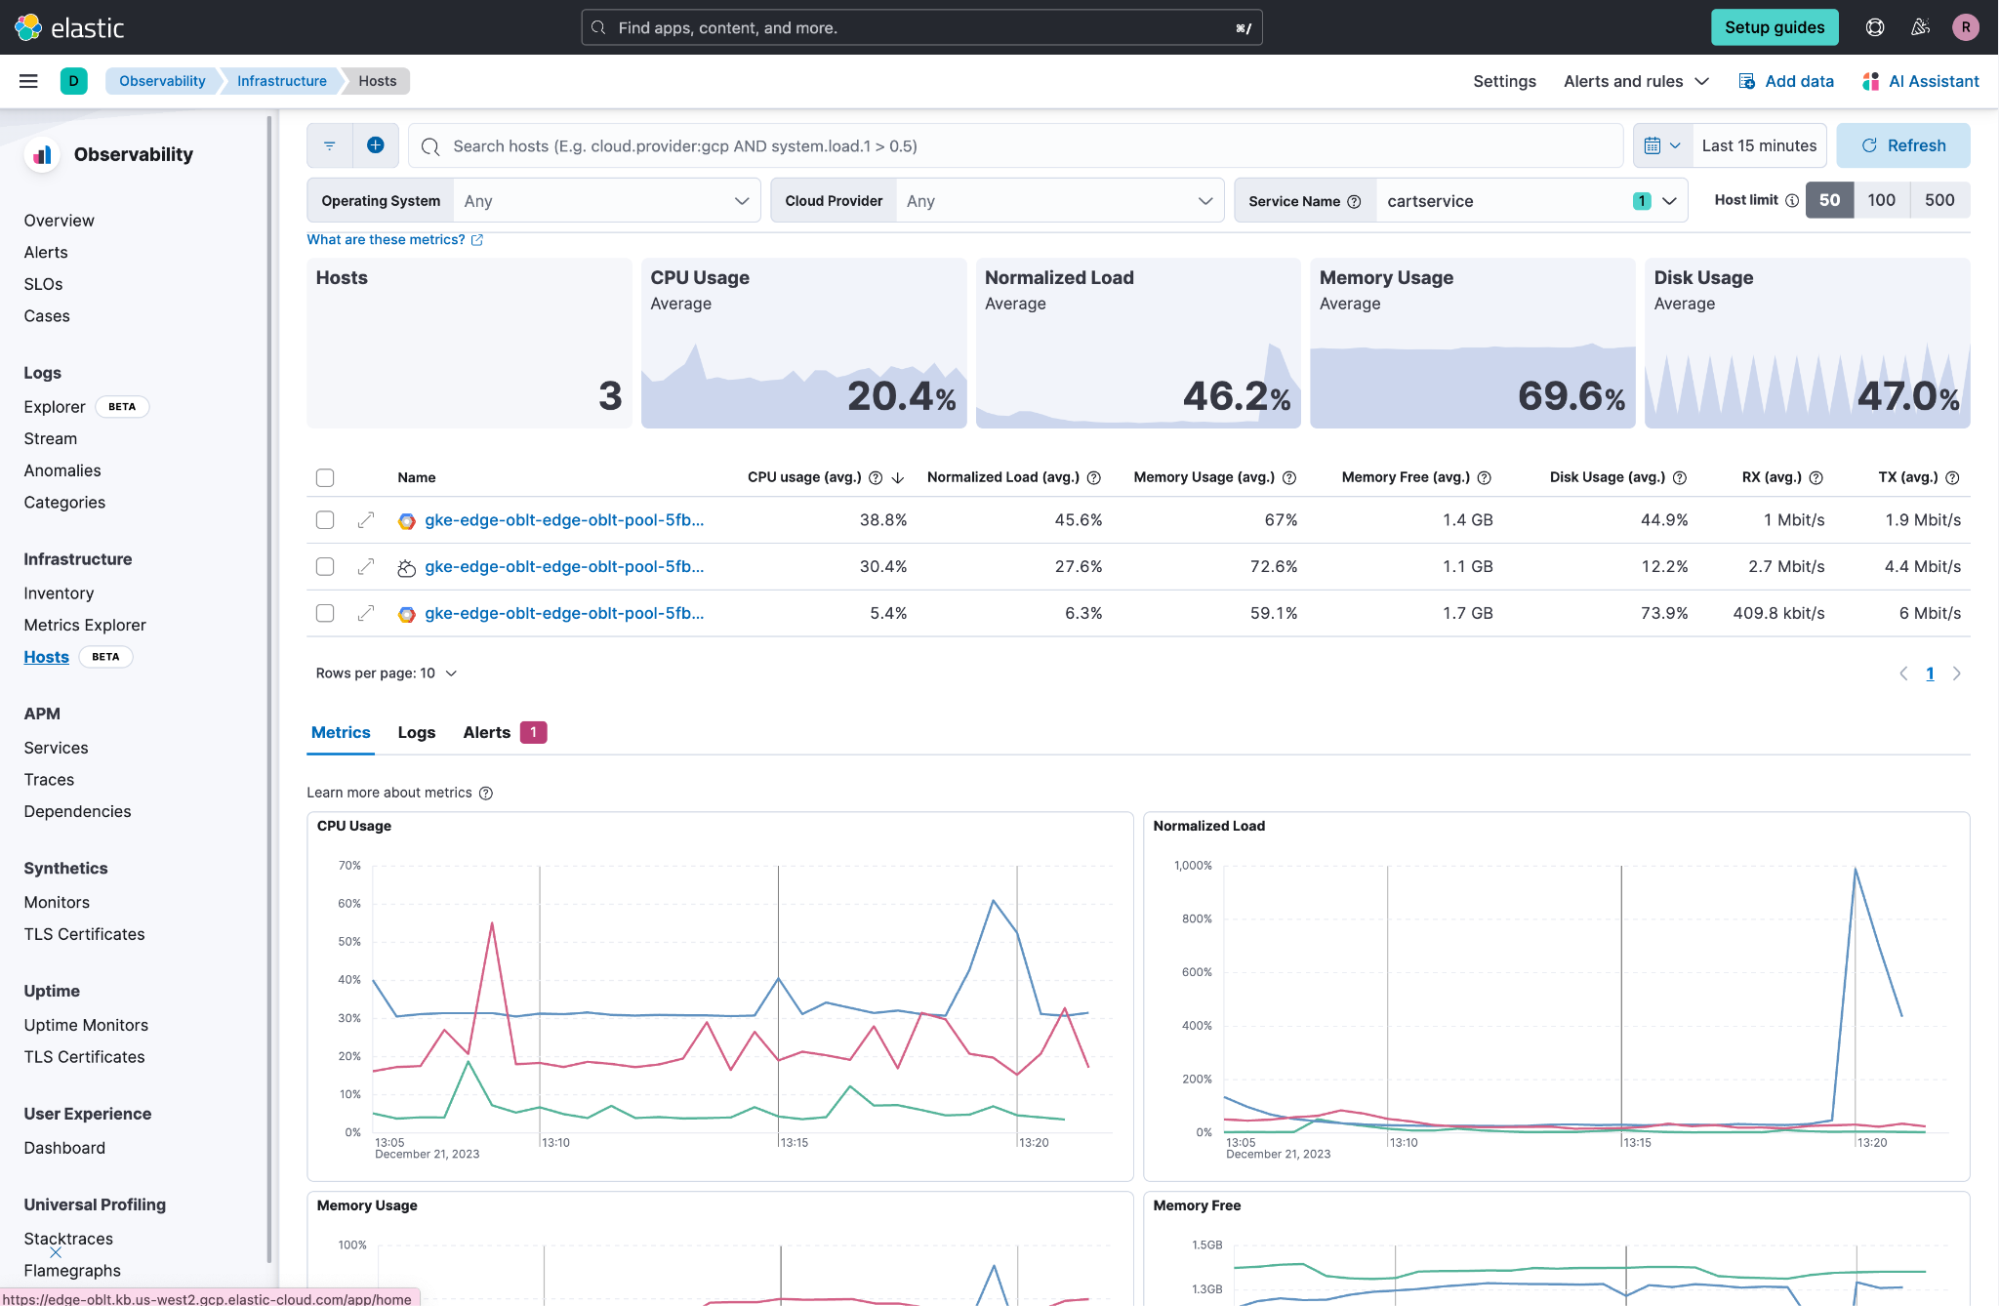
See Analyze hosts to learn more.
Better Together: Profiling and Hosts Integration
editLeverage Universal Profiling to easily understand what is consuming resources on your hosts — right from the host view.
Drill down right into the application code, kernel, and even third-party libraries to help you identify resource bottlenecks so you can resolve incidents quicker and optimize your applications and infrastructure.
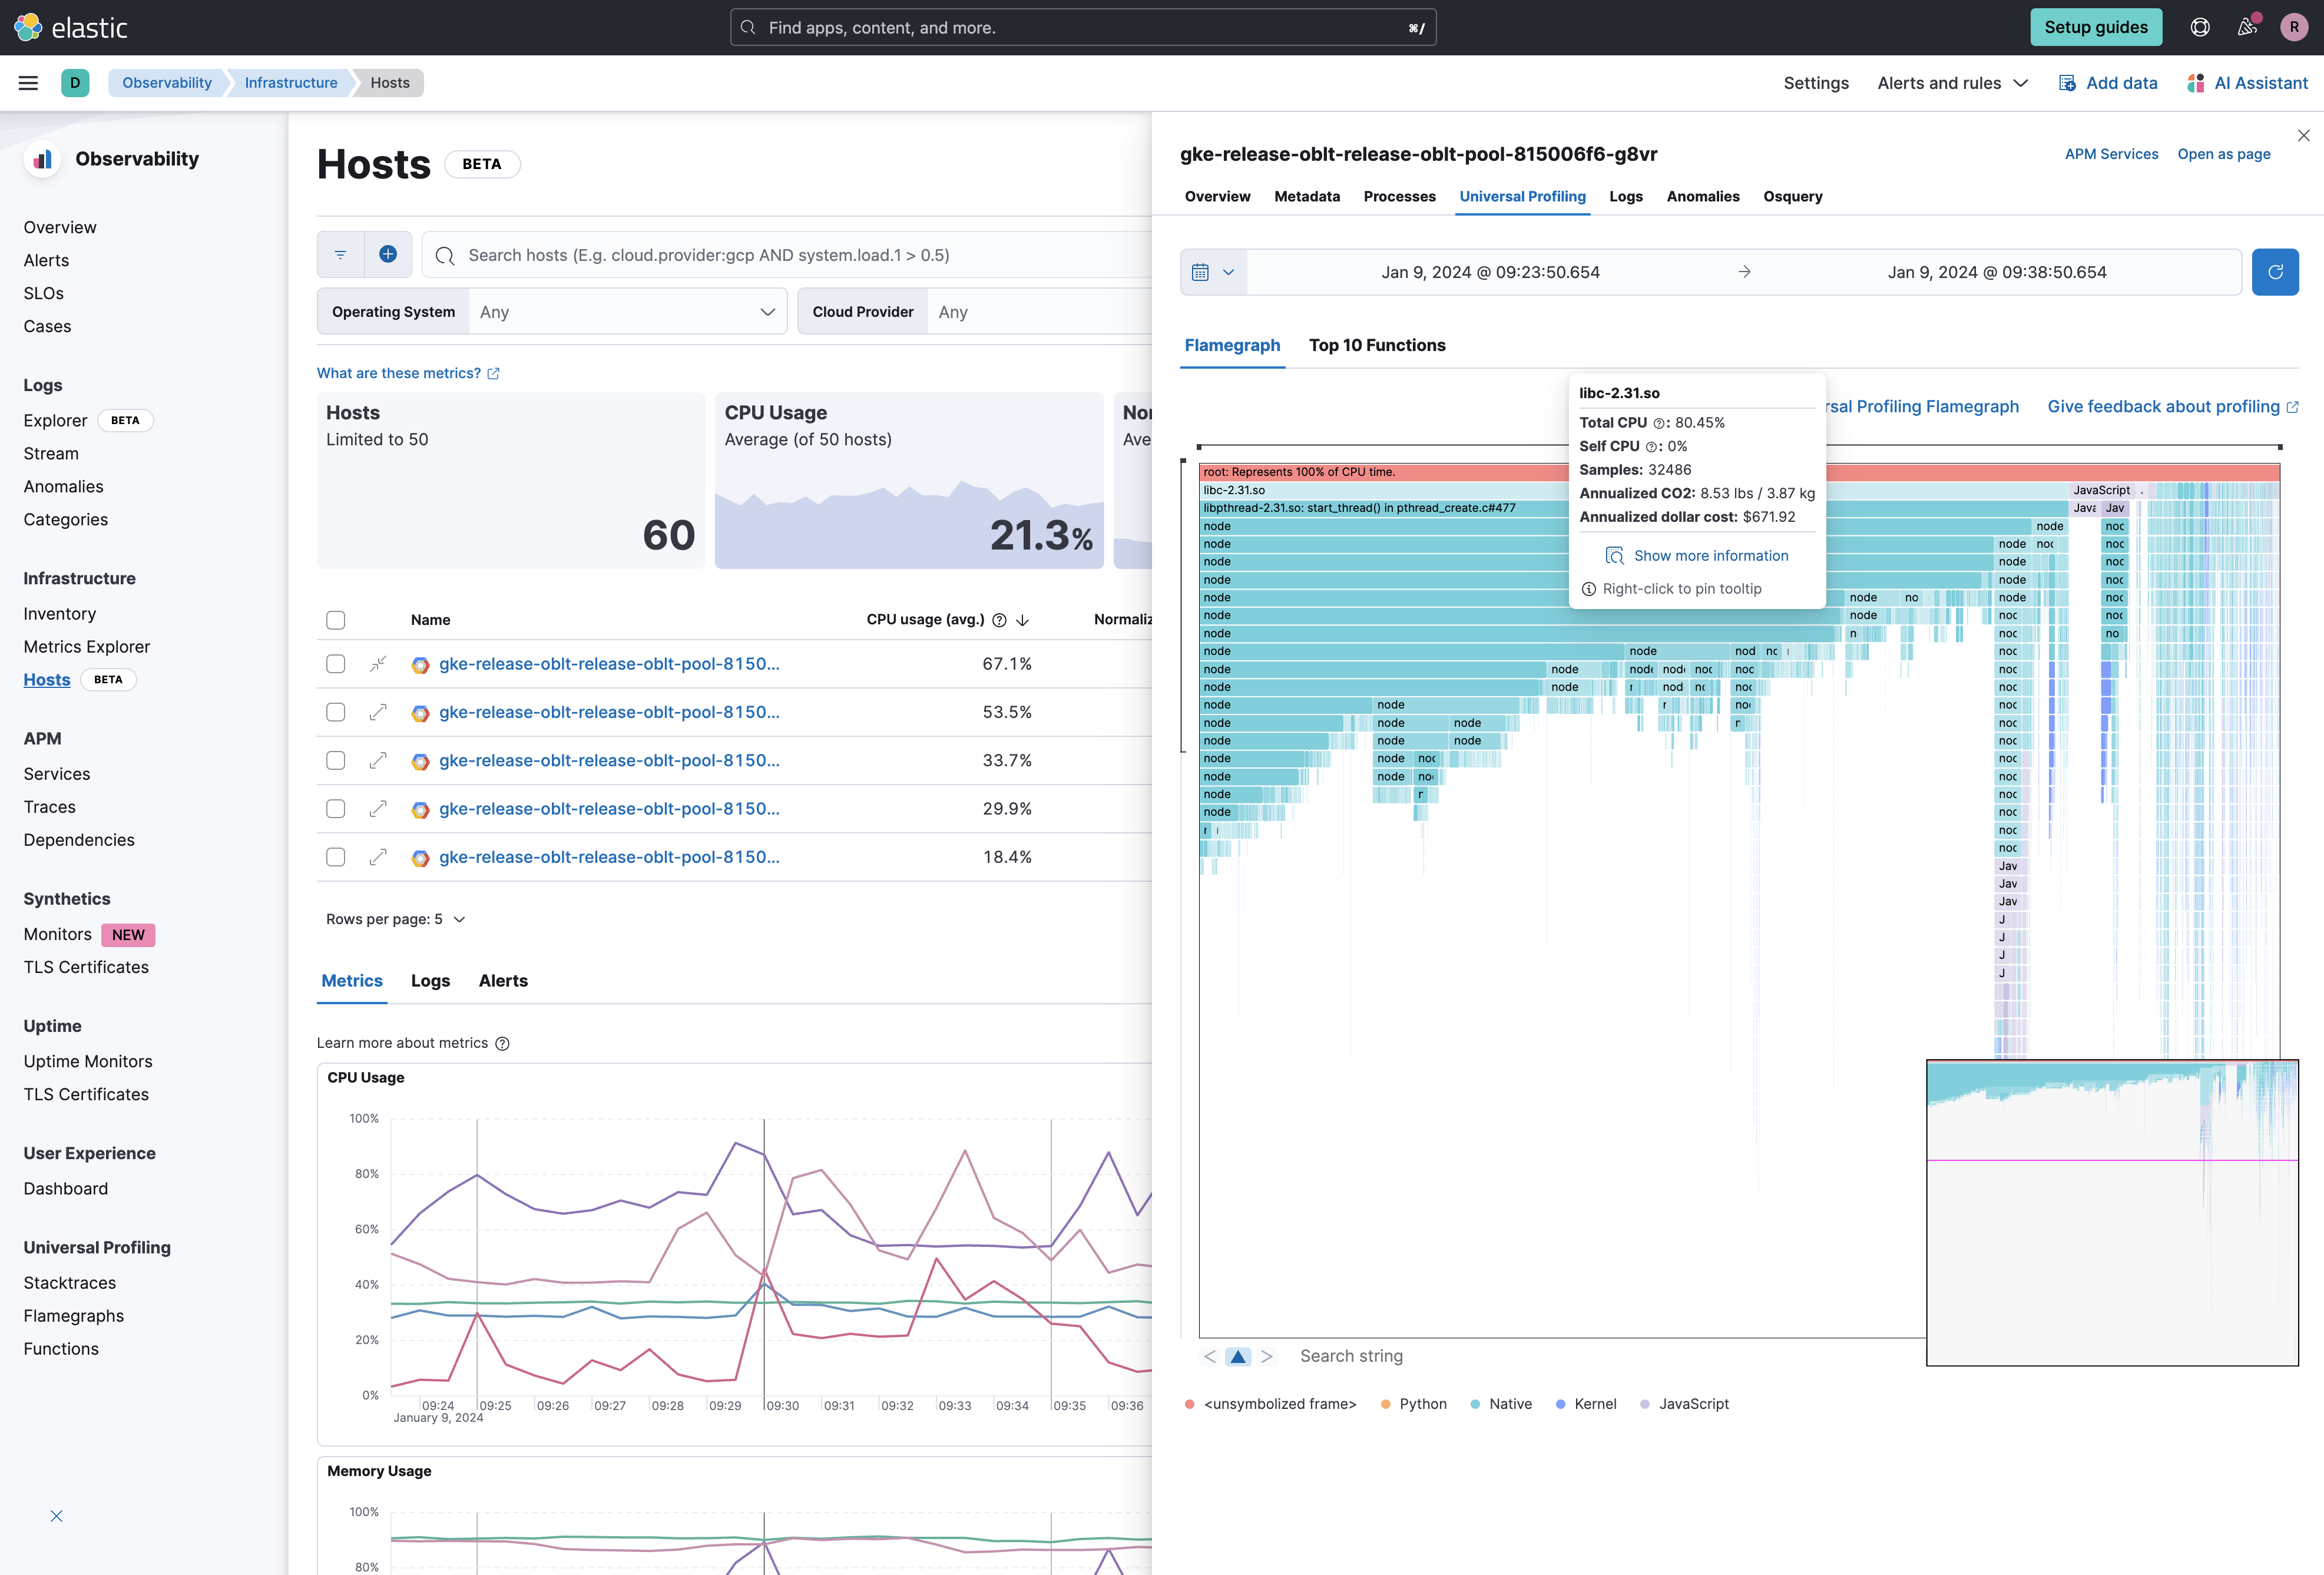
Get started with Universal Profiling.
Azure and Google Cloud Integrations for Elastic Observability now using 70% less storage for metrics
editAzure and Google Cloud integrations for Elastic Observability have been enhanced with Elasticsearch TSDB mode (Time Series Database). This advancement results in a significant 70% reduction in disk space required for storing metrics.
To benefit from this improvement, users only need to upgrade their Elastic Agent integration to the latest version. The upgrade seamlessly creates a new TSDB index, and automatic rollover is applied without any additional user intervention.

RUM Agent Captures New Google Core Web Vital: INP
editWith the launch of 8.12, we now support the new Interaction to Next Paint (INP) metric. This metric replaces First Input Delay (FID) in Google’s Core Web Vitals. We have updated the User Experience app within Observability to display the new INP metric alongside the other two Core Web Vitals. This new metric will also be available in Exploratory View and Lens.
To capture the INP metric, {apm-rum-agent-ref-v}/install-the-agent.html[upgrade to version 5.16.0 or newer] of our RUM JS agent.
The RUM agent will continue to capture the FID metric, which is available in custom dashboards and Lens.