What’s new in 8.4
editWhat’s new in 8.4
editHere are the highlights of what’s new and improved in 8.4.
Other versions: 8.3 | 8.2 | 8.1 | 8.0 | 7.17 |
New Synthetics App enhancements for public beta
editAs we progress towards delivering an all new Synthetic Monitoring capability within Elastic Observability, we’re excited to announce two big new enhancements for our 8.4 stack release:
- Private testing locations
- Open access to the managed testing service for all Elastic Cloud users
With private testing locations you can now configure a testing location on self-managed infrastructure. This means you can test applications that aren’t publicly available on the internet or from locations where Elastic may not yet have a managed testing node presence.
A big part of our new Synthetics app is the ability to run synthetic monitoring tests on our new global network of managed testing locations. With the 8.4 release, we’ll no longer be requiring users to request access. To use our managed testing infrastructure, open the Uptime app and click Monitor Management. There is a fair usage cap in place but all test executions are free. We’d love to get you involved and get your feedback.
Observability alerting and rules views now generally available (GA)
editAlerting and rule management for Observability-specific alerts and rules have been offered as a technical preview since 7.16. We have made significant improvements since then and we now have robust, feature-rich capabilities that are production ready.
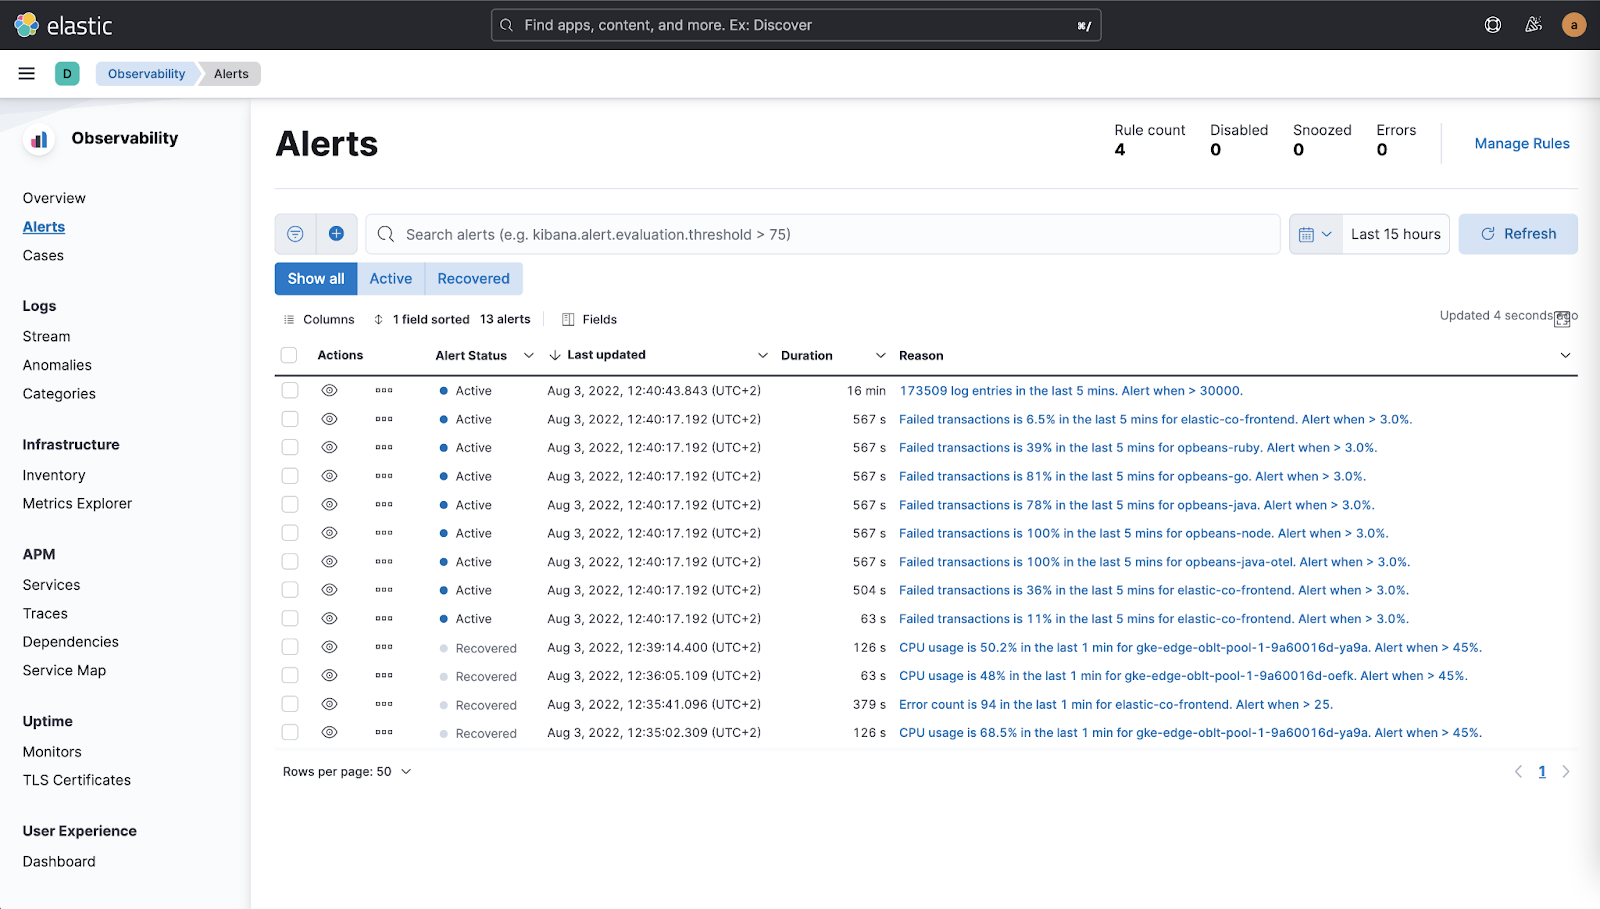
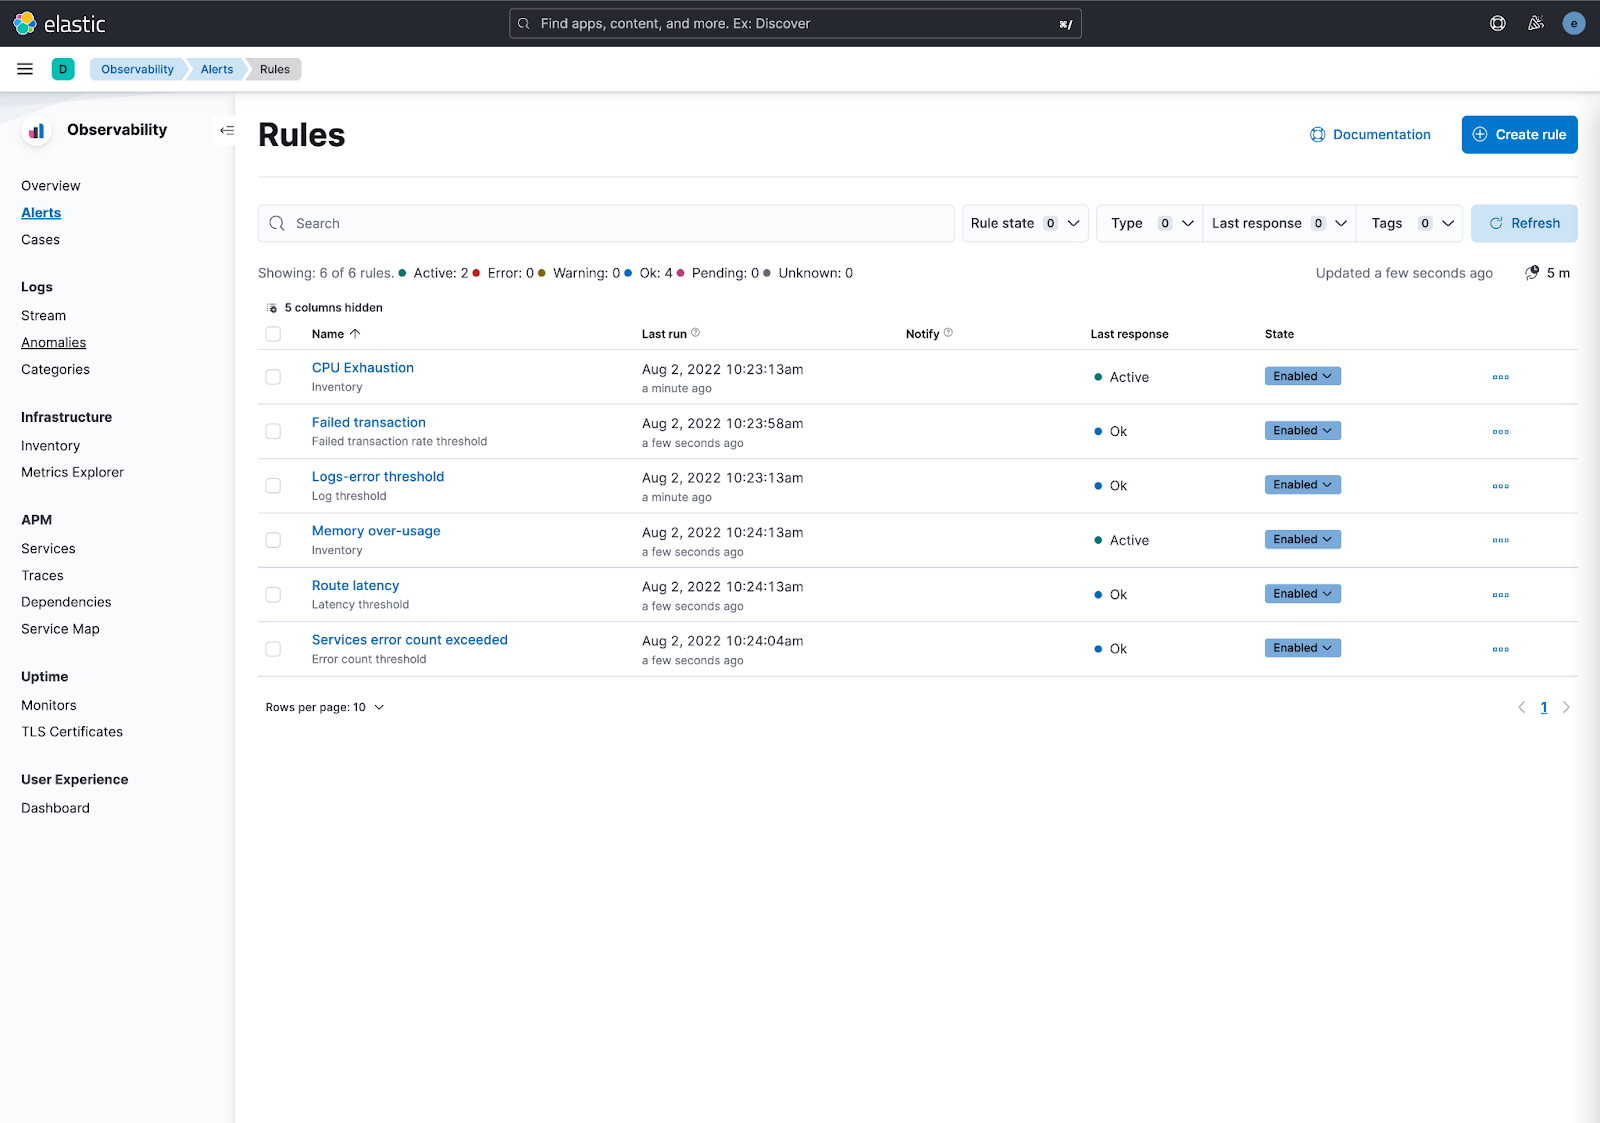
Working alongside Cases functionality for incident management, Observability Alerts and Rules views provide an easy way to access and manage Observability-specific rules, alerts, and cases within the Observability UI. With comprehensive filtering and search support, you can quickly view or edit alerts or rules of interest.
The rule details page offers rule creators and administrators a complete history of rule executions and seamless access to generated alerts for effective management. In 8.4 the rule details page has been further enhanced to include an at-a-glance alert summary that shows the status and timeline for triggered alerts, along with a number of other UI improvements, including bulk action support.
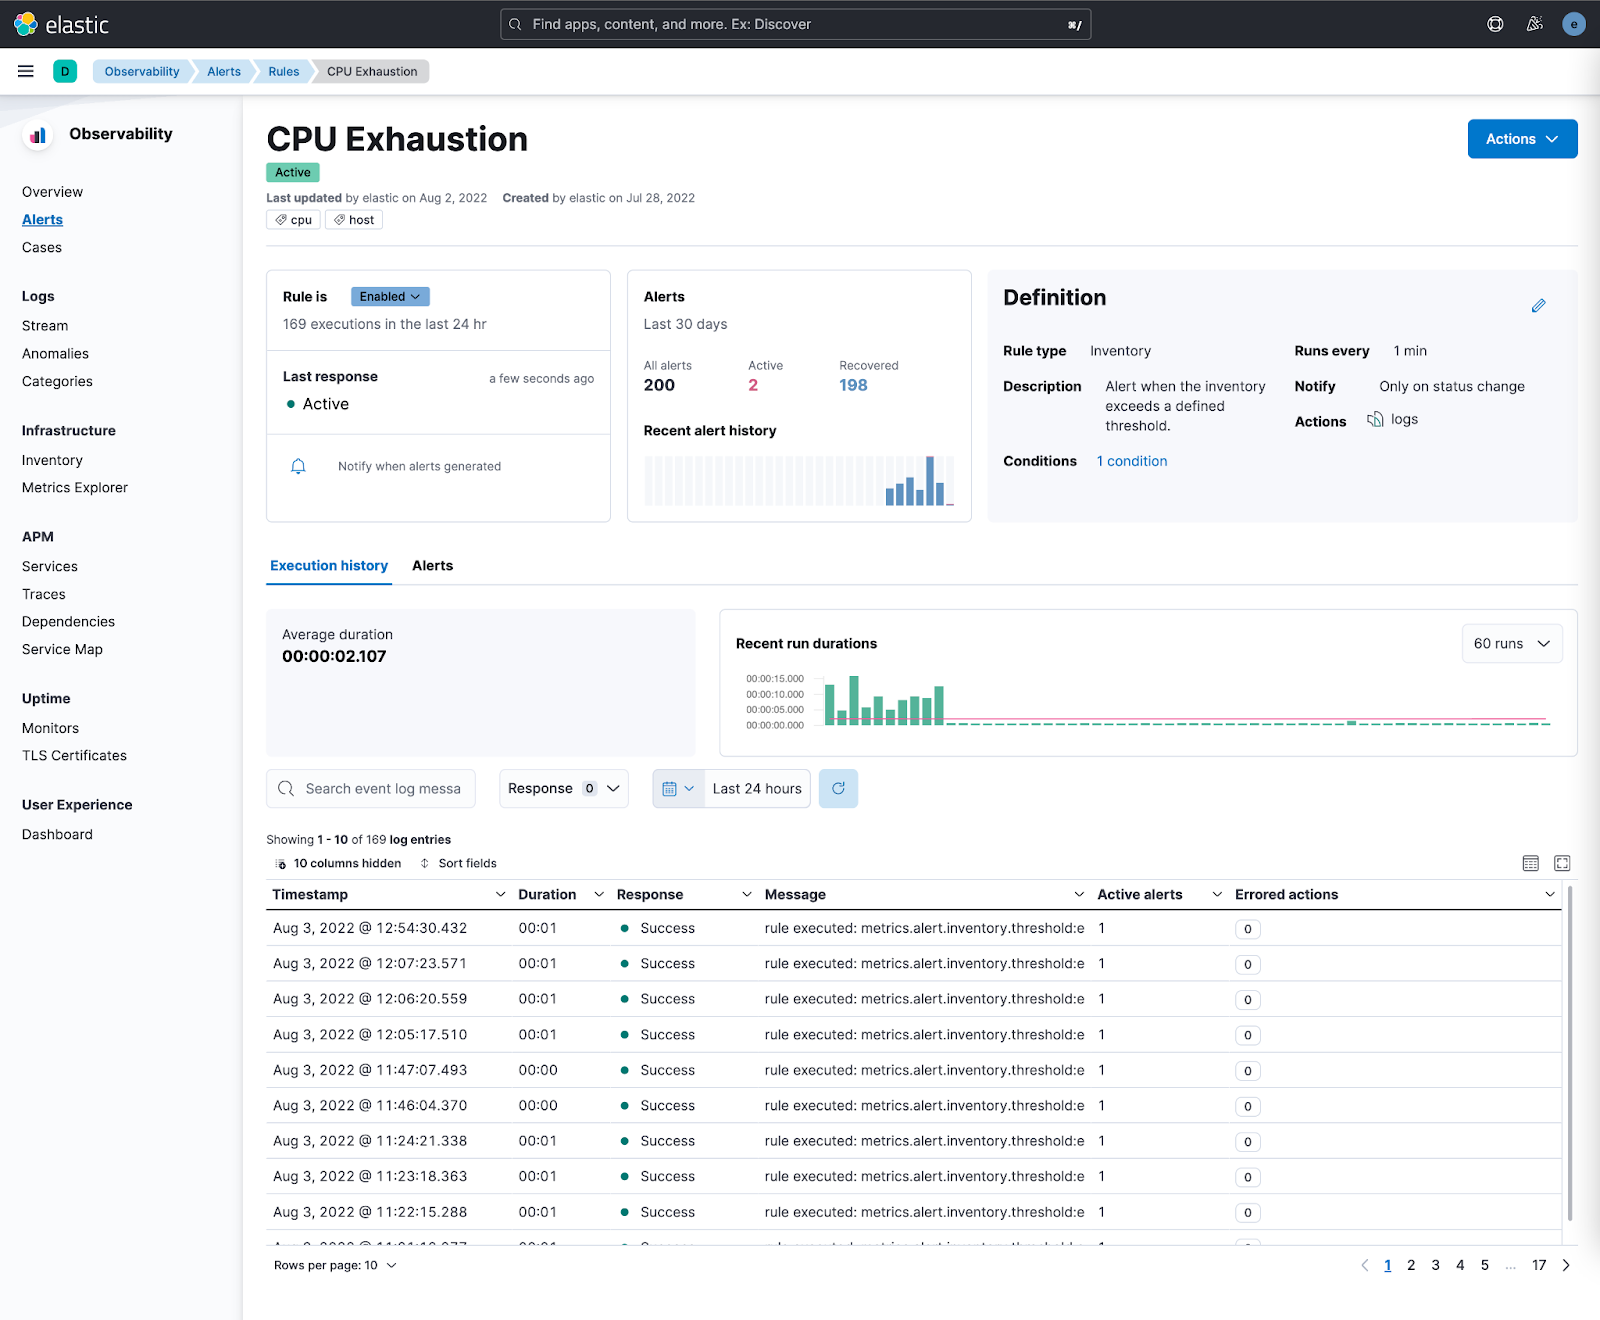
For more information on Observability alerting, refer to Create alerts.
Improved RCA flows for erroneous services
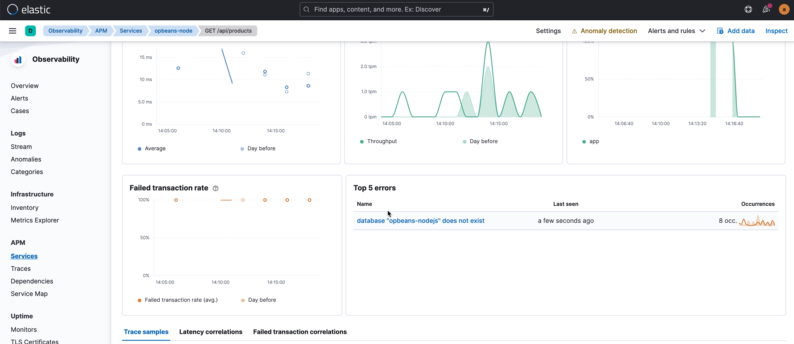
editWith two new Top 5 views introduced for version 8.4, you can quickly identify the impact of application errors and reduce time spent identifying and tracking errors.
The Top 5 errors view is available from the APM Transaction details page:
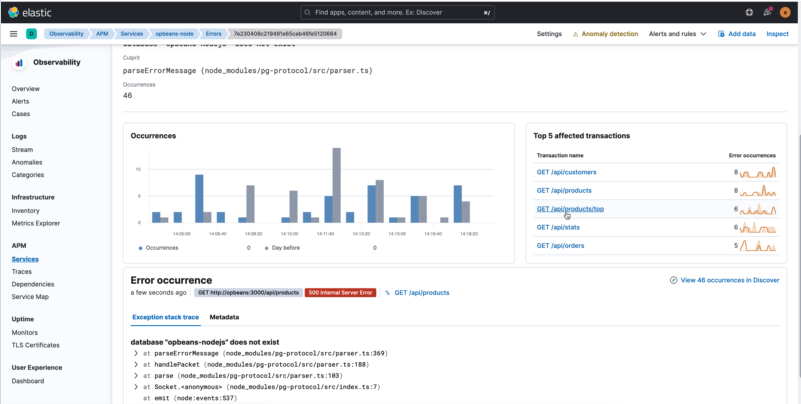
The Top 5 affected transactions view is available from the APM Error Group details pages:
Contextual view of infrastructure metrics for APM Services (Beta)
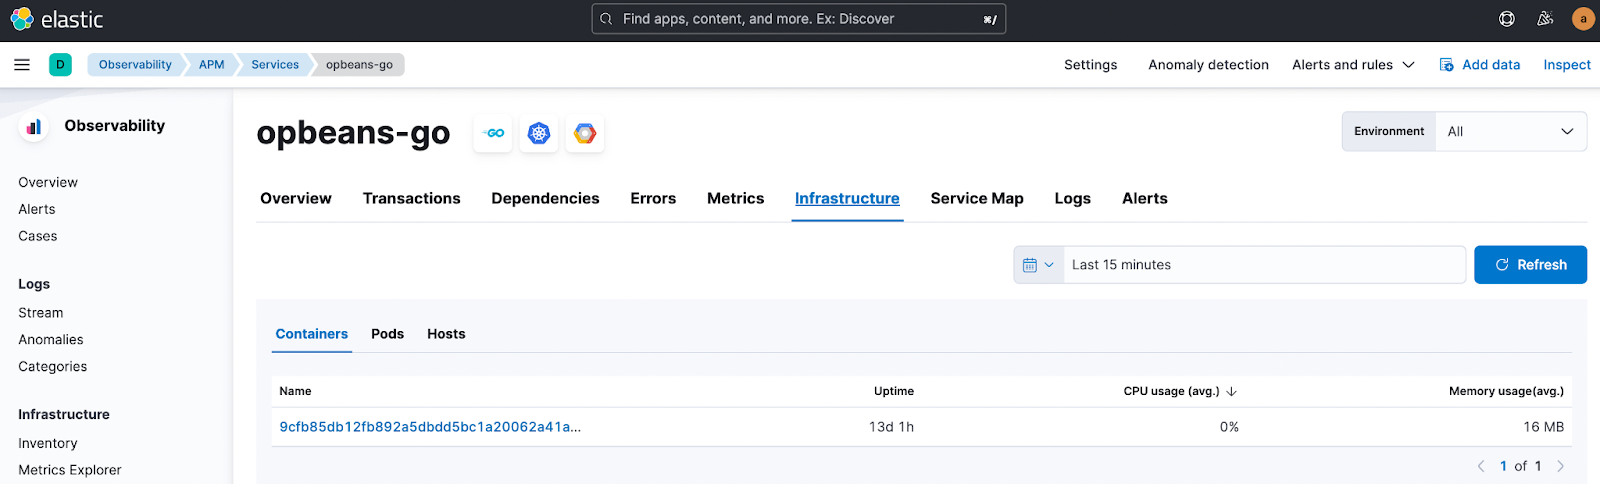
editBringing together metric and trace data provides powerful insights to help you understand application performance and identify the source of any issues. Available as a beta feature in 8.4, Infrastructure metrics for containers, pods, and hosts are available in the context of individual services. You can use the new Infrastructure tab in the APM Service Overview to get a summary view of the infrastructure supporting a service, and drill down into metrics for additional details.
Native onboarding flow for Open Telemetry instrumentation
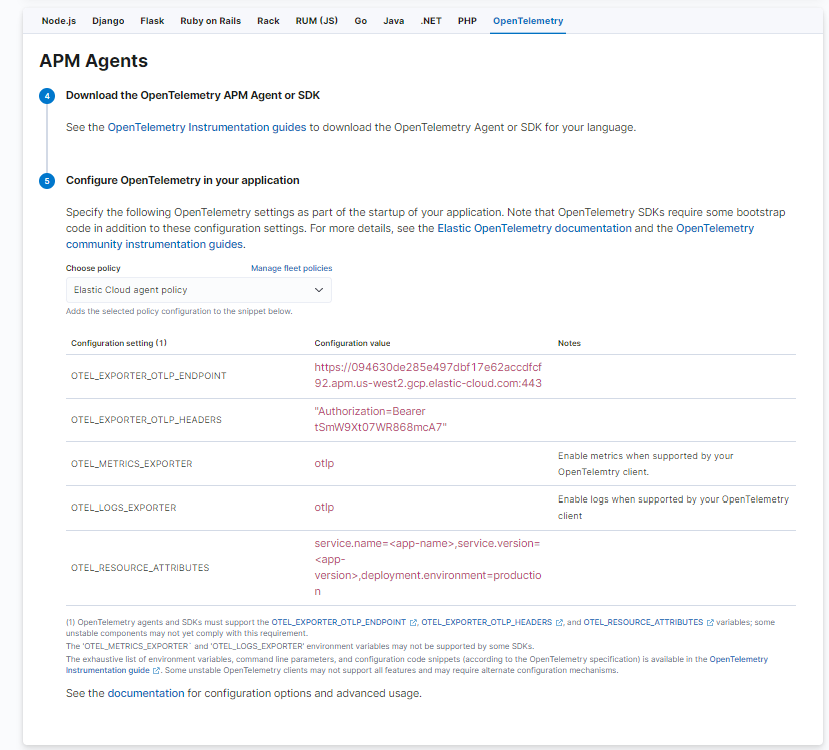
editWith Elastic APM already natively supporting the OpenTelemetry protocol, instrumentation instructions have been added to Elastic APM agent onboarding to simplify and streamline the use of OpenTelemetry agents with Elastic APM.
In addition, APM Server has now added support for ingestion of OpenTelemetry summary metrics (sum and count), including those created by Prometheus exporters.
For more information, refer to the OpenTelemetry documentation
Custom ingest pipeline support for APM integration
editThe Elastic APM integration now supports custom ingest pipelines. A custom pipeline allows you to transform data to better match your specific use case. This can be useful, for example, to ensure data security by removing or obfuscating sensitive information.
For more information, refer to the Ingest pipelines documentation
Customisable Kubernetes dashboards available out-of-the-box
editWith Elastic Observability 8.4, ITOps and SRE teams can leverage out-of-the-box Kubernetes dashboards for cluster-level visibility into essential Kubernetes components (nodes, pods, deployments, etc.). Notable features include:
- Highly customizable dashboards – you can use Kibana Lens to update or remove panels, or create new panels using the smart suggestion capability
- Improved navigation between related Kubernetes components and dashboards with Kibana’s drill-down capability
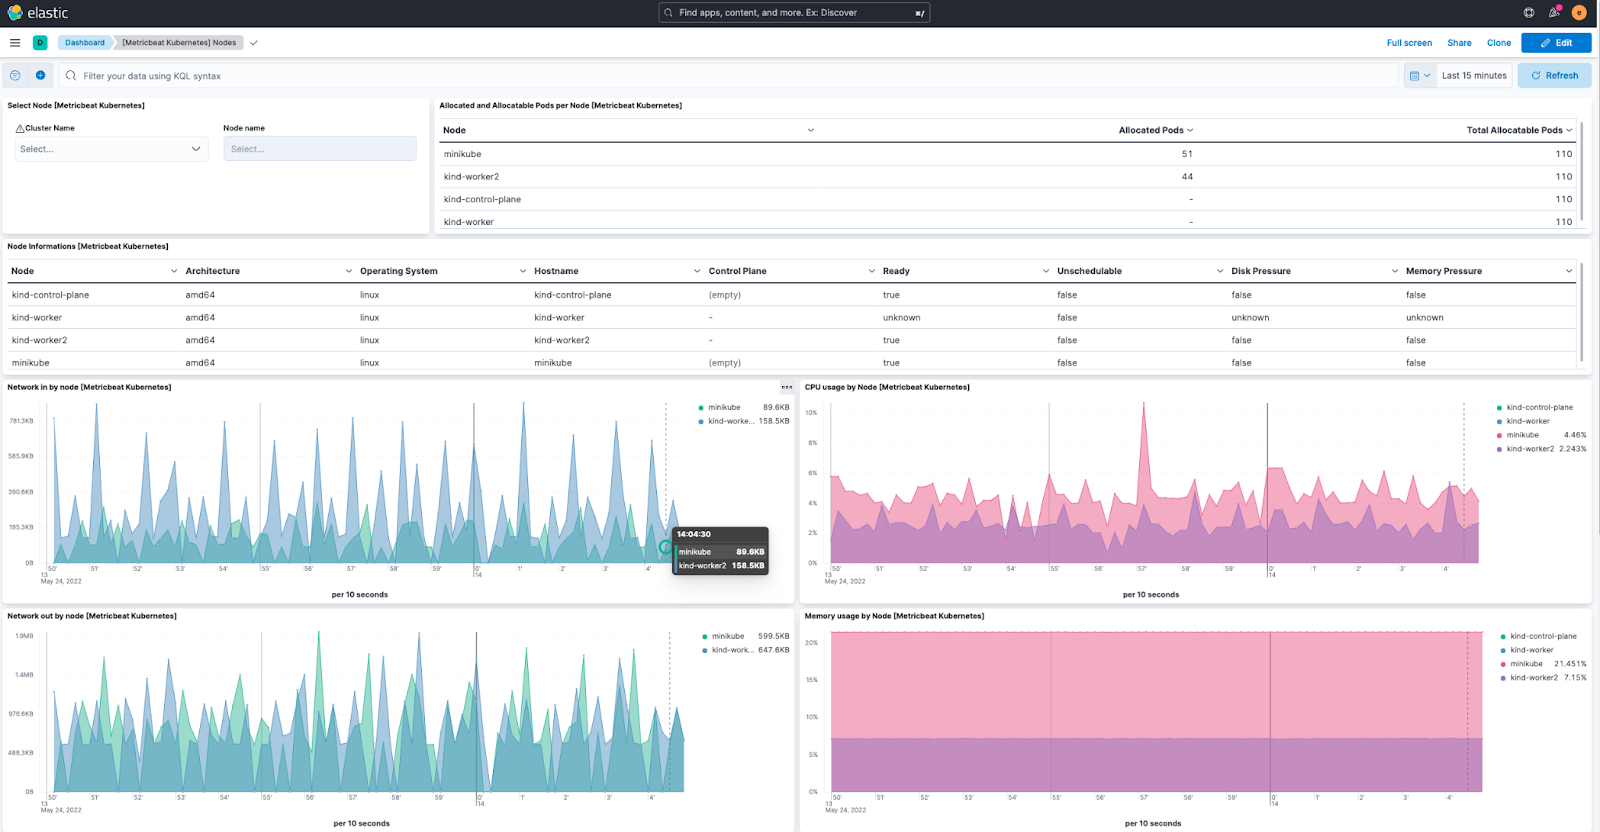
Get at-a-glance correlation of signals gathered from K8s clusters, and gain better insight into cluster status with highly customizable resource-centric views that are easy to use and share.
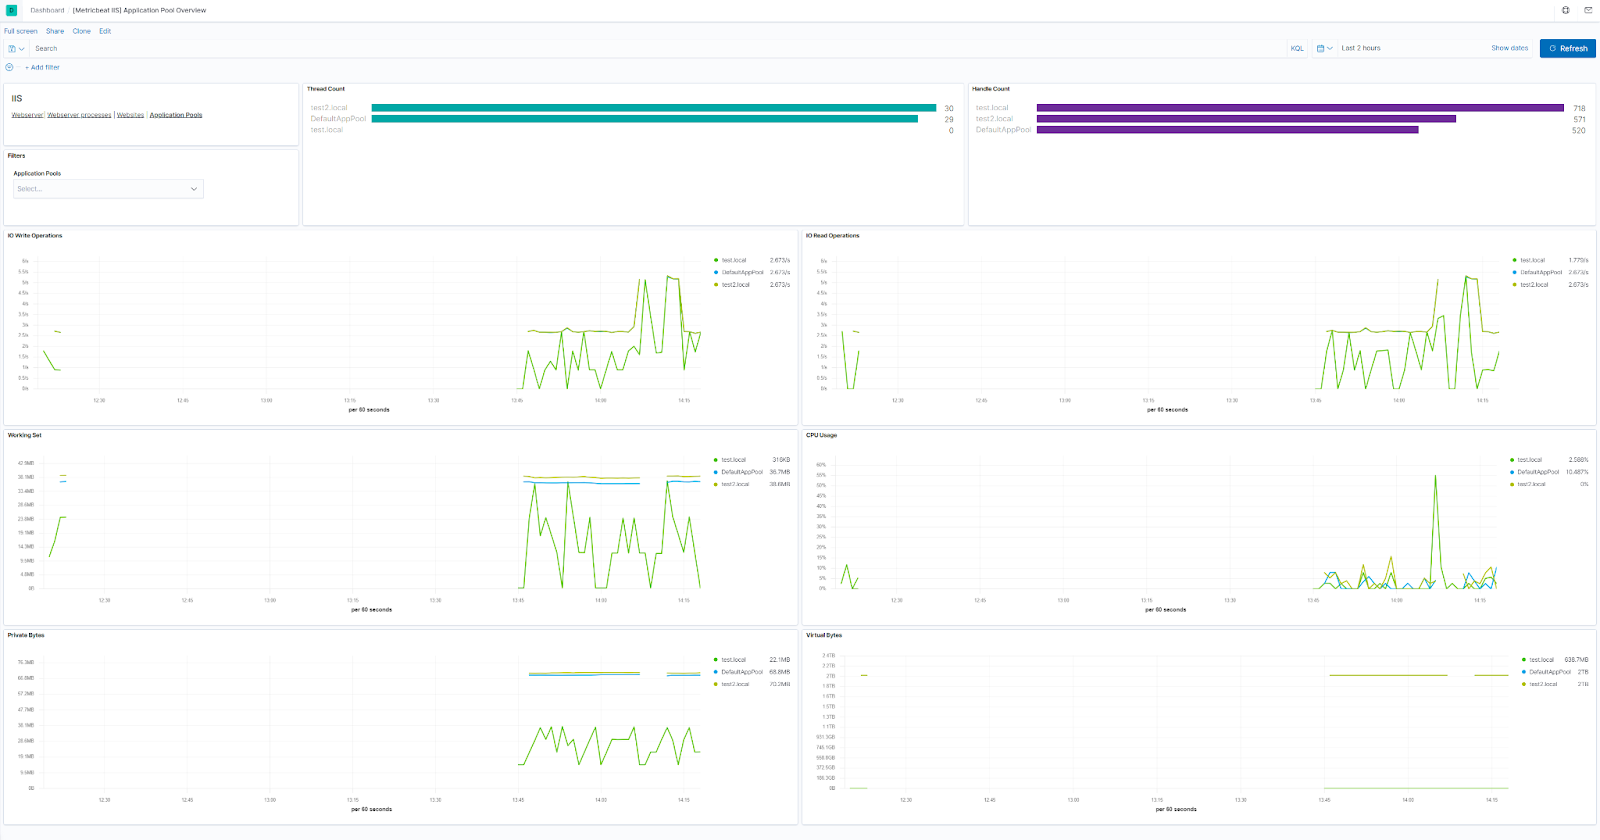
Monitor your IIS server performance
editTake advantage of the new IIS integration which makes it easier than ever to monitor and visualize IIS and .NET metrics in the context of web services running on IIS, including alerting for user experience issues.
This new integration provides deep visibility into each web server process group and helps correlate host and NW metrics with web server-specific metrics for better fault identification and isolation.
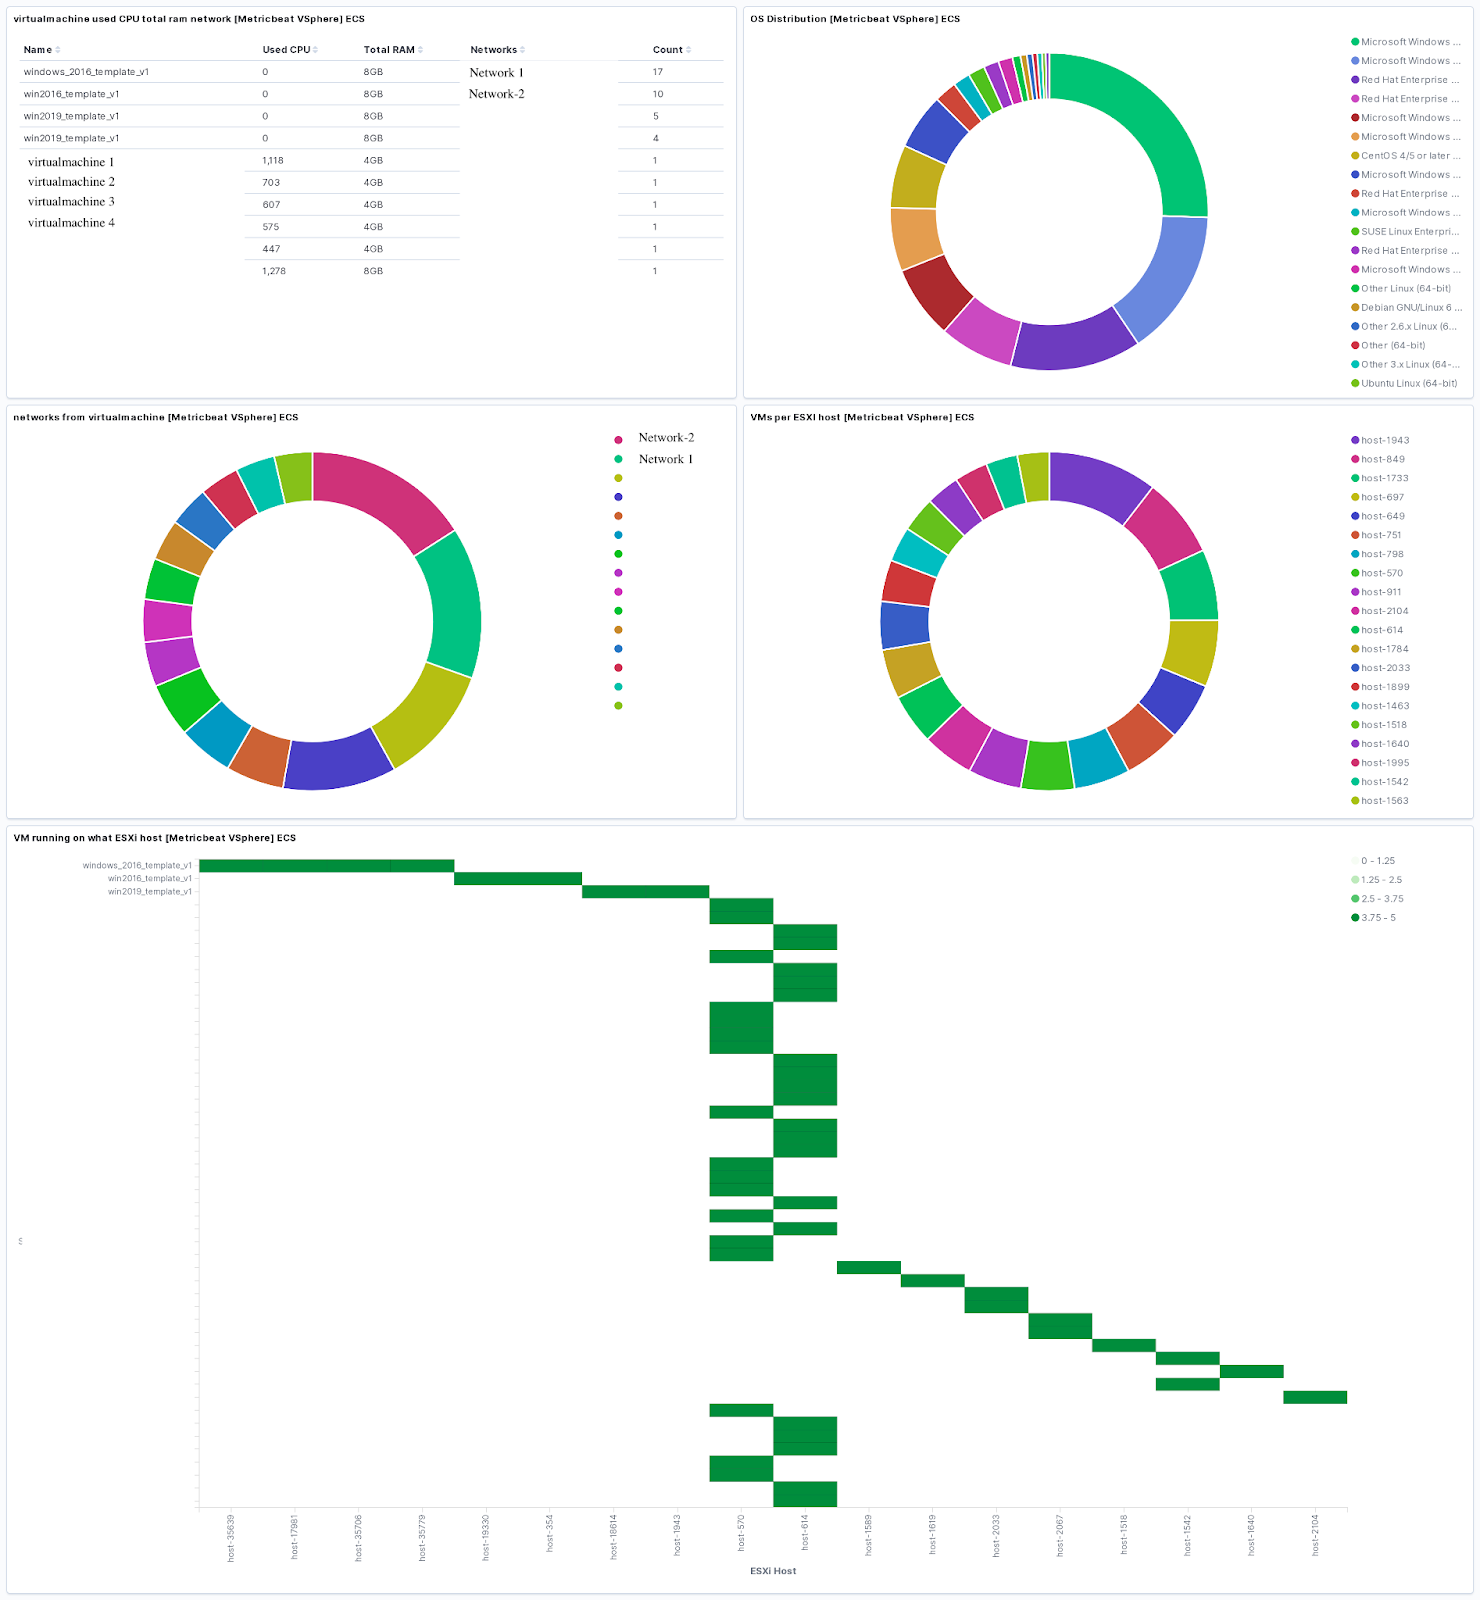
Monitor VM health and performance from system perspective
editThe new vSphere integration enables optimal splitting and performance allocation between VMs. You can now reduce time to detect problems and pinpoint the root cause in your virtualization and application layer by discovering how your virtualized configuration impacts your app servers and end user experience.