What’s new in 8.7
editWhat’s new in 8.7
editHere are the highlights of what’s new and improved in 8.7.
Other versions: 8.6 | 8.5 | 8.4 | 8.3 | 8.2 | 8.1 | 8.0 | 7.17 |
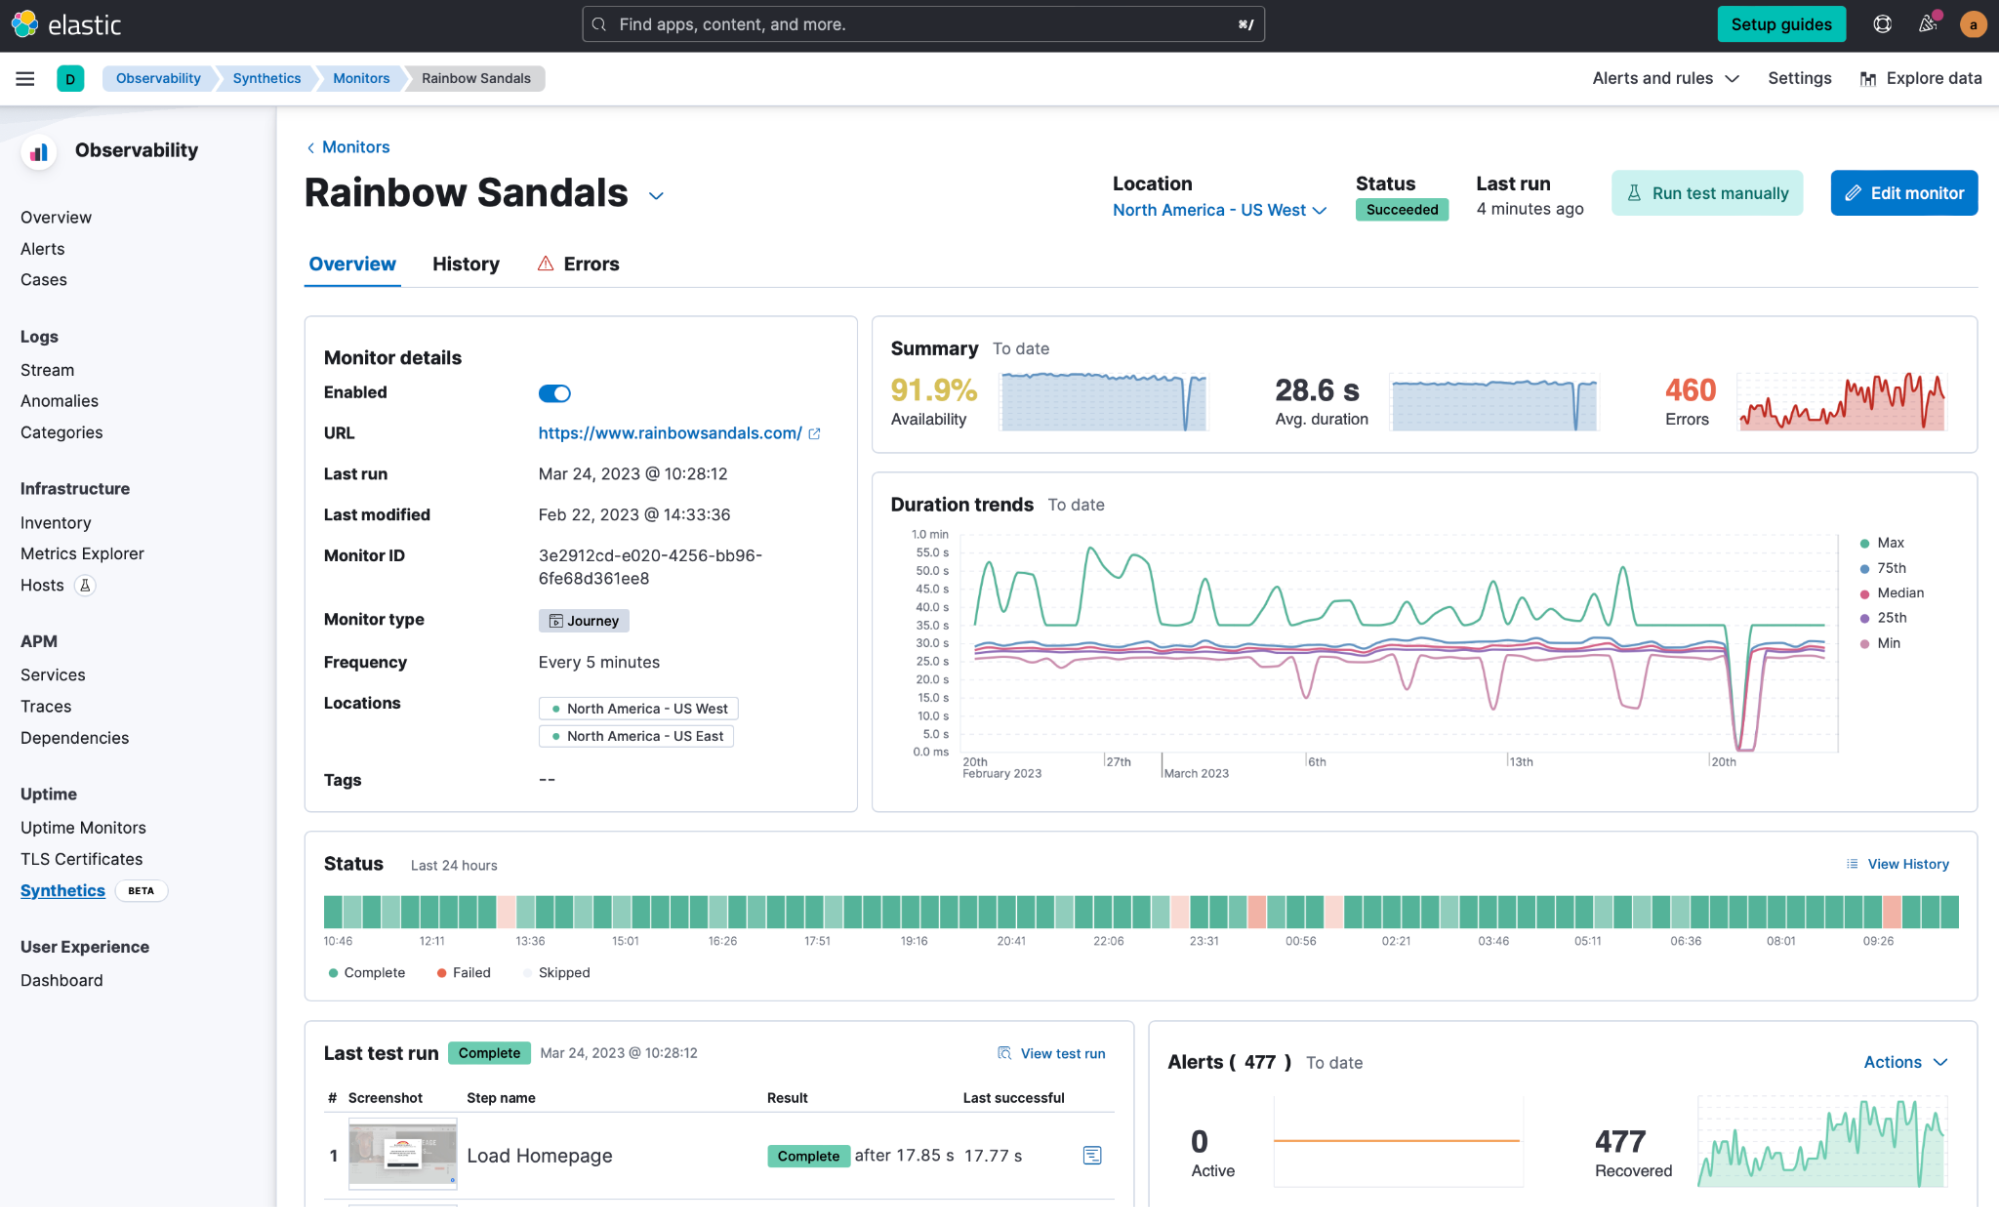
Synthetic Monitoring UI Available in Beta
editWith the 8.7 release, the beta of the all-new Synthetic Monitoring app is available to all users. This innovative app offers an enhanced user experience, with improved visualization and easy-to-use features that help users monitor their web applications' performance and availability. It empowers users to create, manage, and analyze synthetic tests with increased efficiency. As part of the public beta, users are encouraged to provide feedback for further refinement and optimization of the UI, contributing to its ongoing development and eventual full-scale release.
Synthetics Integration Deprecating
editThe original Synthetics integration is being deprecated. Starting in version 8.8, any monitors configured via the integration (Integrations > Elastic Synthetics) will stop running. This applies to both Zip URL and inline monitors.
We strongly recommend migrating these monitors to Project Monitors or configuring them in the Synthetics app, under Observability, in the Kibana UI.
If you have any such monitors configured, starting in version 8.7, you will receive the following warning in Uptime advising you to migrate:
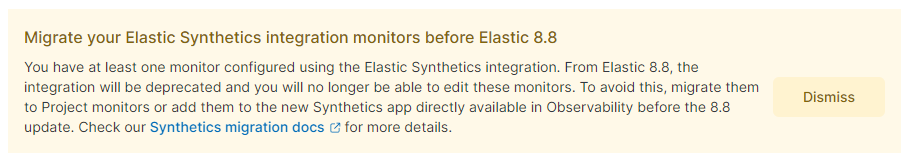
More details about how to migrate from the Synthetics integration to the recommended approach can be found here.
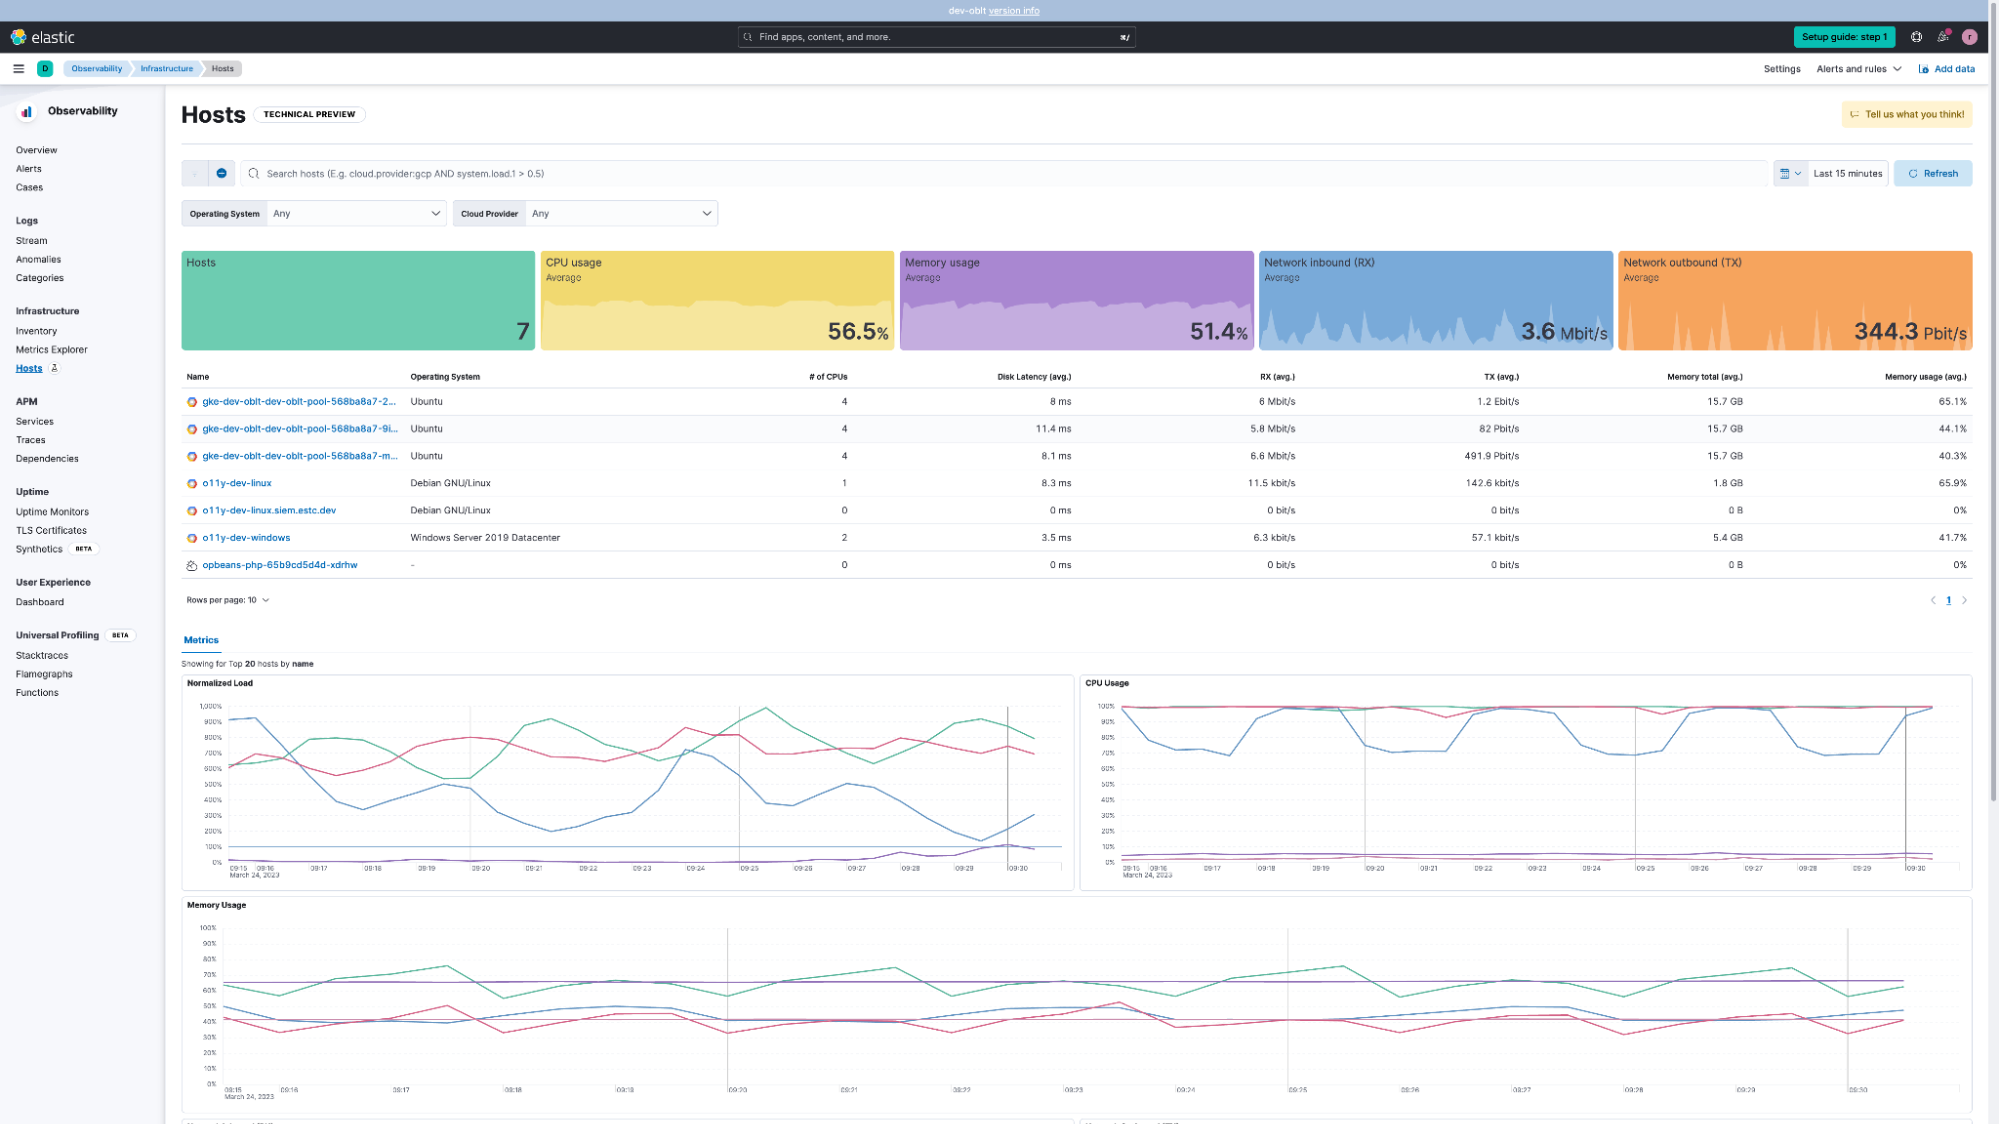
Hosts Feature Available under Technical Preview
editWe are launching a new Hosts feature to allow users to find, analyze, and compare hosts more quickly within Observability. This will help you isolate problems quicker and identify underperforming hosts.
You will be able to:
- Search for the hosts you care about
- Compare metrics between hosts
- Drill into a specific host
- Continue your analysis using Lens visualizations
Distributed Tracing Support for Azure Functions
editElastic Observability 8.7 introduces distributed tracing for Microsoft Azure Functions—available for the Elastic APM Agents for .NET, Node.js, and Python. Auto-instrumentation of HTTP requests is supported out-of-the-box, enabling the detection of performance bottlenecks and sources of errors.
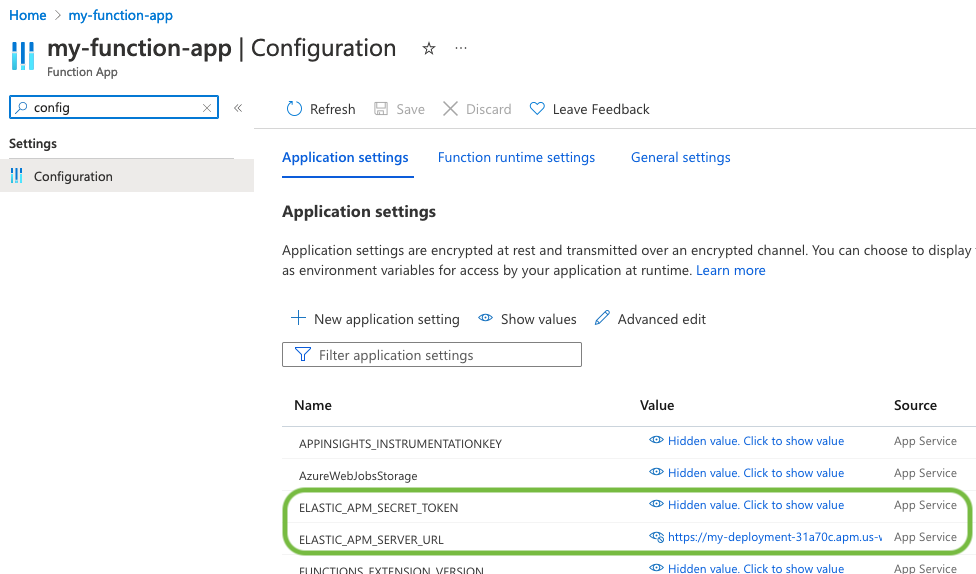
Onboarding for tracing Azure functions is fast, requiring only minor changes to the Azure Functions application code. Configuration instructions are available in the APM agent documentation. Additionally, the Elastic APM Server URL and secret token must be defined in the application settings for the Function App in the Azure Portal, as shown below:
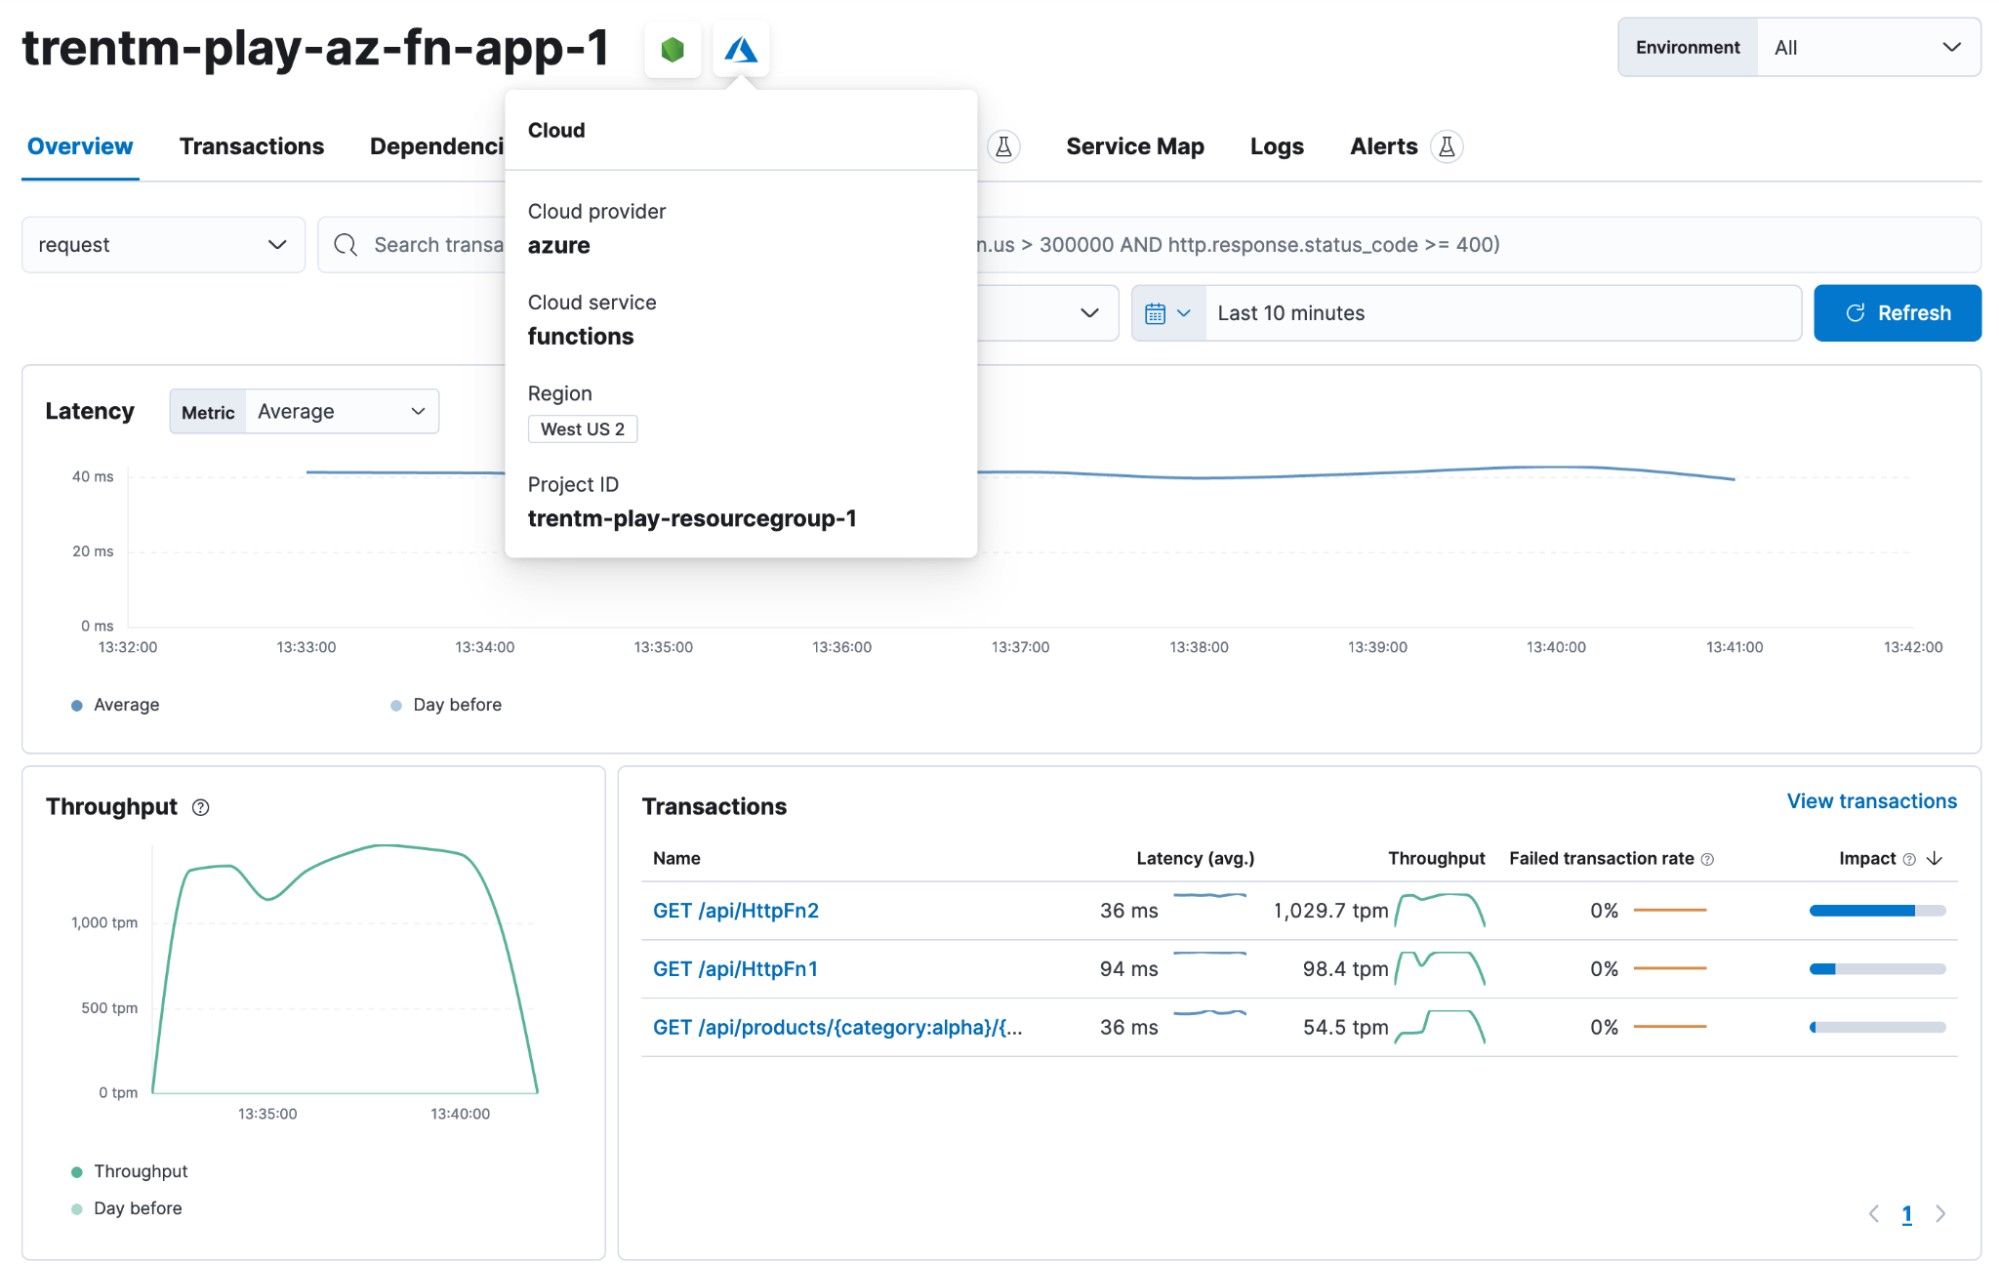
All that’s left is to log into the Elastic APM UI in Kibana. This screenshot shows an instrumented Azure Function App with three HTTP-triggered functions:
Mobile APM Solution for Native iOS and Android Apps
editElastic Application Observability introduced the support of end-to-end distributed tracing for native iOS and Android apps in the 8.6 release as a technical preview feature. Further improvements have been made to the overall solution in the 8.7 release. The Elastic APM Android & iOS Agents have been developed from scratch on top of OpenTelemetry, an open standard, and framework for Observability.
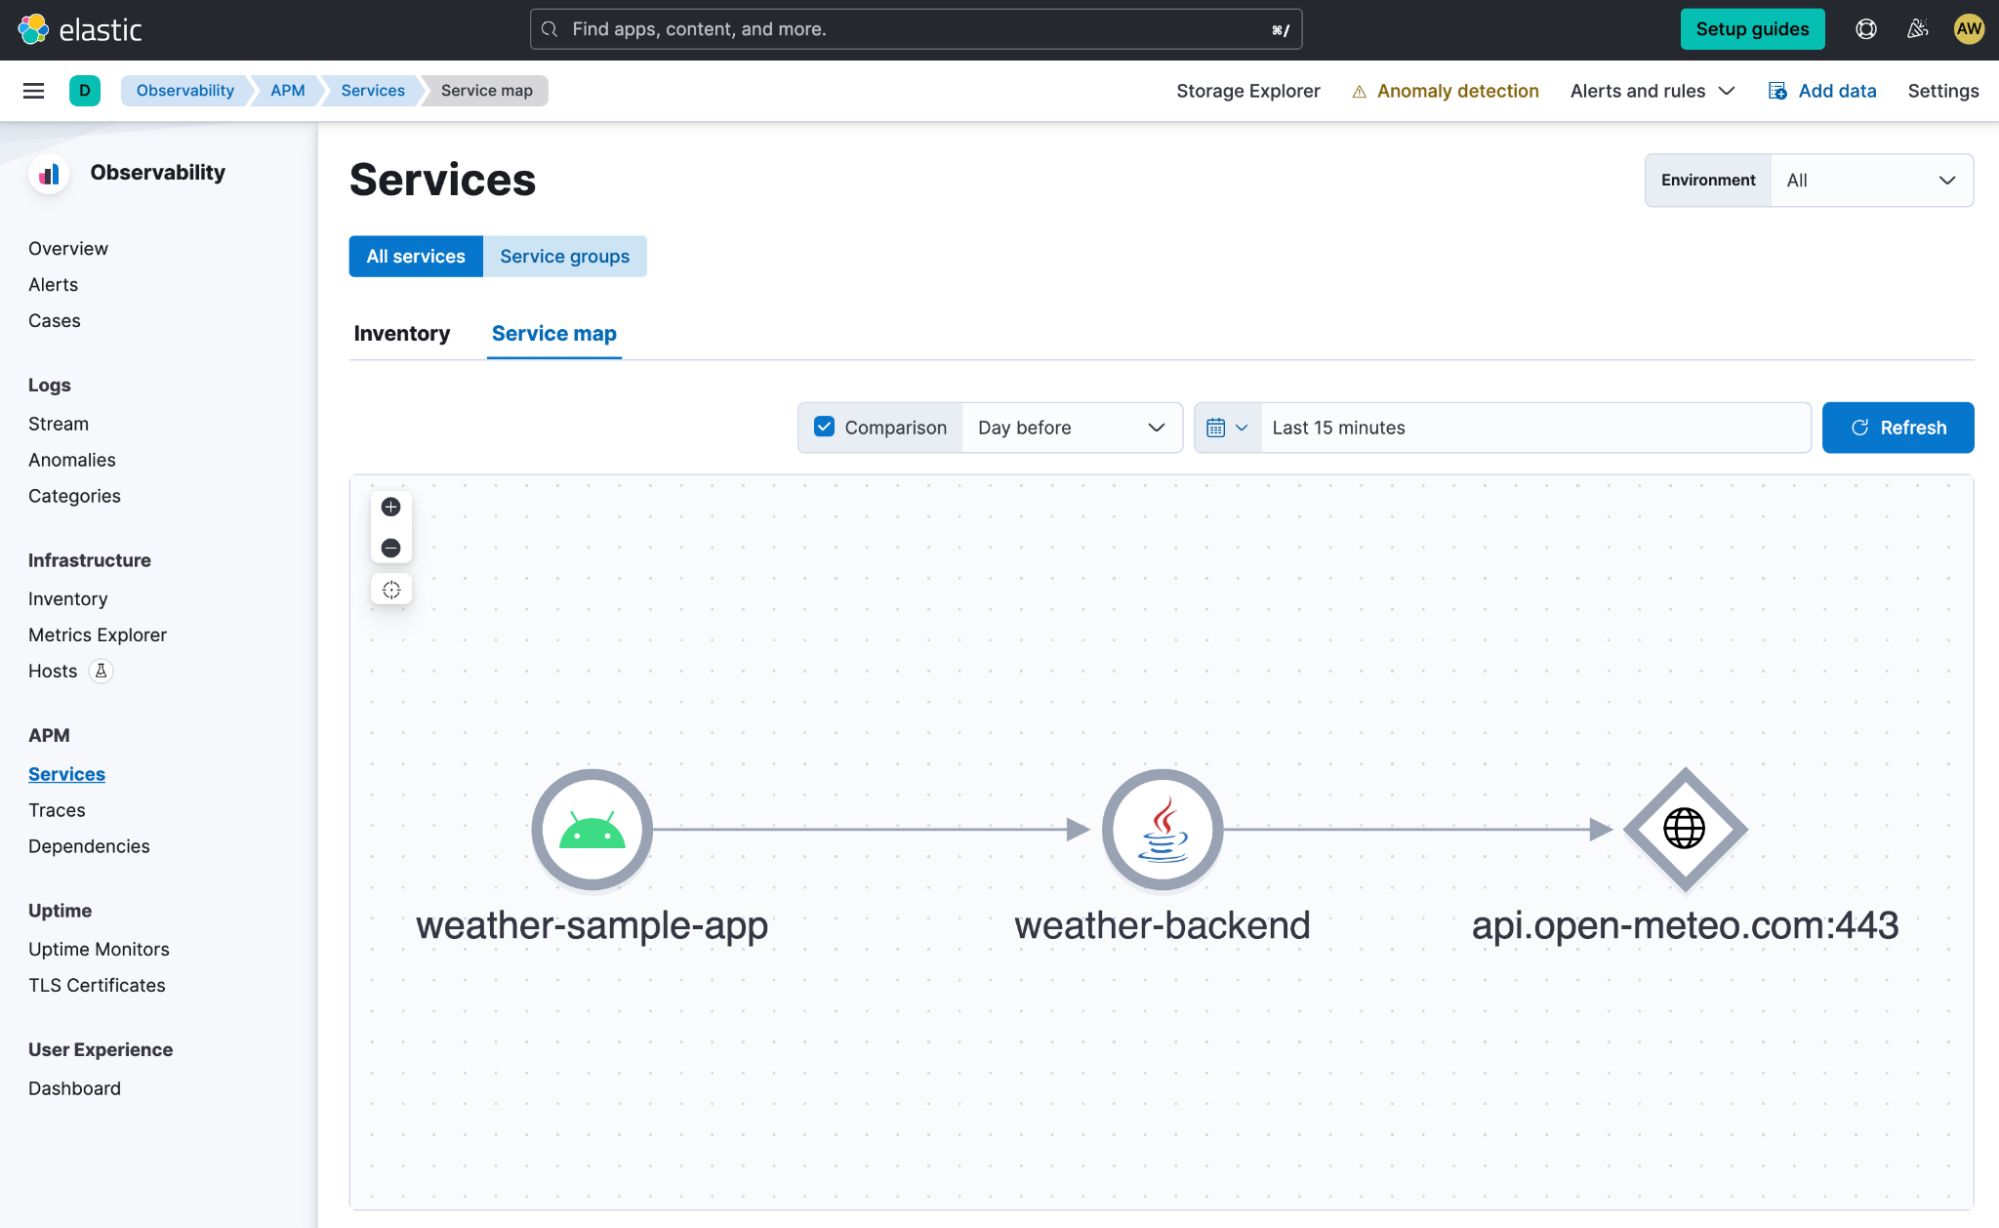
Our mobile APM agents currently support the auto-instrumentation of HTTP requests and screen rendering events, as well as the collection of tracing data, metrics, events, and logs. The setup guides for the Android and iOS APM agents describe the relatively simple onboarding process. Once instrumented, use the Service map feature to visualize the dependencies between a mobile frontend service and any backend services, as shown in this example below:
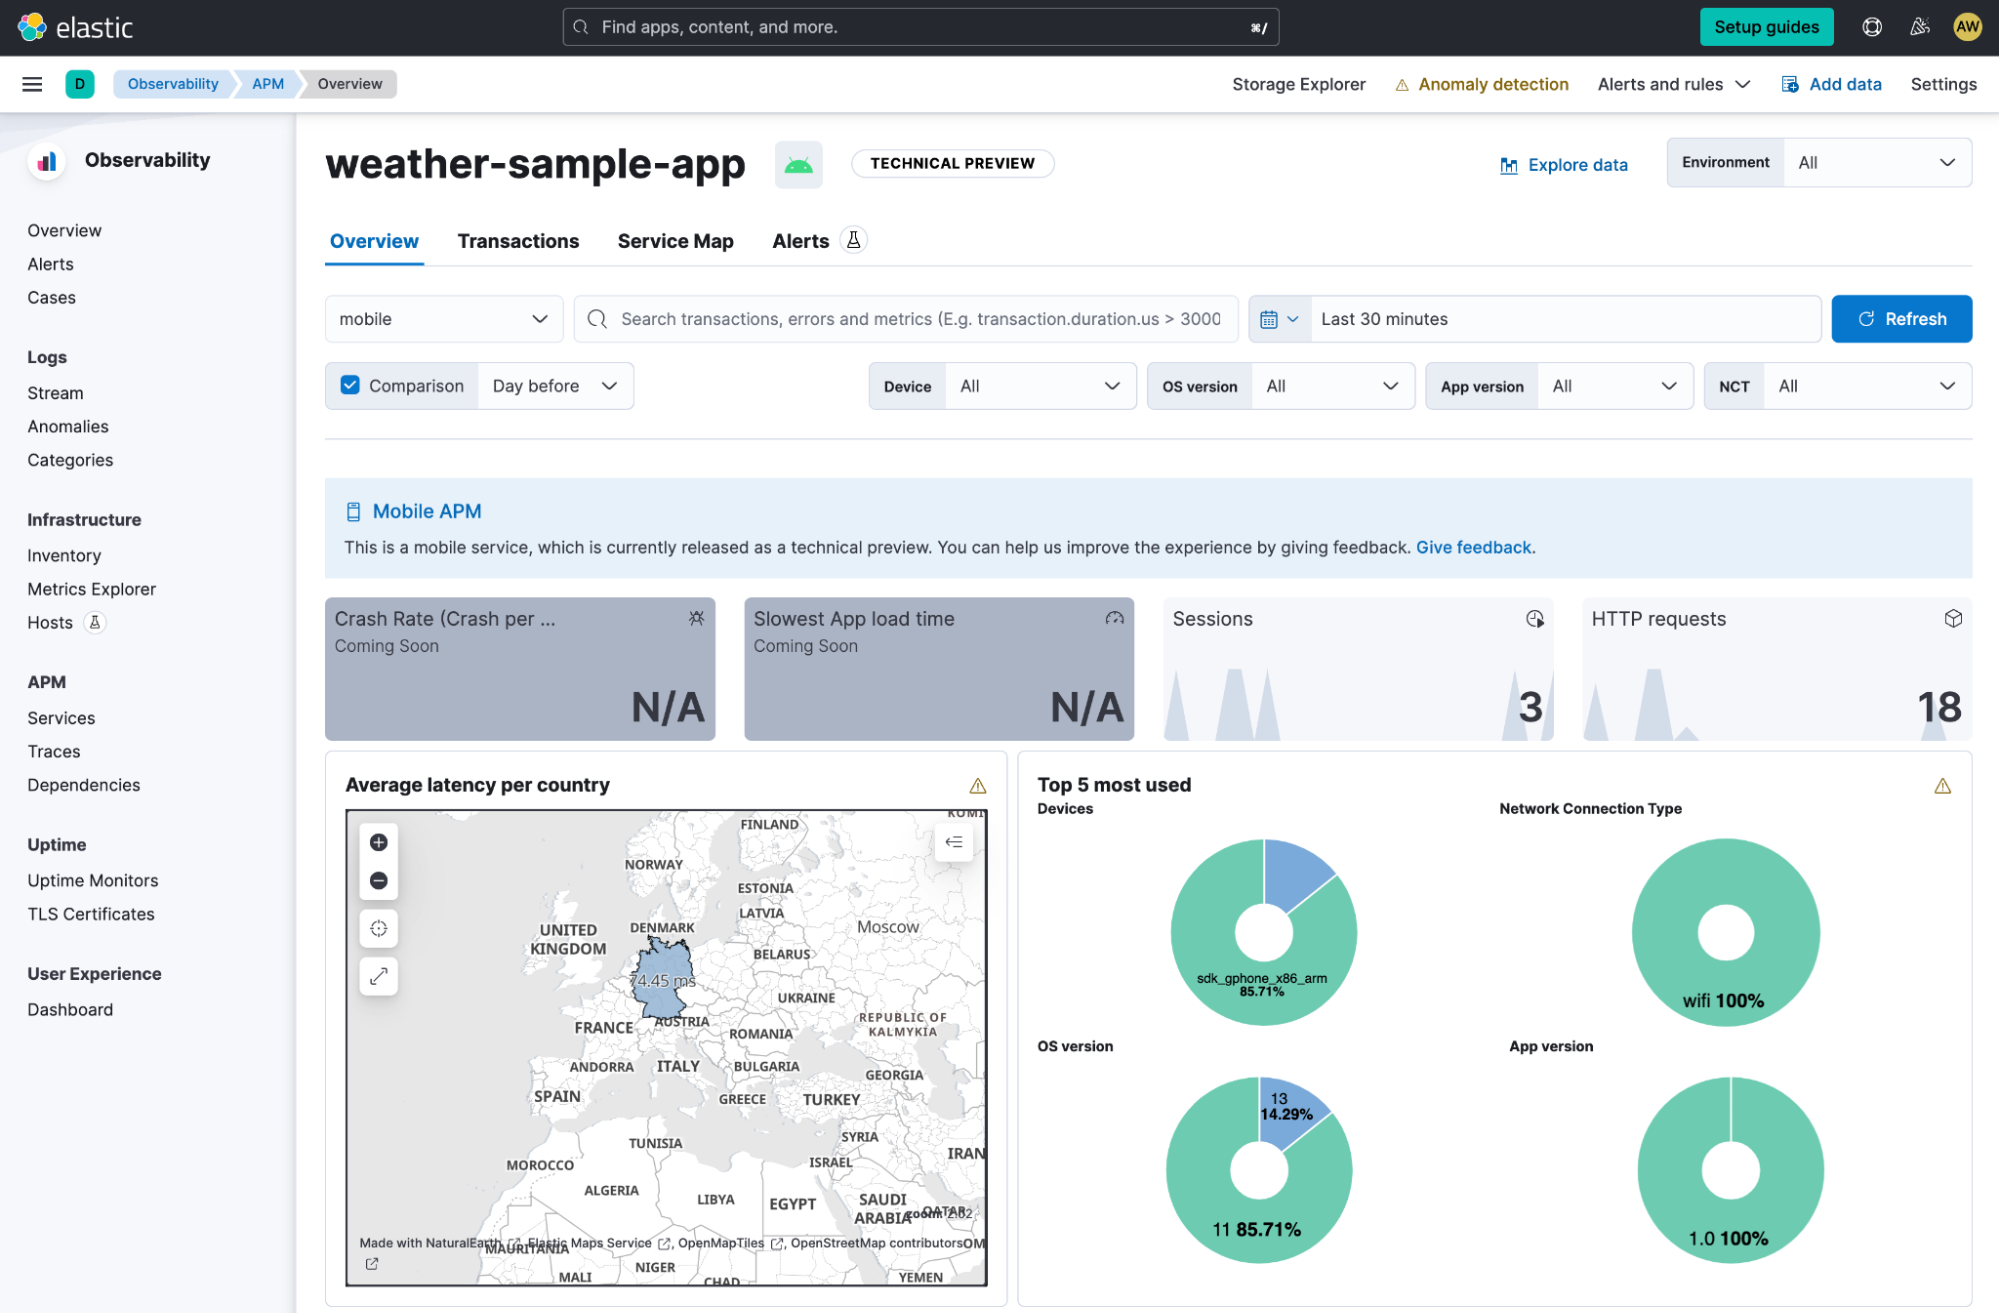
Curated dashboards for mobile APM have been enhanced by providing easy access to commonly used data filters, like device type, OS version, etc., and by introducing a map component to facilitate the analysis of KPIs by geolocation, as shown in the screenshot below:
This final example shows the trace waterfall view for a single transaction originating in the mobile frontend, its associated spans and errors, and its call to a backend service.
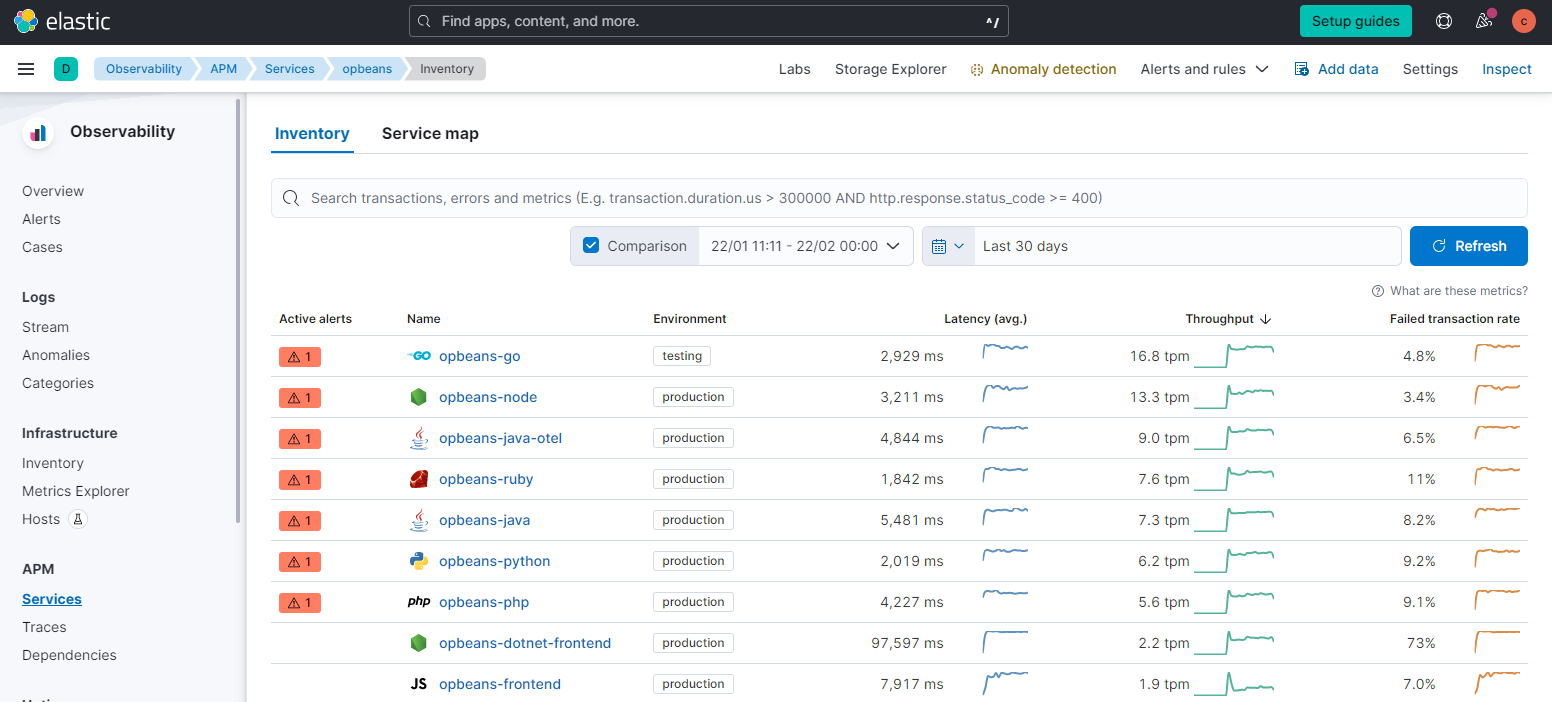
New Alert Workflow for APM Service Groups
editWe introduced APM Service Groups in Elastic Observability 8.2 as a Technical Preview. Since then, we have continued to make improvements, recently moving the feature to Beta in version 8.6. In Elastic Observability 8.7, we have added a new alert workflow to Service Groups, drawing attention to Service Groups and Services with active alerts. This new enhancement will provide actionable insights into the alert state of Groups and Services.
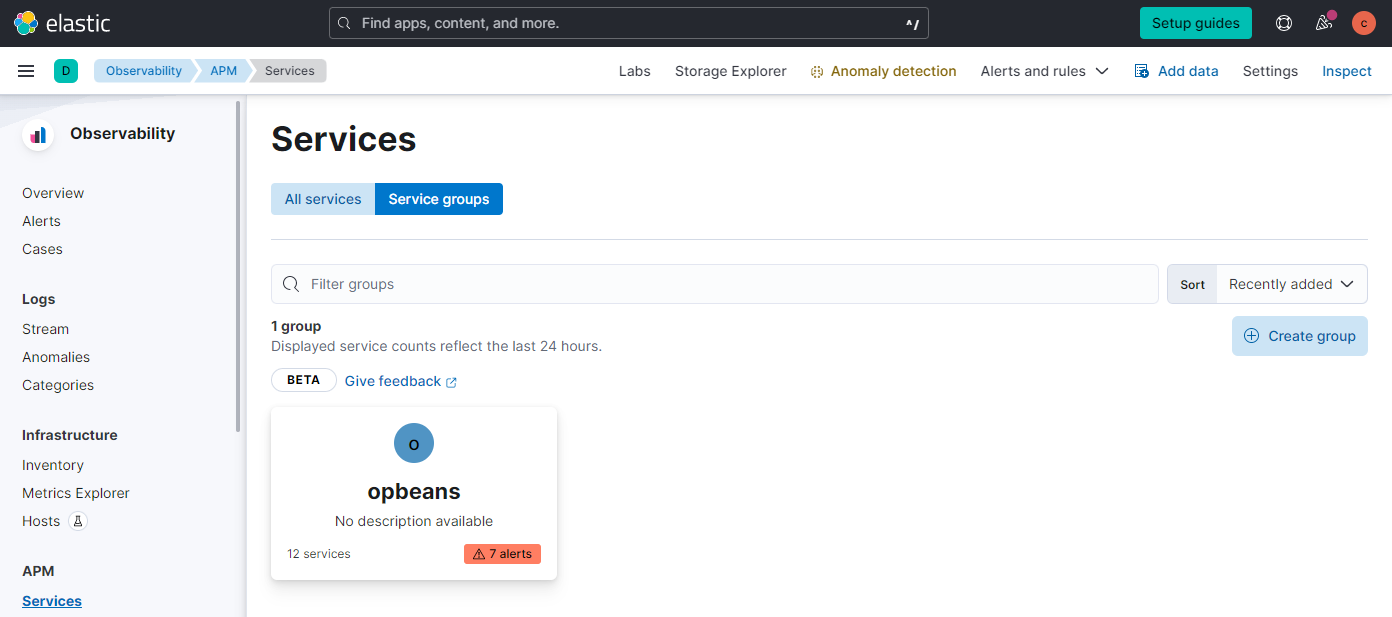
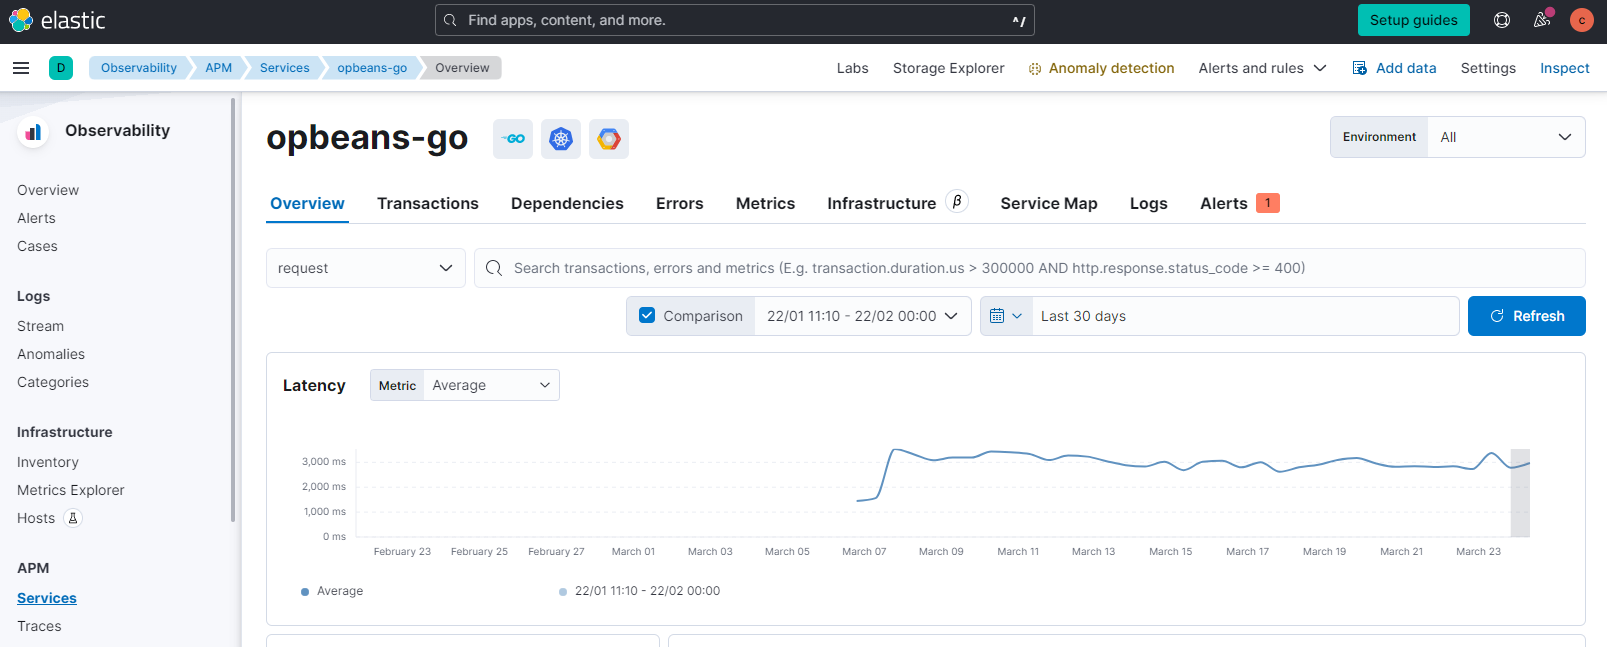
In addition to highlighting active Alerts at the Service Group level, we have added alert indicators to the Service Inventory and Service Overview as a guide to services that require action.