What’s new in 8.5
editWhat’s new in 8.5
editHere are the highlights of what’s new and improved in 8.5.
Other versions: 8.4 | 8.3 | 8.2 | 8.1 | 8.0 | 7.17 |
Perform annotations-based monitoring of Kubernetes workloads with standalone Elastic Agent
editIf you’re using Elastic Agent in standalone mode, you can now perform annotation or hints-based monitoring of Kubernetes workloads. This feature (already available for Beats users) is now available as a technical preview in 8.5 for Elastic Agent running in standalone mode.
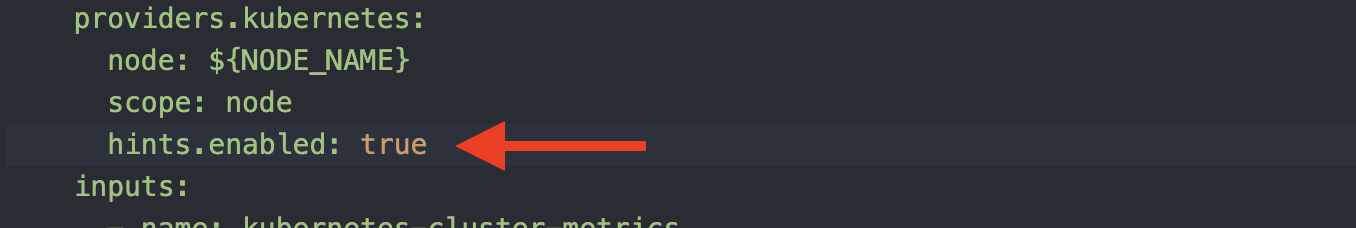
This feature enables Elastic operators to provide Kubernetes cluster users with a self-service monitoring configuration experience that is GitOps friendly. You can enable this feature in the Elastic Agent YAML file by uncommenting the init container as shown:
You can download Elastic Agent templates for
~60 supported packages,
and add or edit your own templates within /etc/elastic-agent/inputs.d.
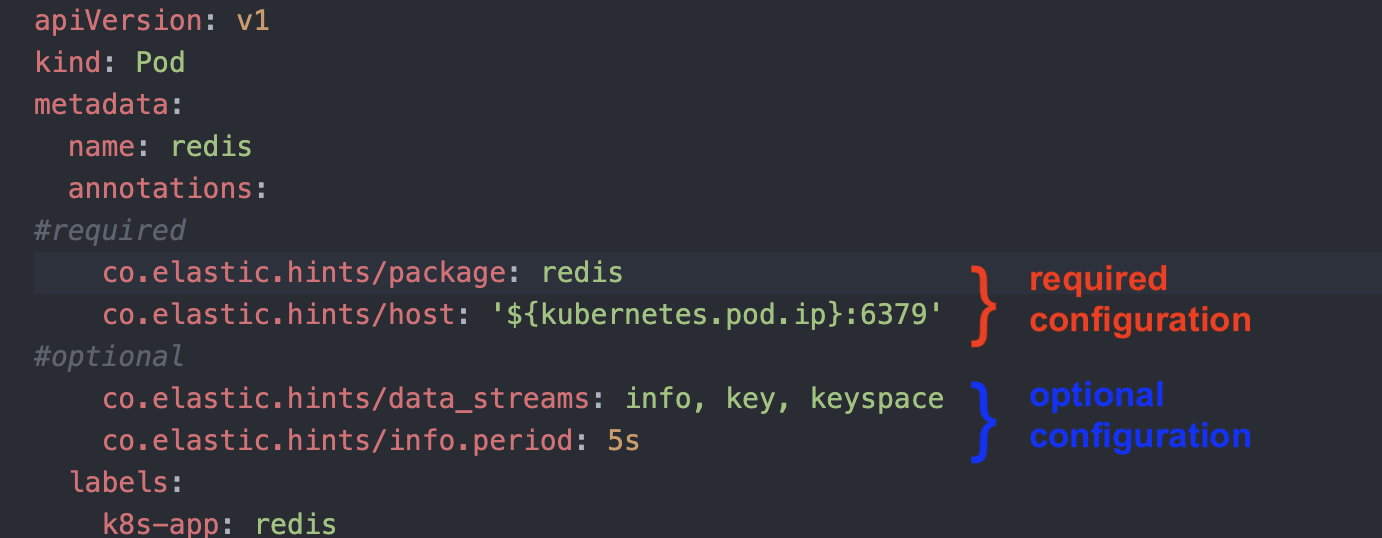
Cluster users responsible for defining a Pod manifest can add annotations that indicate that the Pod contains a specific package they would like to monitor. Even if cluster users do not have access to the namespace where Elastic Agent is deployed, they are able to choose and configure monitoring for a specific Pod. The following example configuration enables Elastic Agent to monitor the Pod using the configuration details for Redis without requiring further user action.
For more info, read the docs.
New Istio integration added
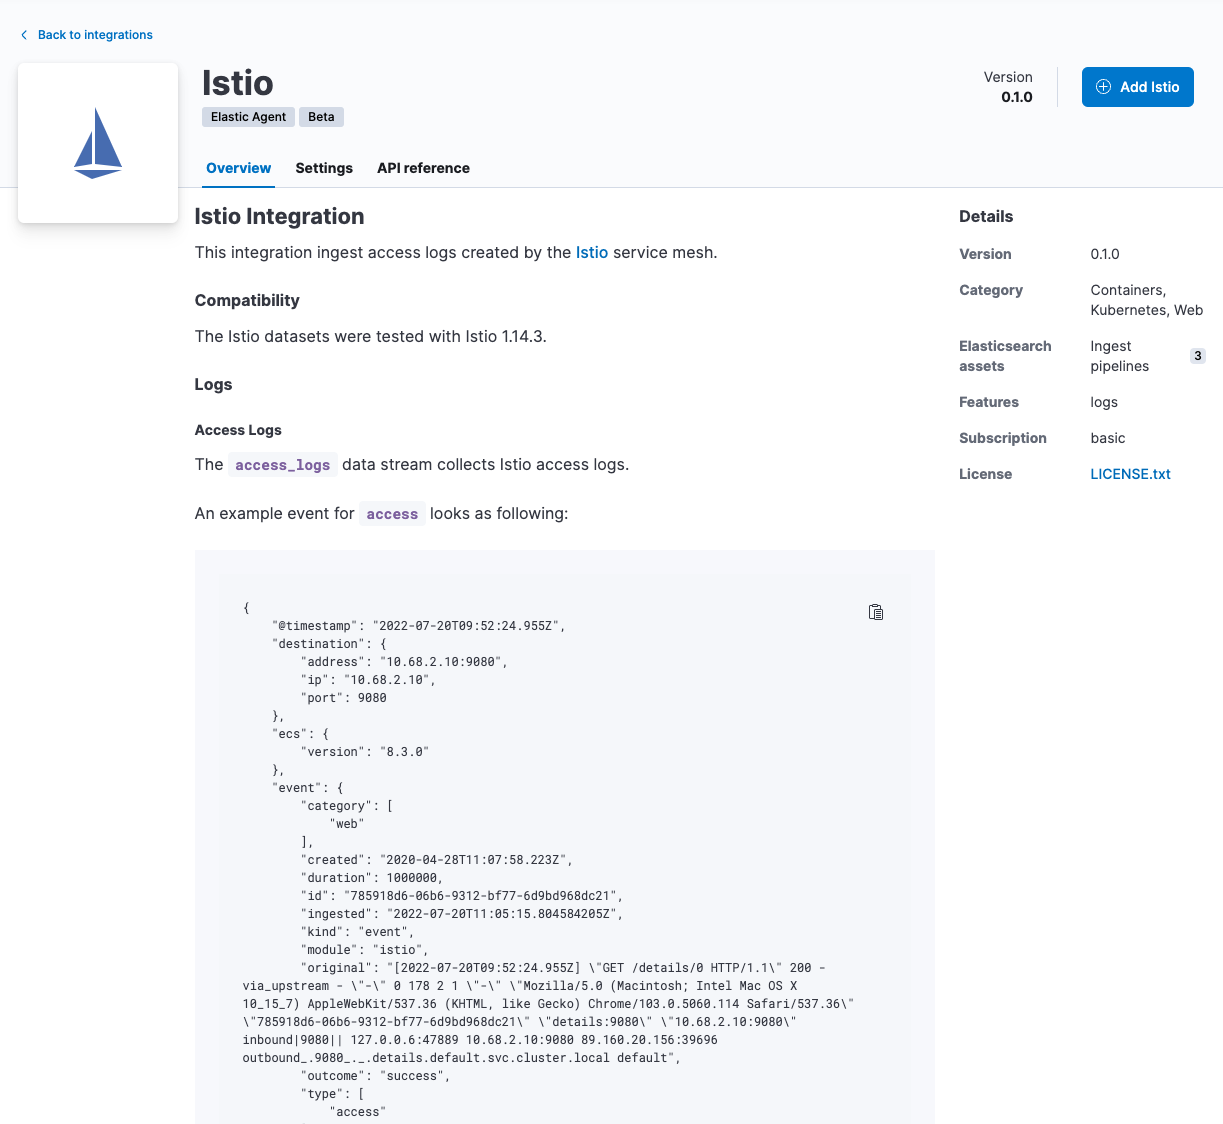
editWith a new Istio integration available in beta for version 8.5, you can collect logs from the Istio service mesh with Elastic Agent.
The Istio service mesh extends Kubernetes to establish a programmable application-aware network using the powerful Envoy service proxy. Working with both Kubernetes and traditional workloads, Istio brings universal traffic management, telemetry, and security, to complex deployments. Read the docs for more information, and look out for support for metrics coming in future releases.
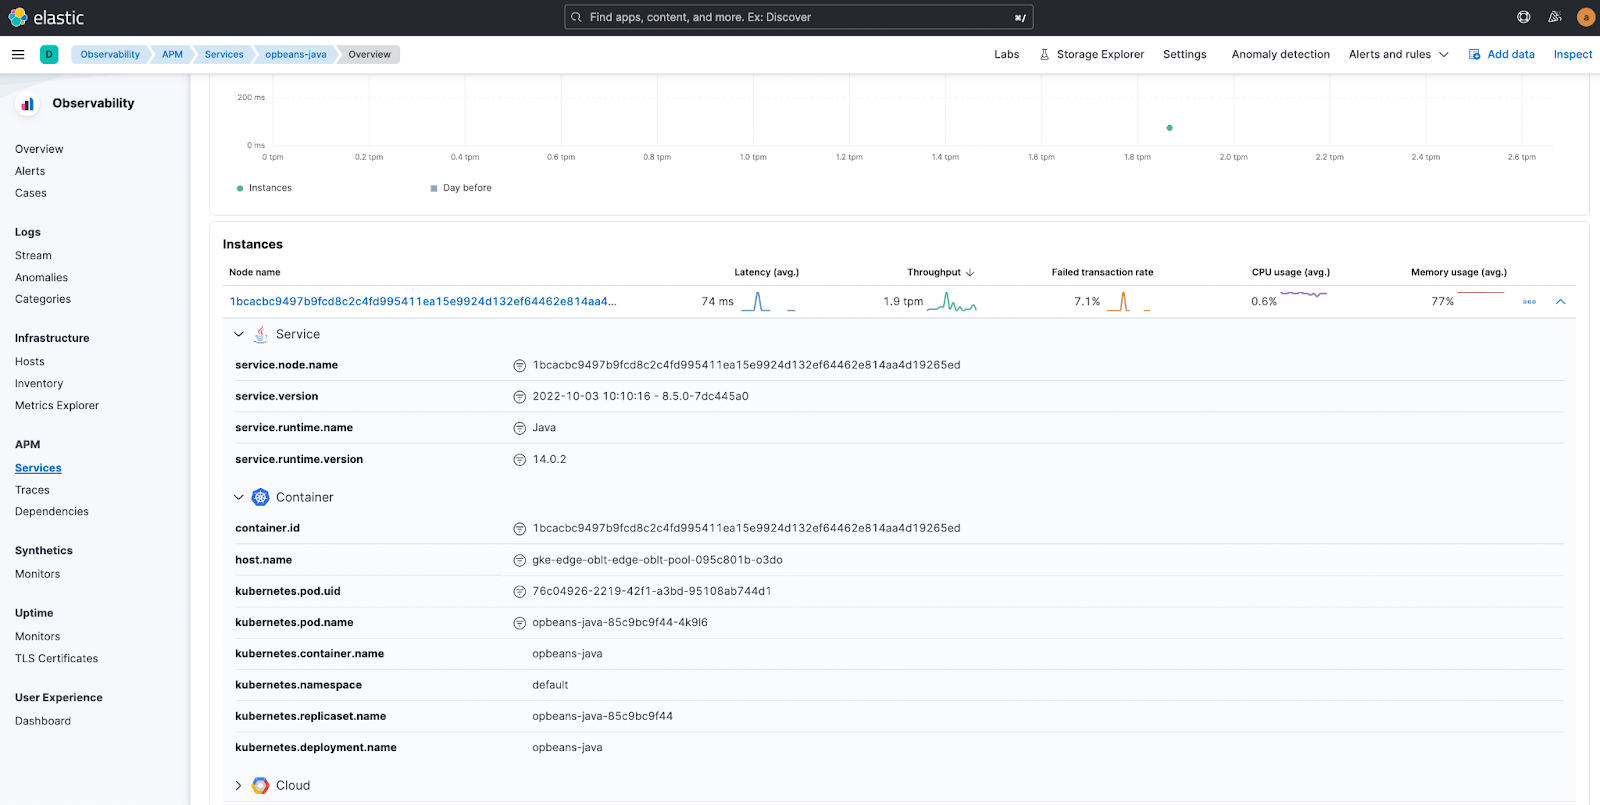
View contextual Kubernetes info from APM Service Overview
editYou can now view Kubernetes-related metadata in the context of a service. From the Service Overview page, click on the Kubernetes icon to the right of the service name to open a popup that contains Kubernetes details such as container images, deployments, namespaces, and replicasets.
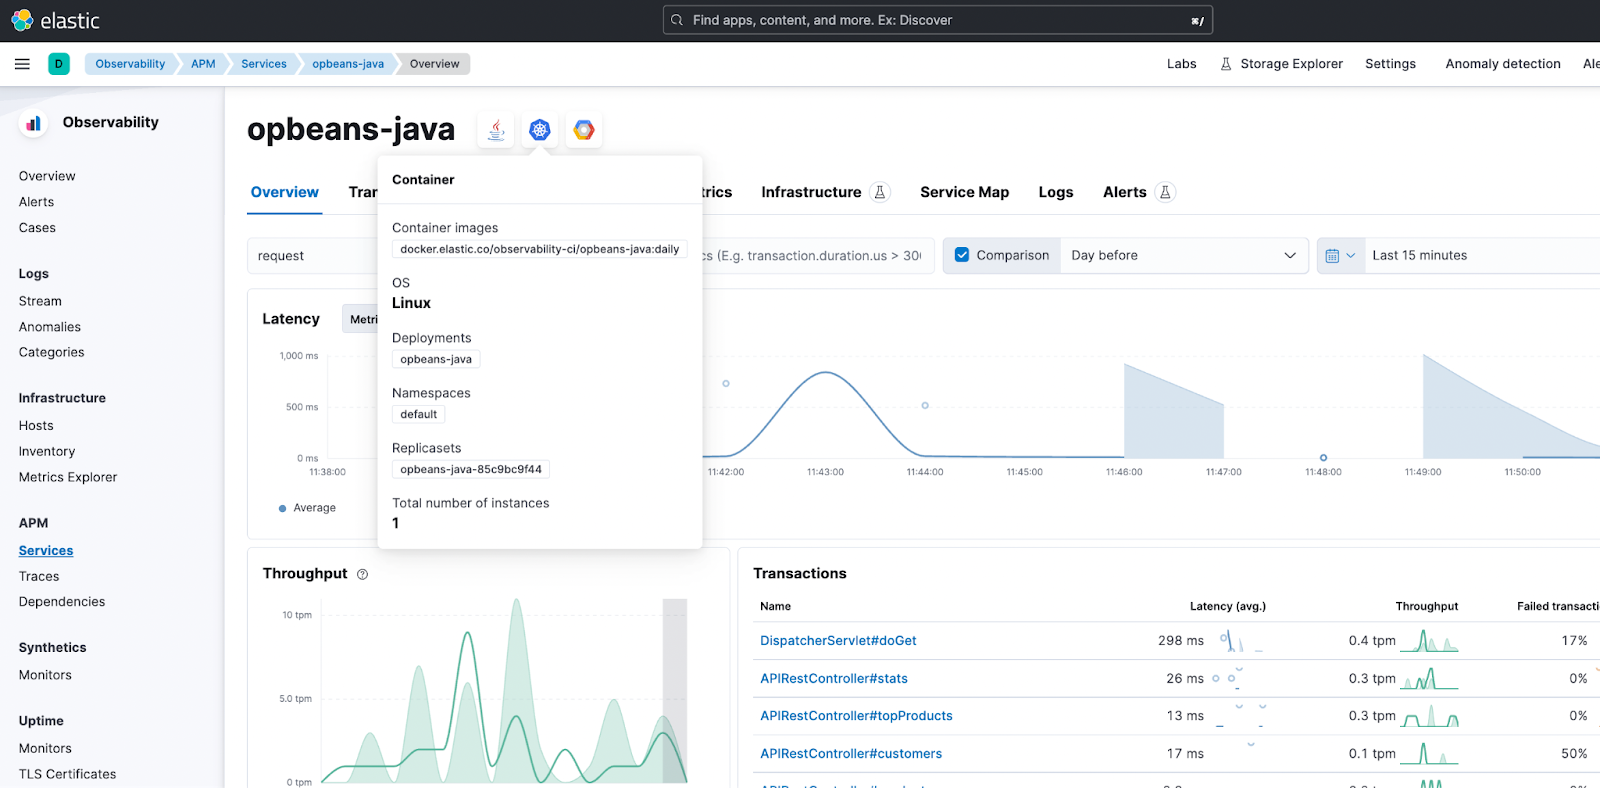
You can also view additional information in the Instance detail view at the bottom of the page.
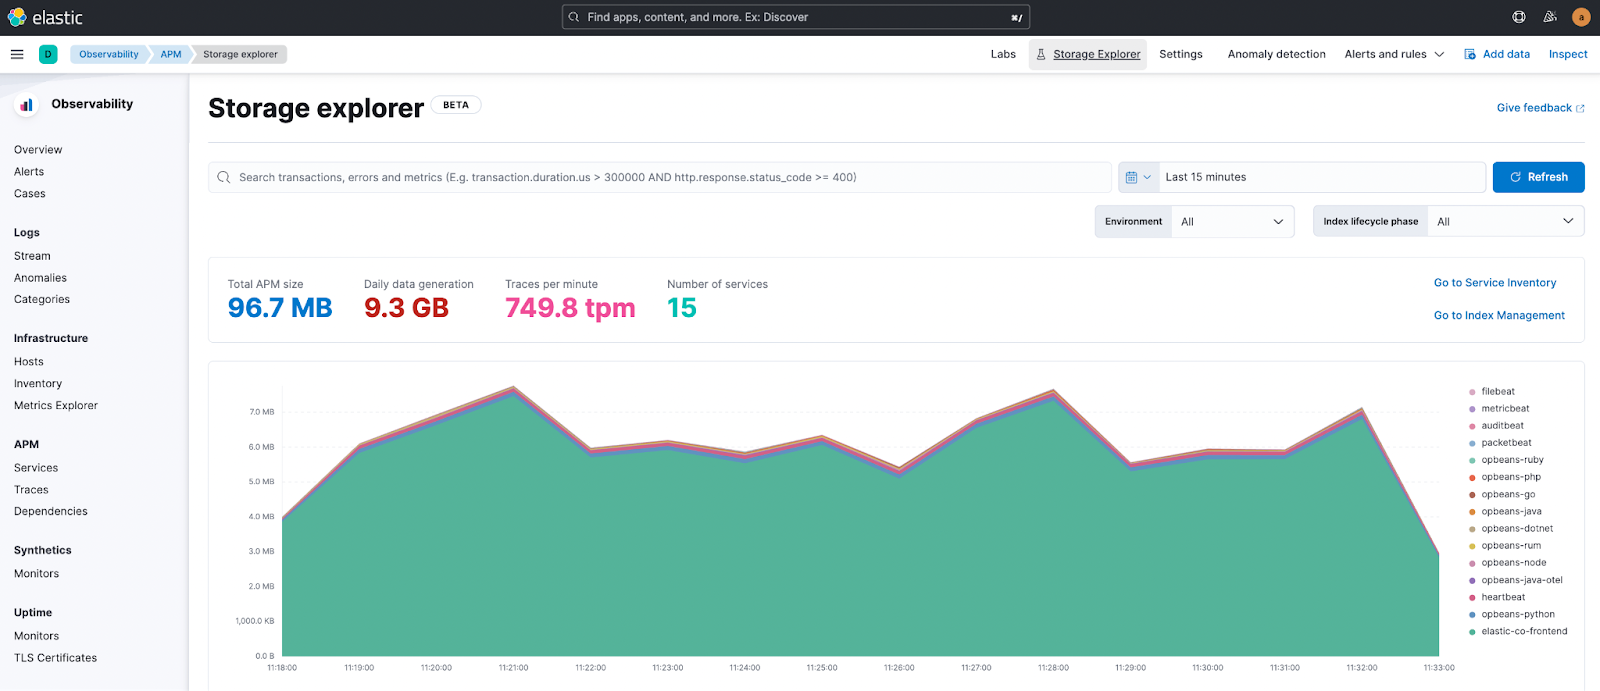
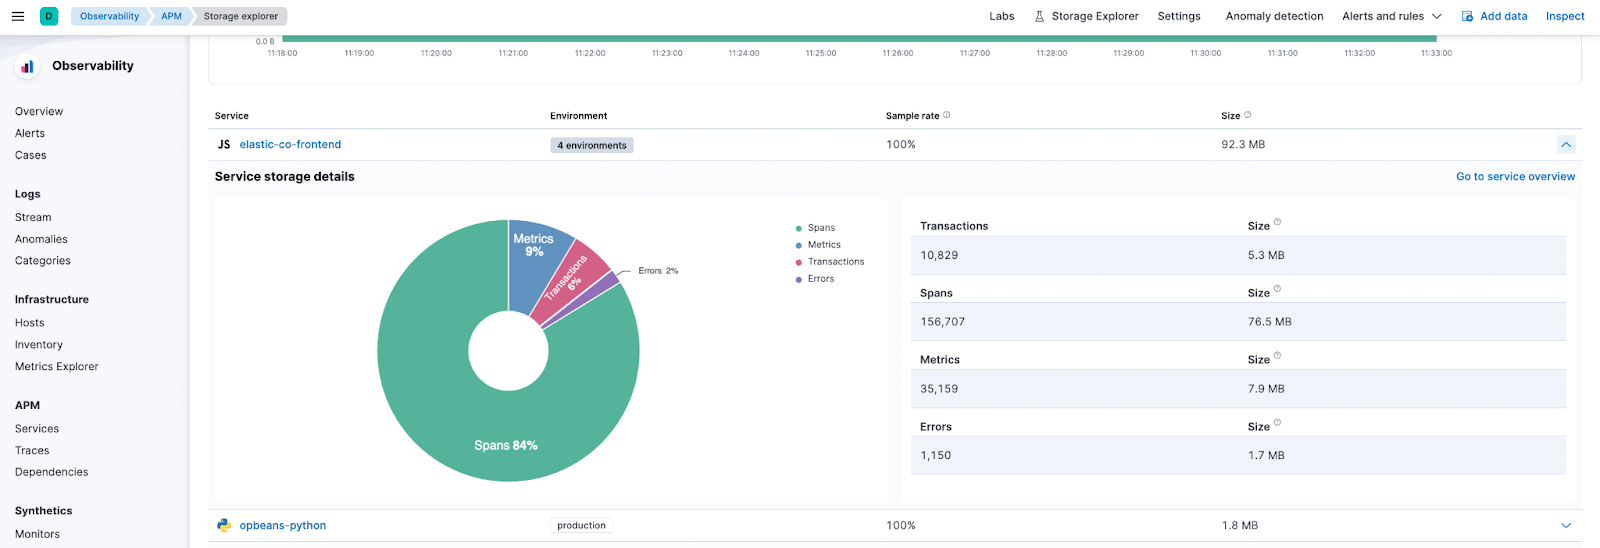
APM Storage Explorer available as beta
editWith Elastic Observability 8.5, APM Storage Explorer is now available as a beta feature. The storage explorer enables you to view the total and relative storage footprint of APM documents for each instrumented service. This provides visibility into the storage impact of configuration changes such as sampling rates, and will help you to improve storage requirement forecasts.
Auto-instrument APM .NET Agent profiler
editYou can now dynamically instrument existing .NET Framework, .NET Core, and .NET applications during startup and gain complete visibility in a matter of minutes. SREs and DevOps engineers are now able to instrument existing .NET applications in their environments, whether running in containers, IIS, or as Windows or Linux services, without needing to recompile any of the binaries.
In addition, the latest version of .NET agent extends distributed tracing support by providing auto-instrumentation for new libraries including Kafka, RabbitMQ, MySql, Oracle and PostgreSQL.
For more info, read the docs.