What’s new in 8.6
editWhat’s new in 8.6
editHere are the highlights of what’s new and improved in 8.6.
Other versions: 8.5 | 8.4 | 8.3 | 8.2 | 8.1 | 8.0 | 7.17 |
Get alerts with new Opsgenie integration
editWith an out-of-the-box Opsgenie integration now available in Elastic Observability 8.6, alerts generated in Elastic can be seamlessly sent to Opsgenie for efficient incident response and management. Upon alert recovery in Elastic, the corresponding alert in Opsgenie will be automatically closed, eliminating the need for manual alert closure and management.
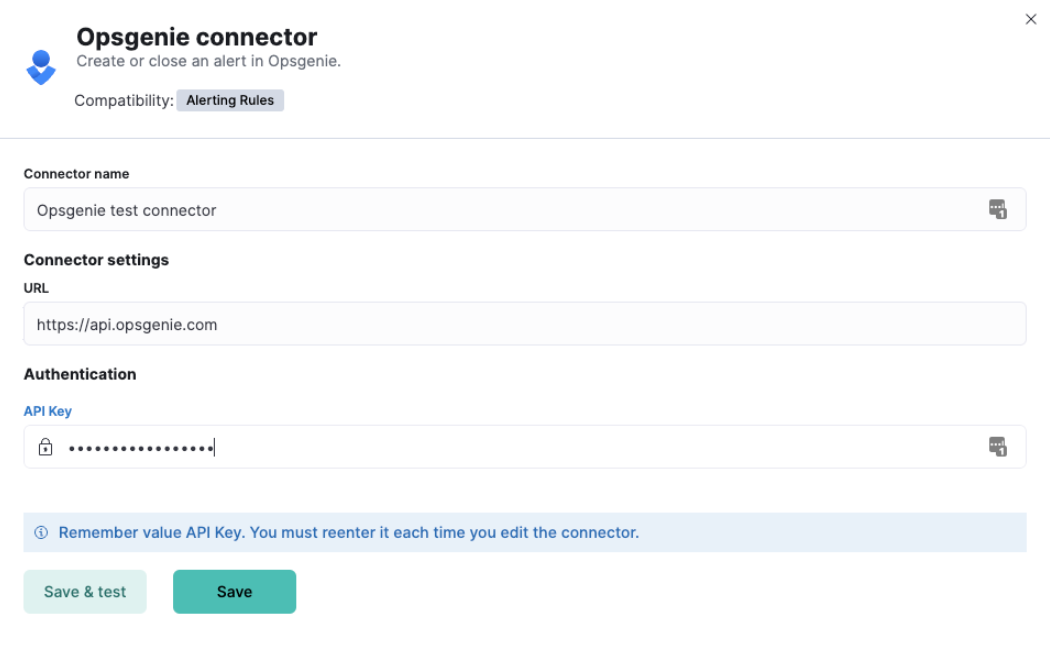
For more information, refer to the Opsgenie connector documentation.
New Operations view for APM Dependencies (Beta)
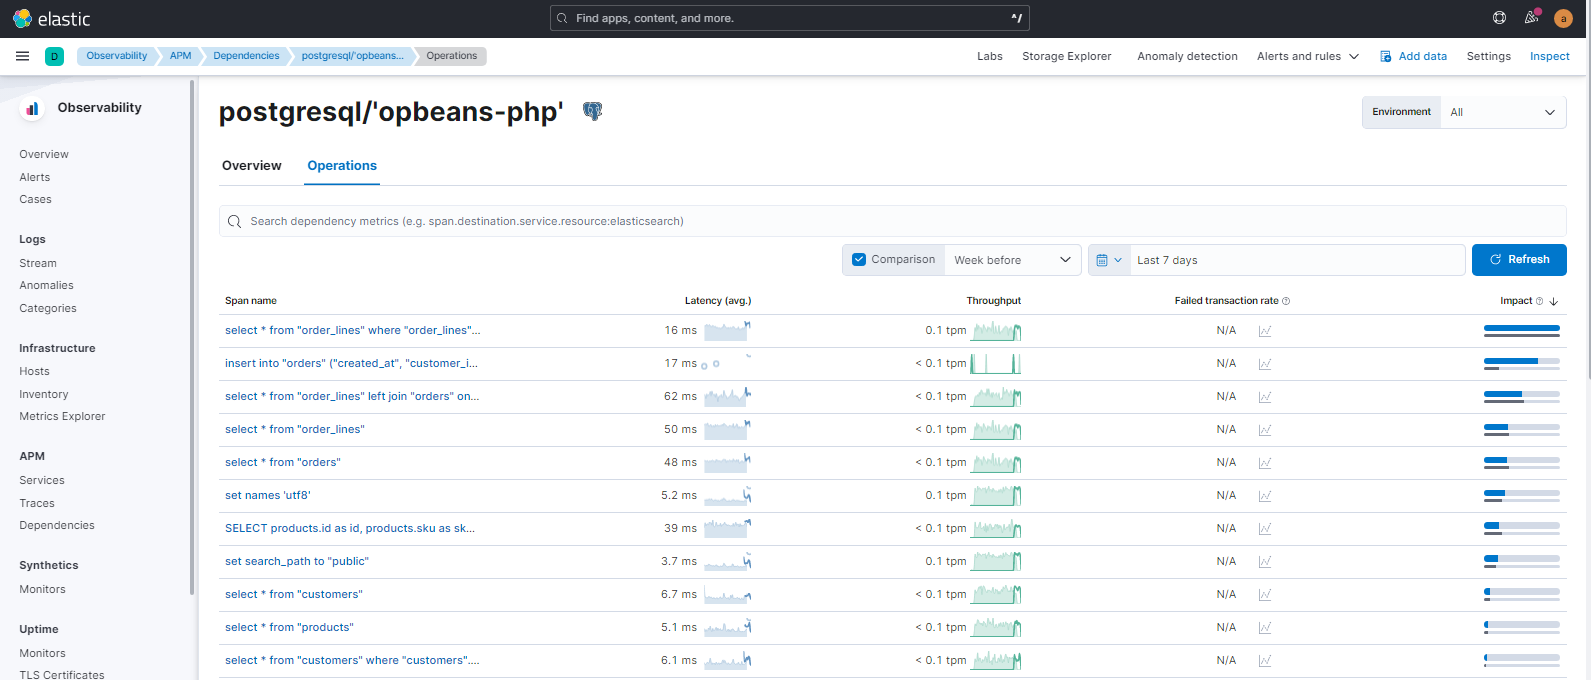
editElastic Observability 8.6 includes a new view that leads site reliability engineers (SREs) directly to problem areas with application dependencies. This drives faster root cause analysis by making it possible to easily access:
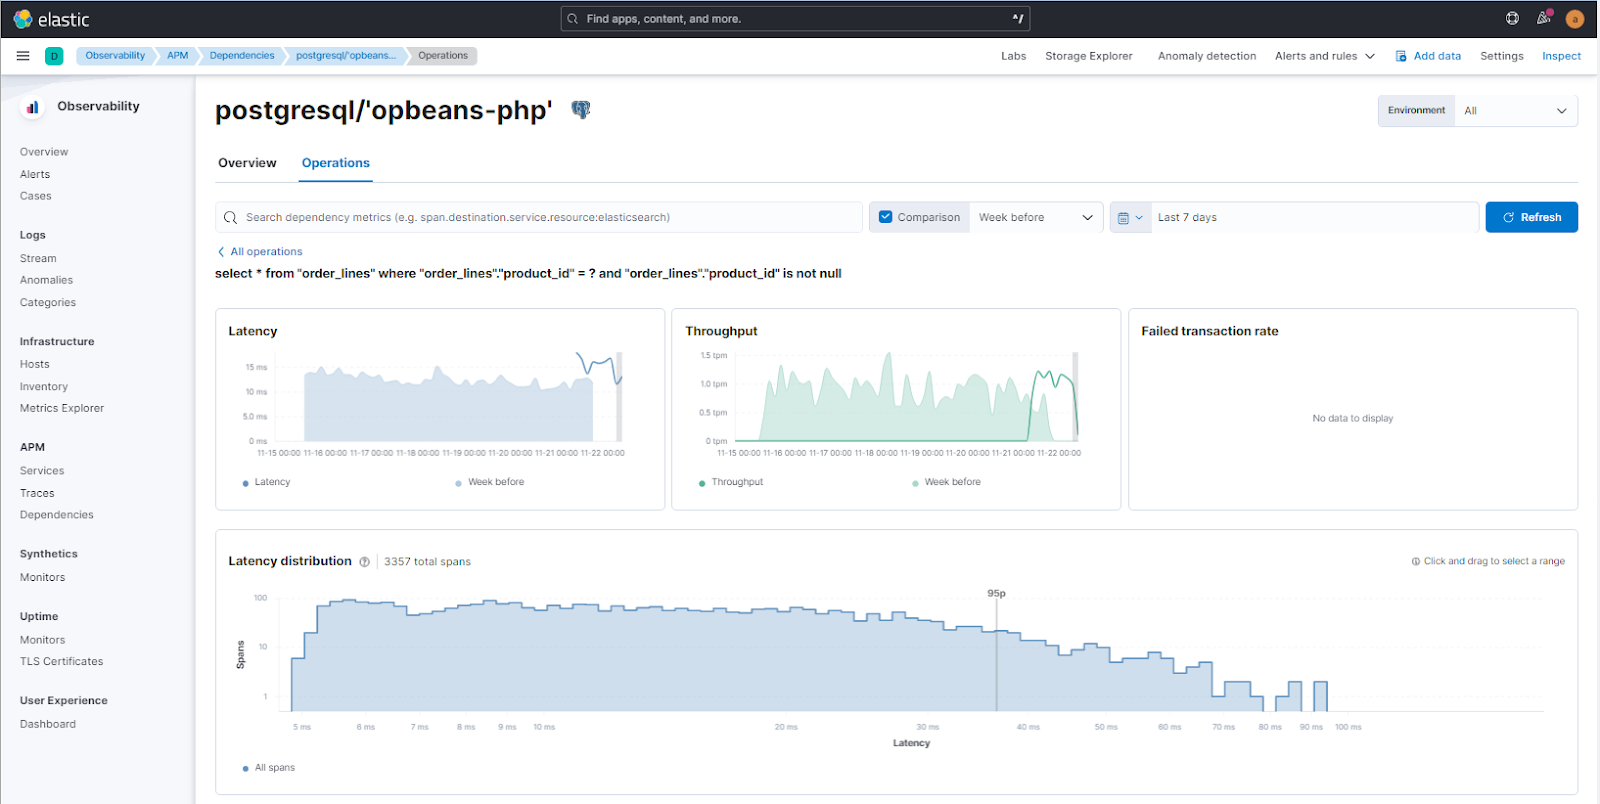
- All operations (spans) related to a particular instance of a dependency, including aggregate views for latency, throughput, failed transaction rate, and impact
- Interactive latency distribution graphs to isolate long running operations
- Trace waterfalls for individual instances of an operation to drill into the end-to-end experience of the entire related transaction
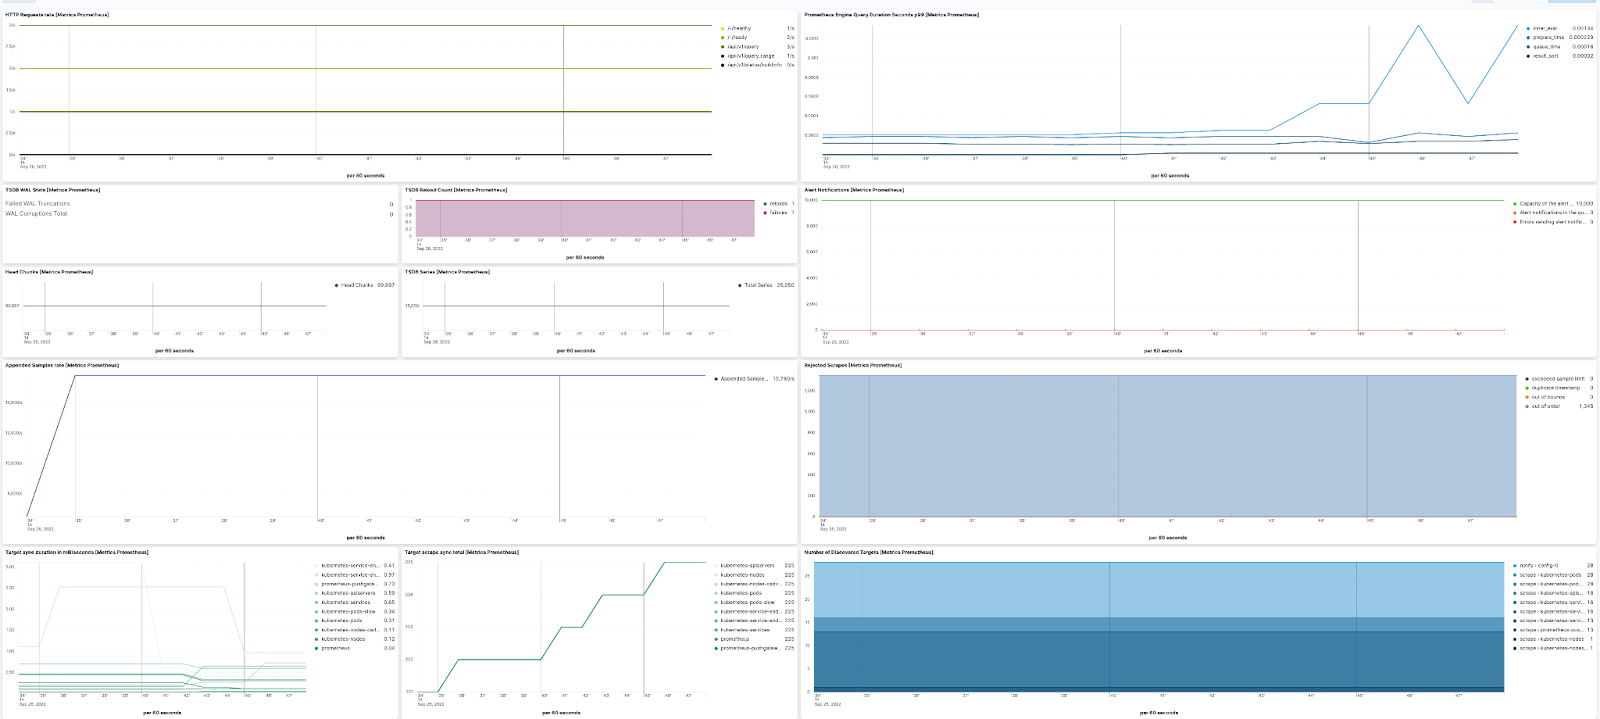
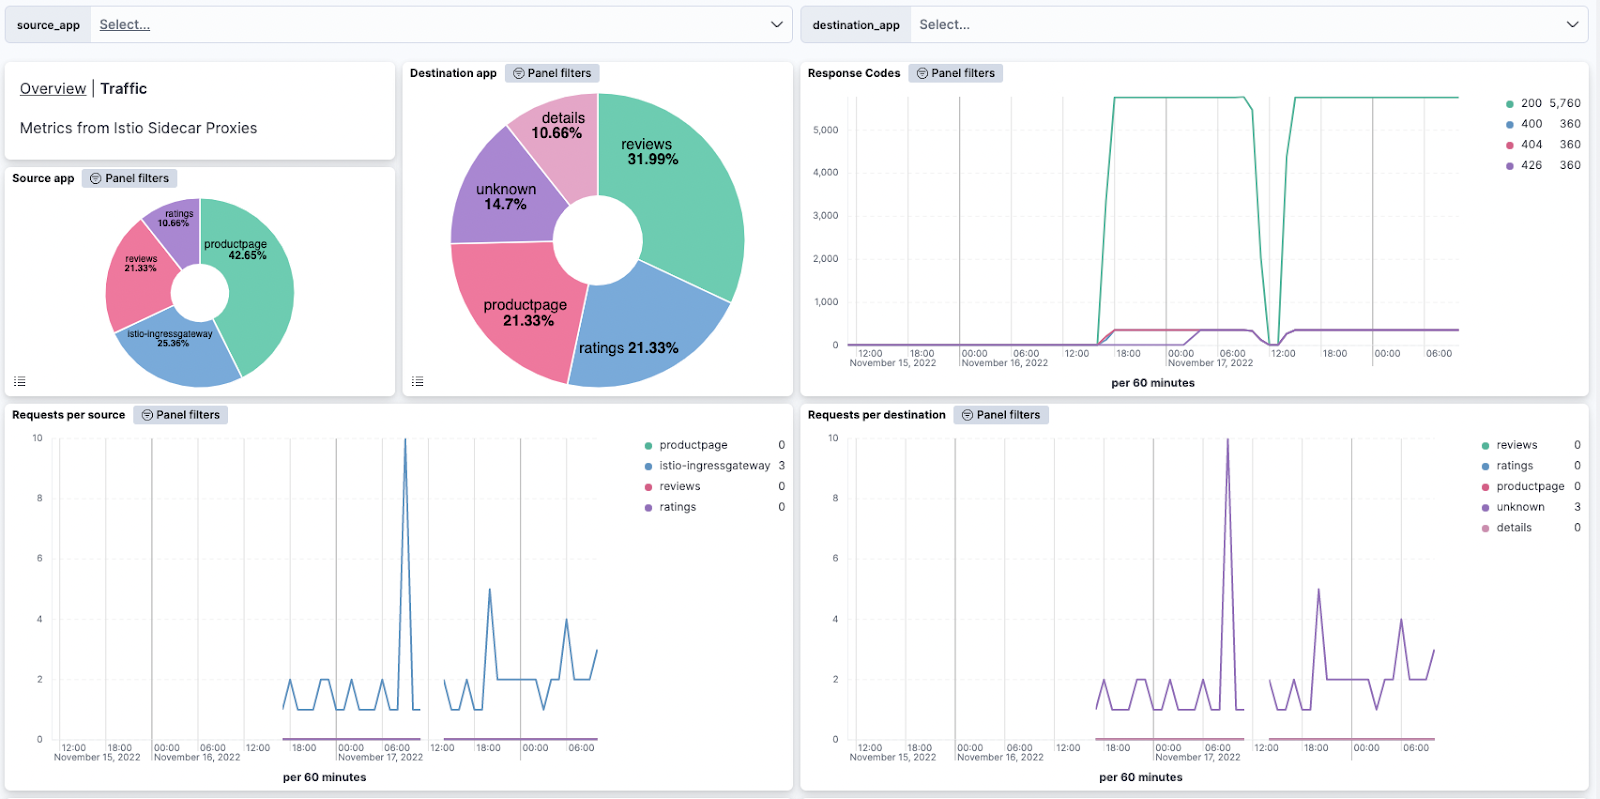
New Elastic Agent integrations for Prometheus and Istio
editWith new Elastic Agent integrations for Prometheus and Istio you can reap the benefits of using Elastic Agent (new indexing strategy, unified management with Fleet) and ingest data from one of the most popular cloud native projects and from the most popular service mesh. Add the integration to your deployment and start using out-of-the-box dashboards.
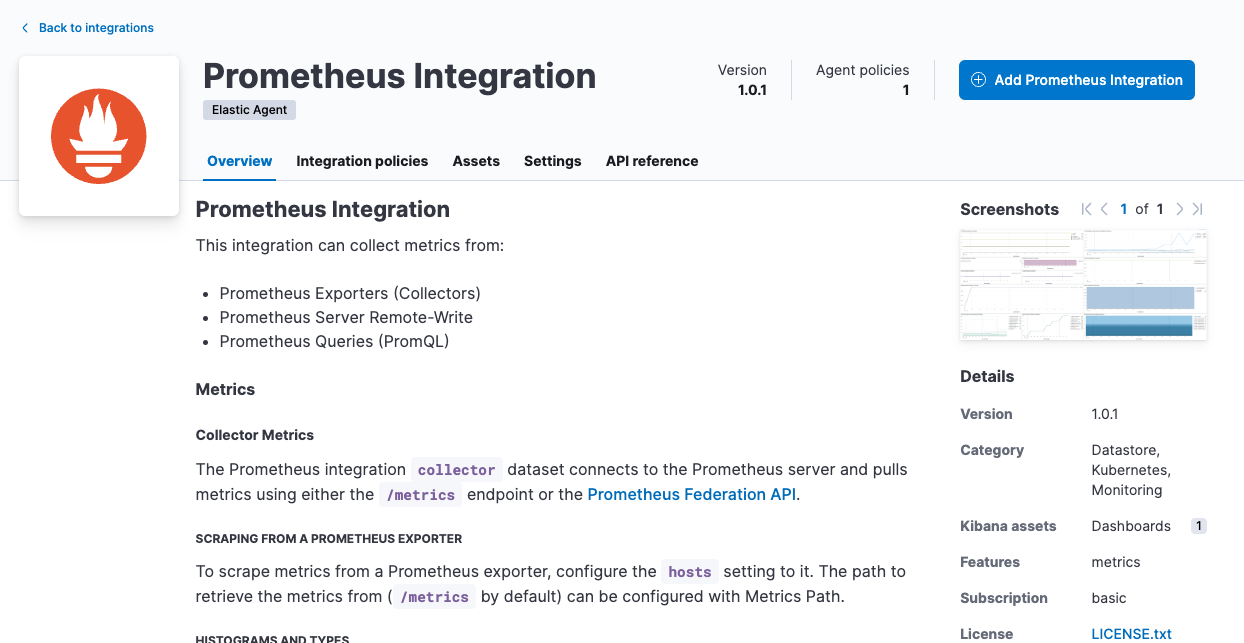
This integration can collect metrics from:
- Prometheus Exporters (Collectors)
- Prometheus Server Remote-Write
- Prometheus Queries (PromQL)
The Istio integration ingests access logs and metrics created by the Istio service mesh.
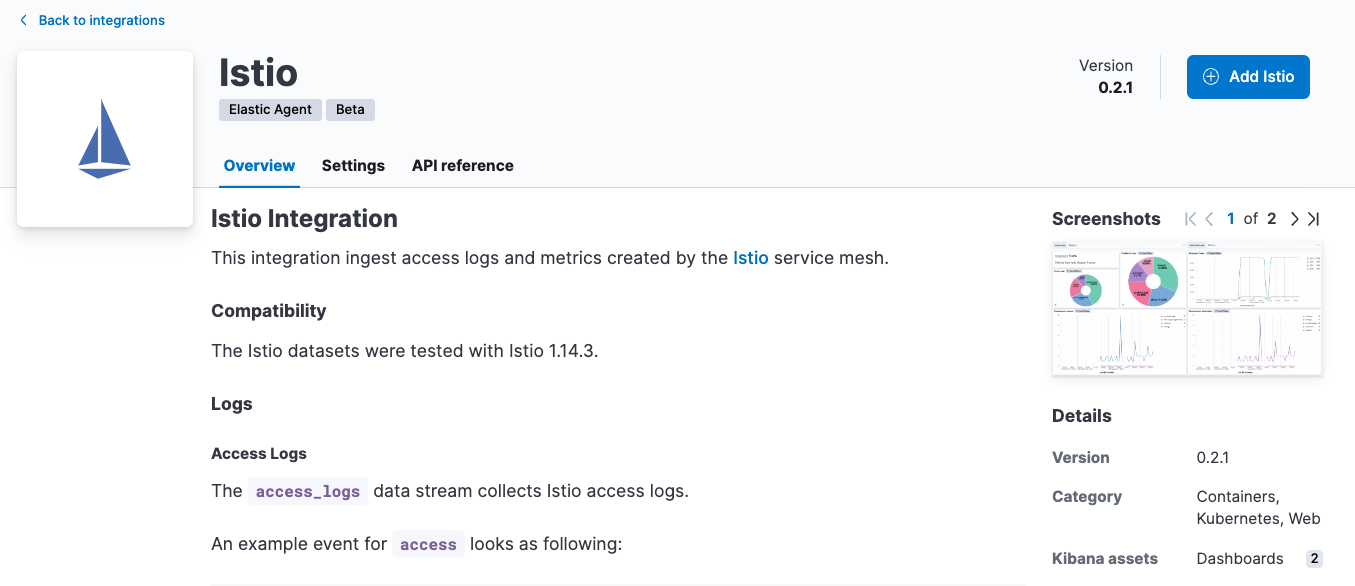
For more information, refer to the integration docs for Prometheus and Istio.
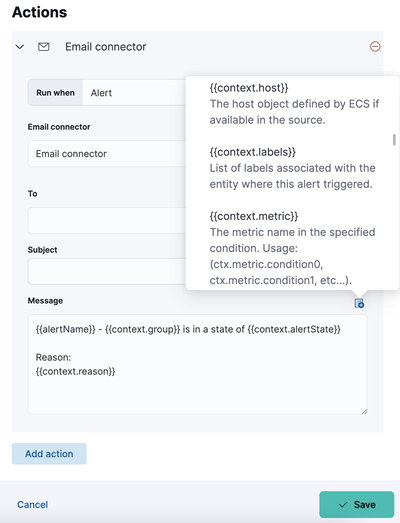
Improvements to rules and alerts
editRich contextual attributes are now available for inclusion in alert notifications for inventory and metric threshold rules. These are made available as Mustache variables that you can choose to include in notification templates when you define the rules. These attributes help you better understand where these alerts are occuring, and provide quick access to tags and labels for the source entities on which these alerts are triggered, allowing you to route the alerts to the right teams within your organization and enable the correct next steps in third party incident management systems.
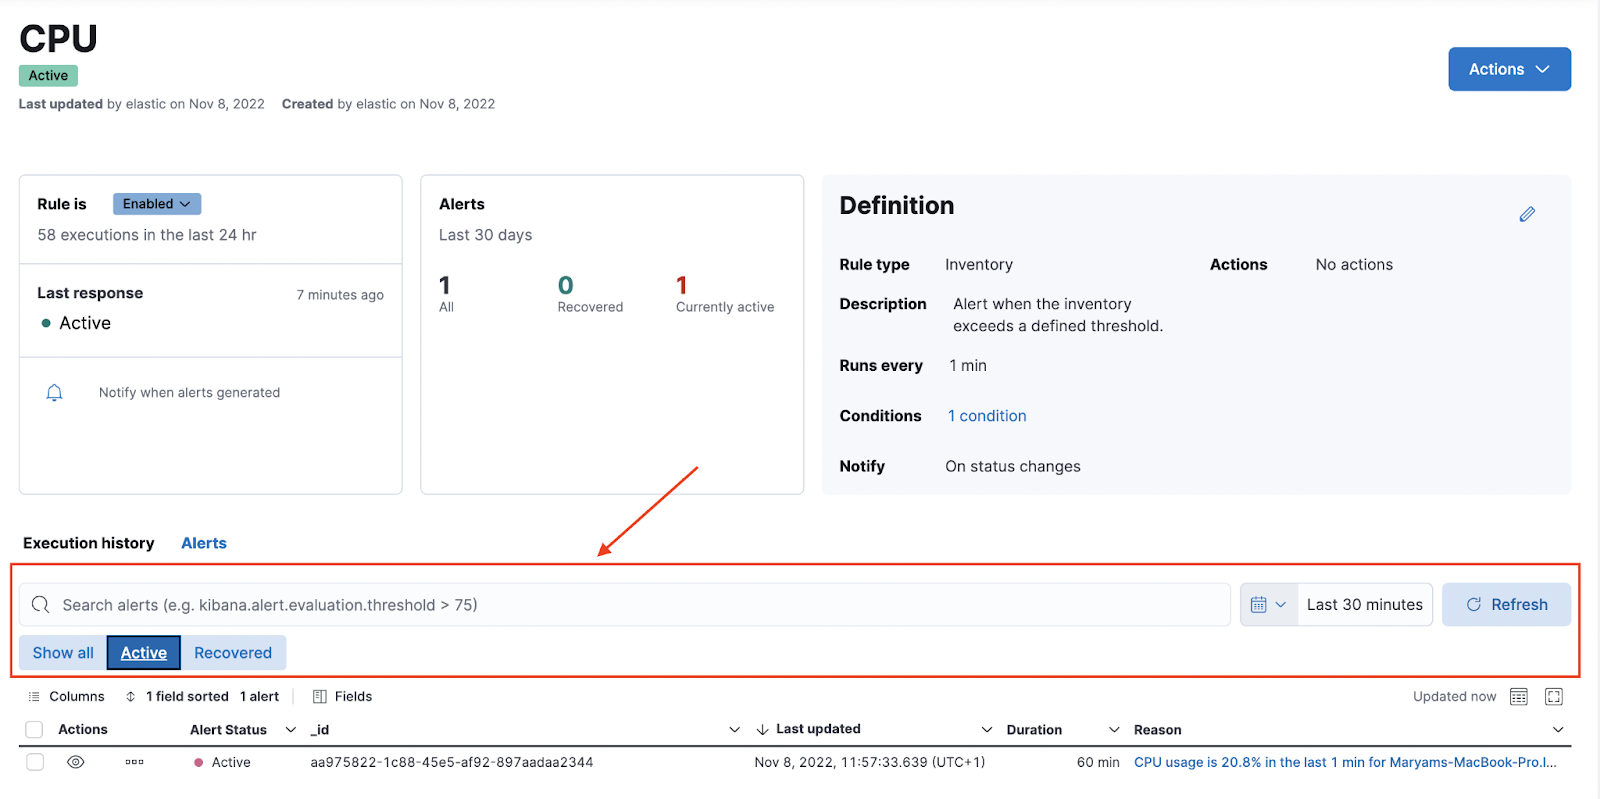
The new search bar in the Alerts application enables you to zoom into alerts generated by a rule, and helps you understand alert volumes and make quick changes.
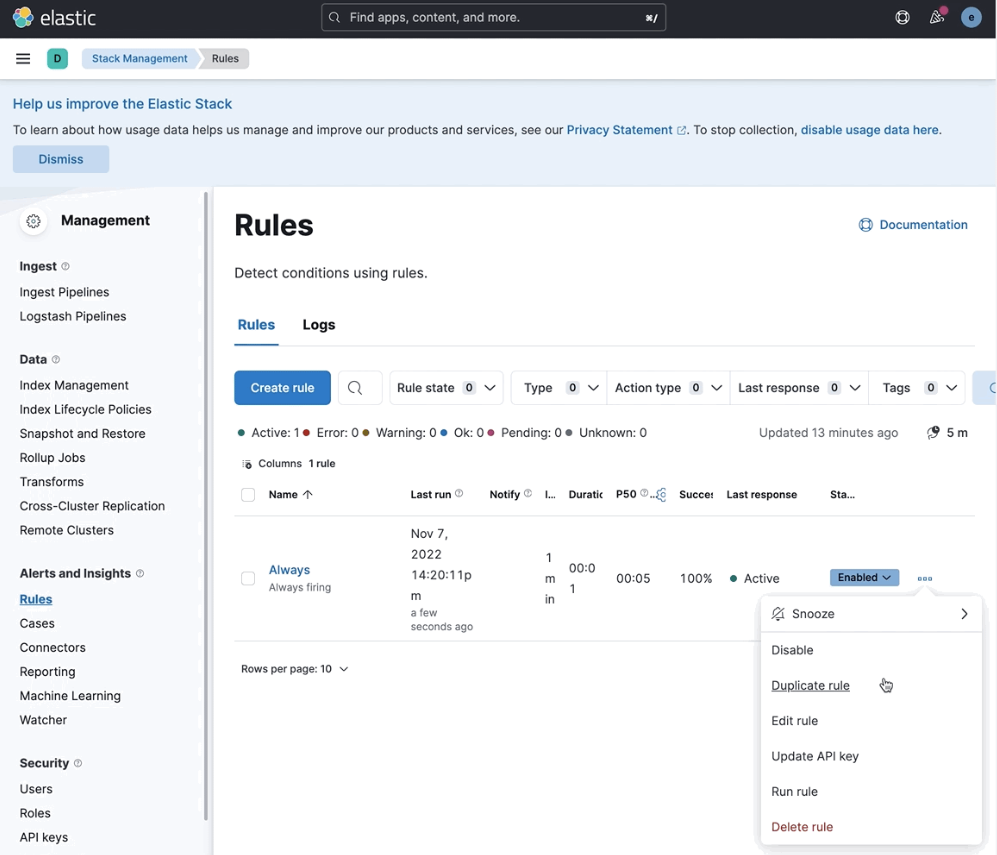
You can now also clone rules by using the Duplicate rule feature and then editing the definition.
New integrations for Citrix ADC and Jolokia
editFormerly known as NetScaler, ADC is an application delivery and load balancing solution for monolithic and microservice-based applications. This new Elastic Agent integration is available in Beta and enables you to:
- Monitor Citrix ADC instances, and visualize and correlate the metrics with other applications and services in the topology
- Measure and optimize the load, request/response trends and key data, and derive business insights
- Create alerts to reduce the MTTD and MTTR
Out-of-the-box dashboards are provided with the integration - please refer to Citrix ADC docs for more information.
In addition, as a technical preview, we have released an input package for Jolokia that enables you to collect metrics from Jolokia agents running on a target JMX server or dedicated proxy server.
For more information, please refer to Jolokia integration docs.