What’s new in 8.10
editWhat’s new in 8.10
editHere are the highlights of what’s new and improved in 8.10.
Other versions: 8.9 | 8.8 | 8.7 | 8.6 | 8.5 | 8.4 | 8.3 | 8.2 | 8.1 | 8.0 | 7.17
Conditional actions in alerting rules
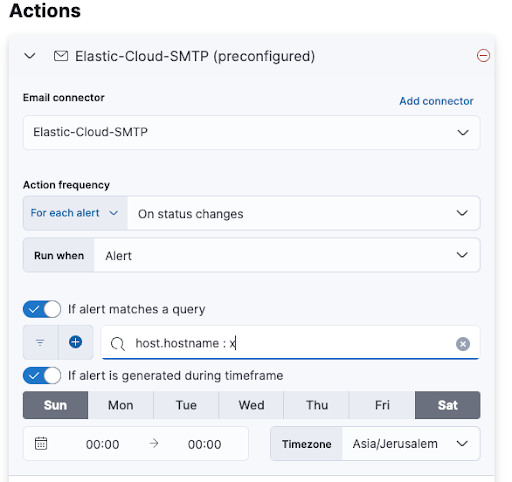
editWhen creating an Observability alerting rule, you define conditions that must be met for an alert to occur. Now you can also add conditions that affect the actions associated with an alert. For example, you might choose to send notifications only if the alert is received between defined hours.
See Host Details at Glance
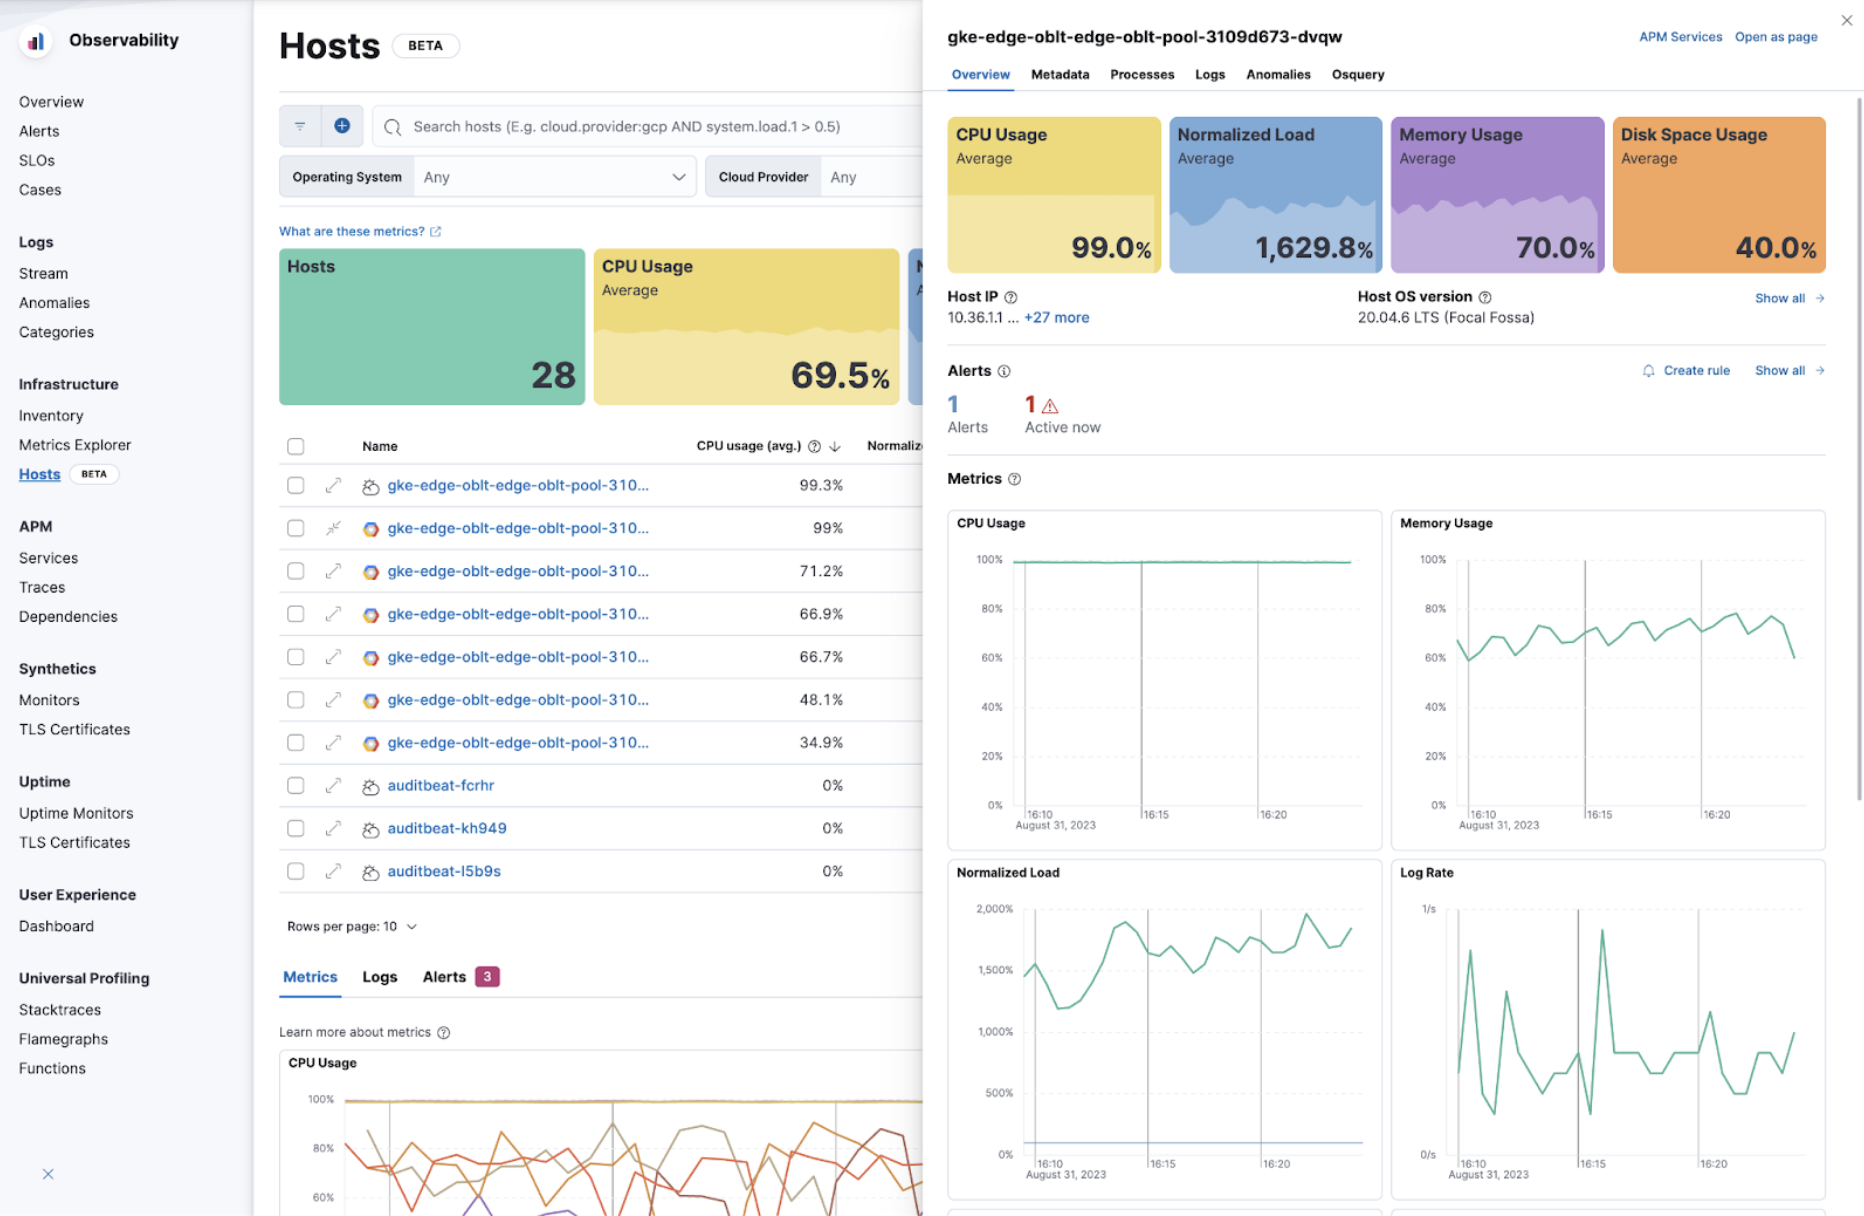
editAs part of our new [beta] This functionality is in beta and is subject to change. The design and code is less mature than official GA features and is being provided as-is with no warranties. Beta features are not subject to the support SLA of official GA features. Hosts experience, we have added a new overview tab in the host flyout so you can quickly see the metrics, metadata, and alerts you need to see at a glance to help you investigate and resolve issues with your hosts quicker!
KQL filtering for APM alerting rules
editVersion 8.10 introduces the capability to leverage Kibana Query Language (KQL) filters within the alerting rules for latency, failed transaction rates, and error counts. This enhancement significantly improves the versatility available to our users when formulating Application Performance Monitoring (APM) alerting rules.
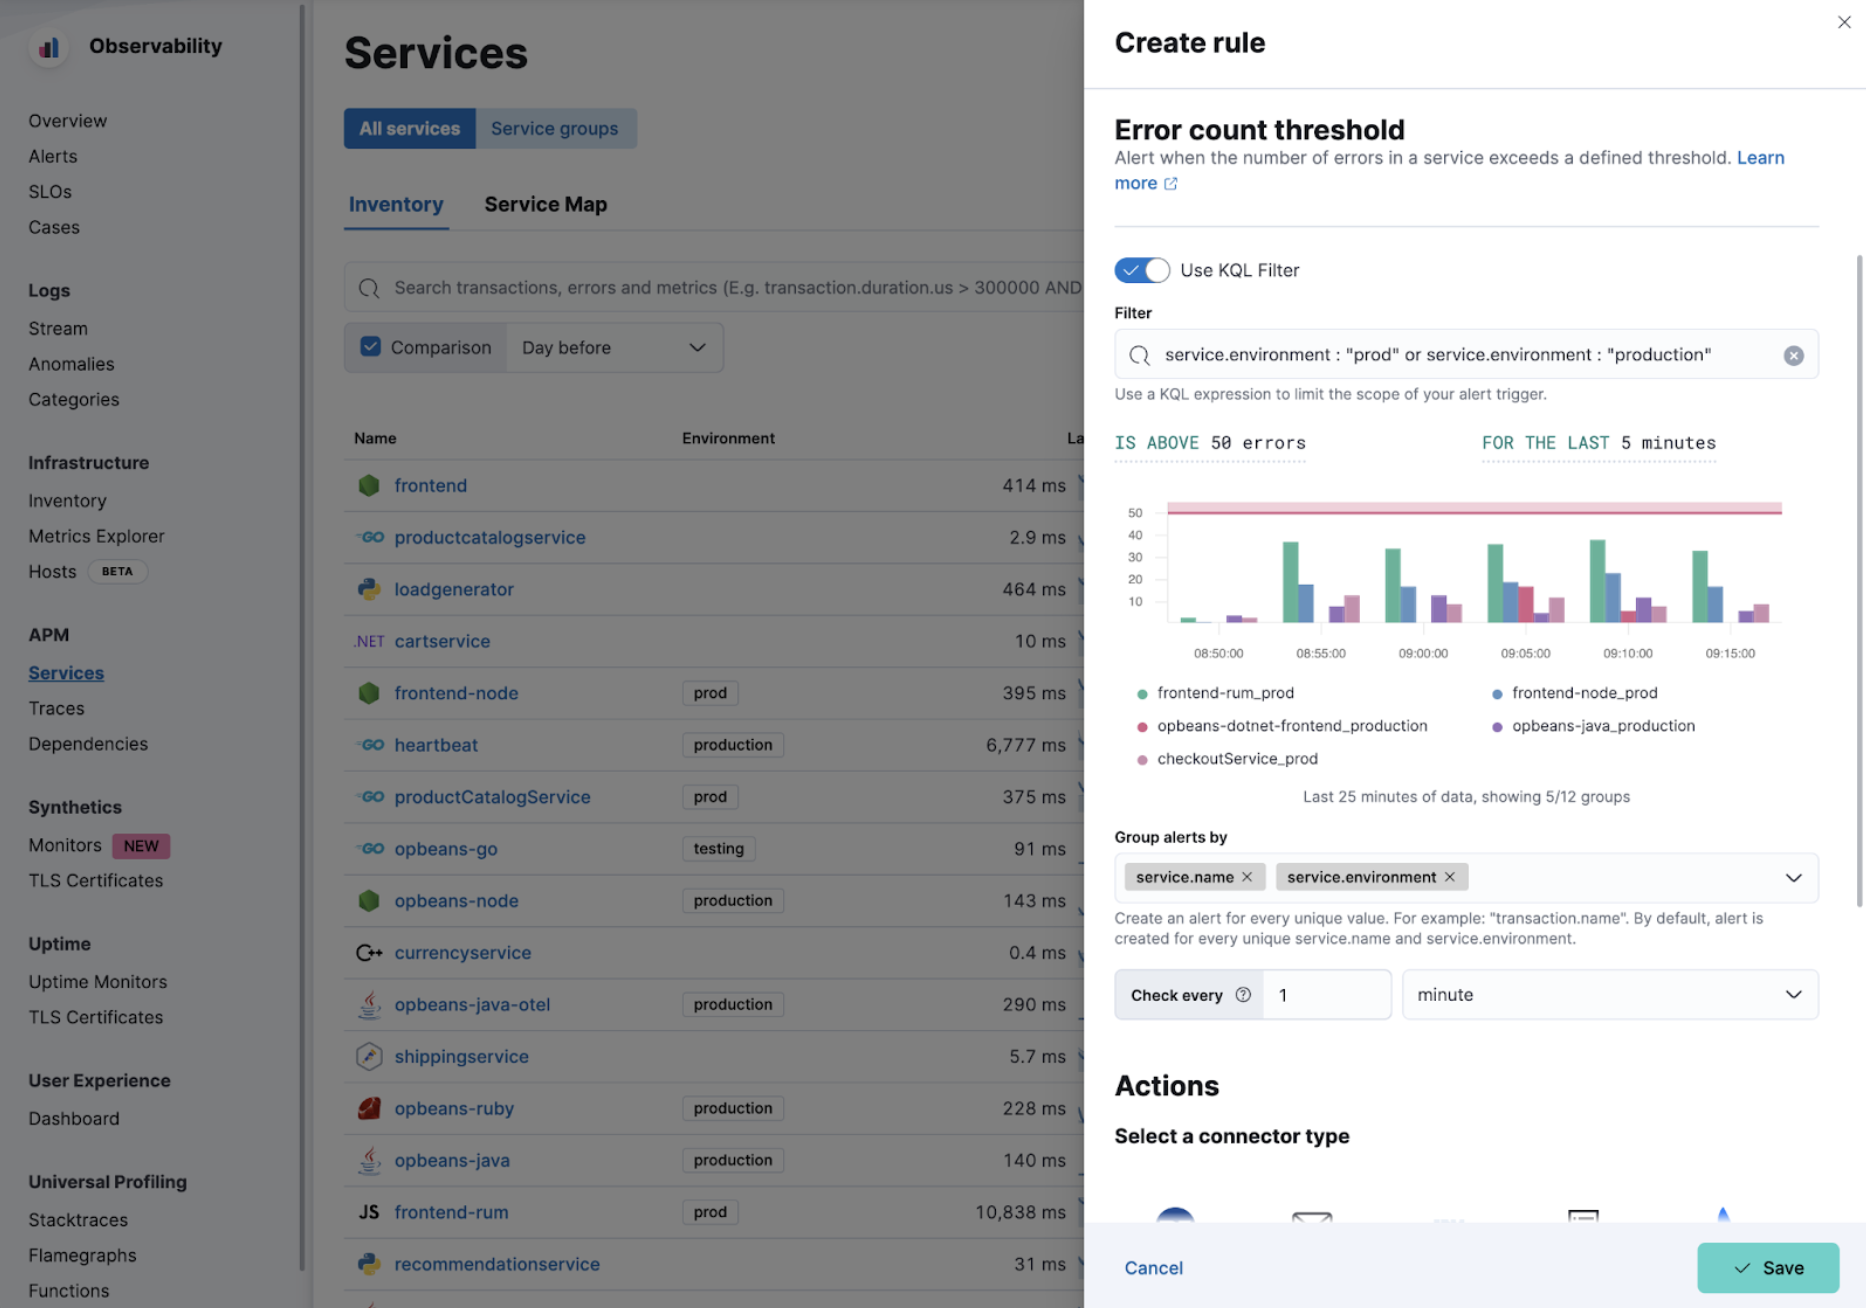
Ready to create an alert? See APM Alerts and rules to learn how.
Revamped dashboards for JVM and Node.js with new runtime metrics
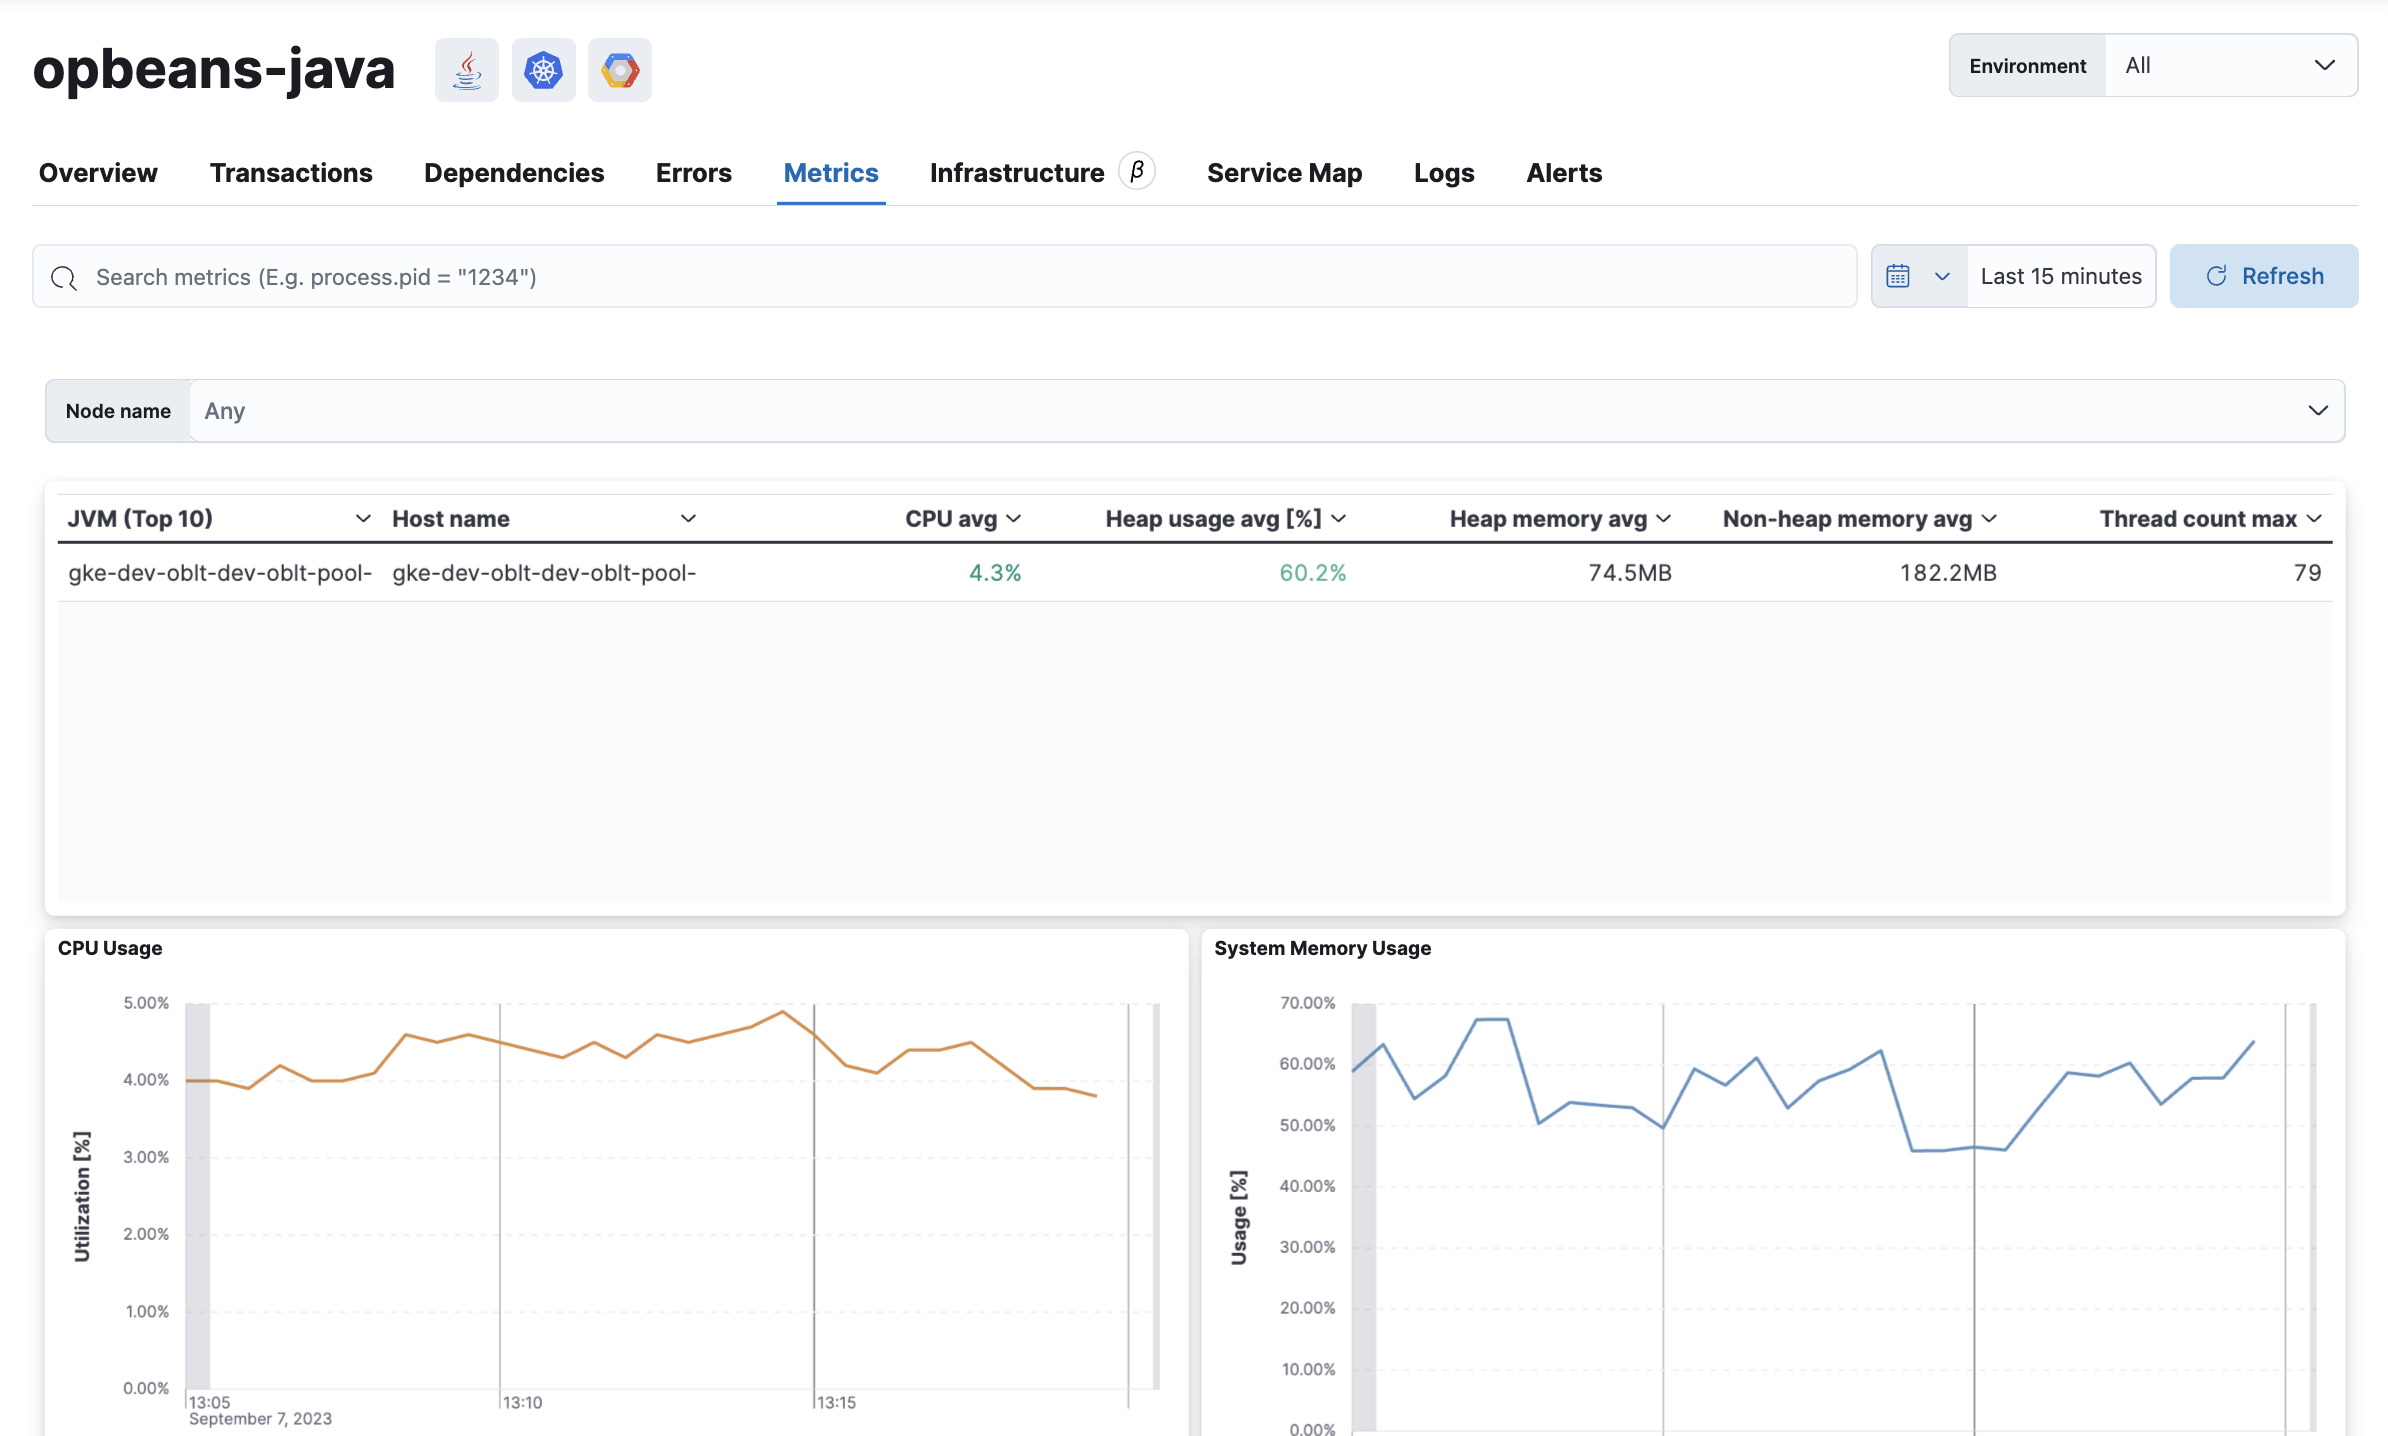
editNew in 8.10, the portable dashboard feature of Kibana has been leveraged to revamp our JVM runtime metrics dashboard. The following additional JVM metrics are now available out-of-the-box:
- Memory allocation rate
- Heap usage split by memory pools
Additional runtime metrics have also been introduced for Node.js. These metrics are:
- Heap usage (by Node)
- External memory usage
- No. of active requests
- No. of active handles
- Average event loop delays
Learn more:
- Documentation: JVM runtime metrics
- Documentation: Node.js runtime metrics
- GitHub issue for the Kibana Portable Dashboards feature
- GitHub issue for leveraging the portable dashboards feature for runtime metrics
More integrations now use 70% less disk space to store metrics
editThe number of integrations leveraging Elasticsearch’s time series mode has risen once again to include those we know are most important for your monitoring needs.
The only thing you need to do to get this important reduction in metrics storage is to upgrade your Elastic Agent integration to the latest version. A new TSDB index will be created and a roll over automatically applied without you having to do anything.
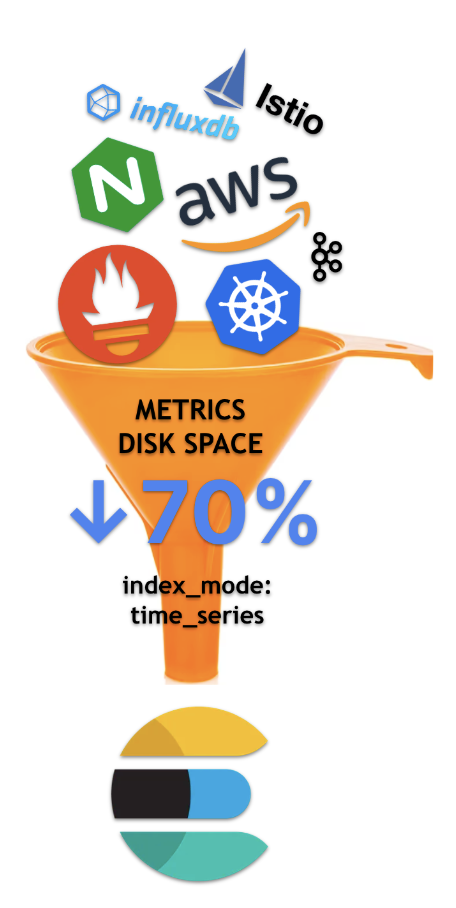
The below integrations are now waiting for you to upgrade, efficiently store metrics, and enjoy having them next to your logs in Elasticsearch.
AWS Fargate [1] |
||||
PostgreSQL [1] |
Prometheus [1] |