What’s new in 8.8
editWhat’s new in 8.8
editHere are the highlights of what’s new and improved in 8.8.
Other versions: 8.7 | 8.6 | 8.5 | 8.4 | 8.3 | 8.2 | 8.1 | 8.0 | 7.17
Synthetic Monitoring Goes GA
editElastic Observability’s brand new cutting-edge Synthetic Monitoring solution, designed for seamless GitOps management and SRE-focused workflows, is now Generally Available. Gain end-to-end visibility with our global managed testing infrastructure, proactively identify and resolve issues, and ensure exceptional user experiences. Elevate your monitoring capabilities and transform your application’s performance with the power of Elastic.
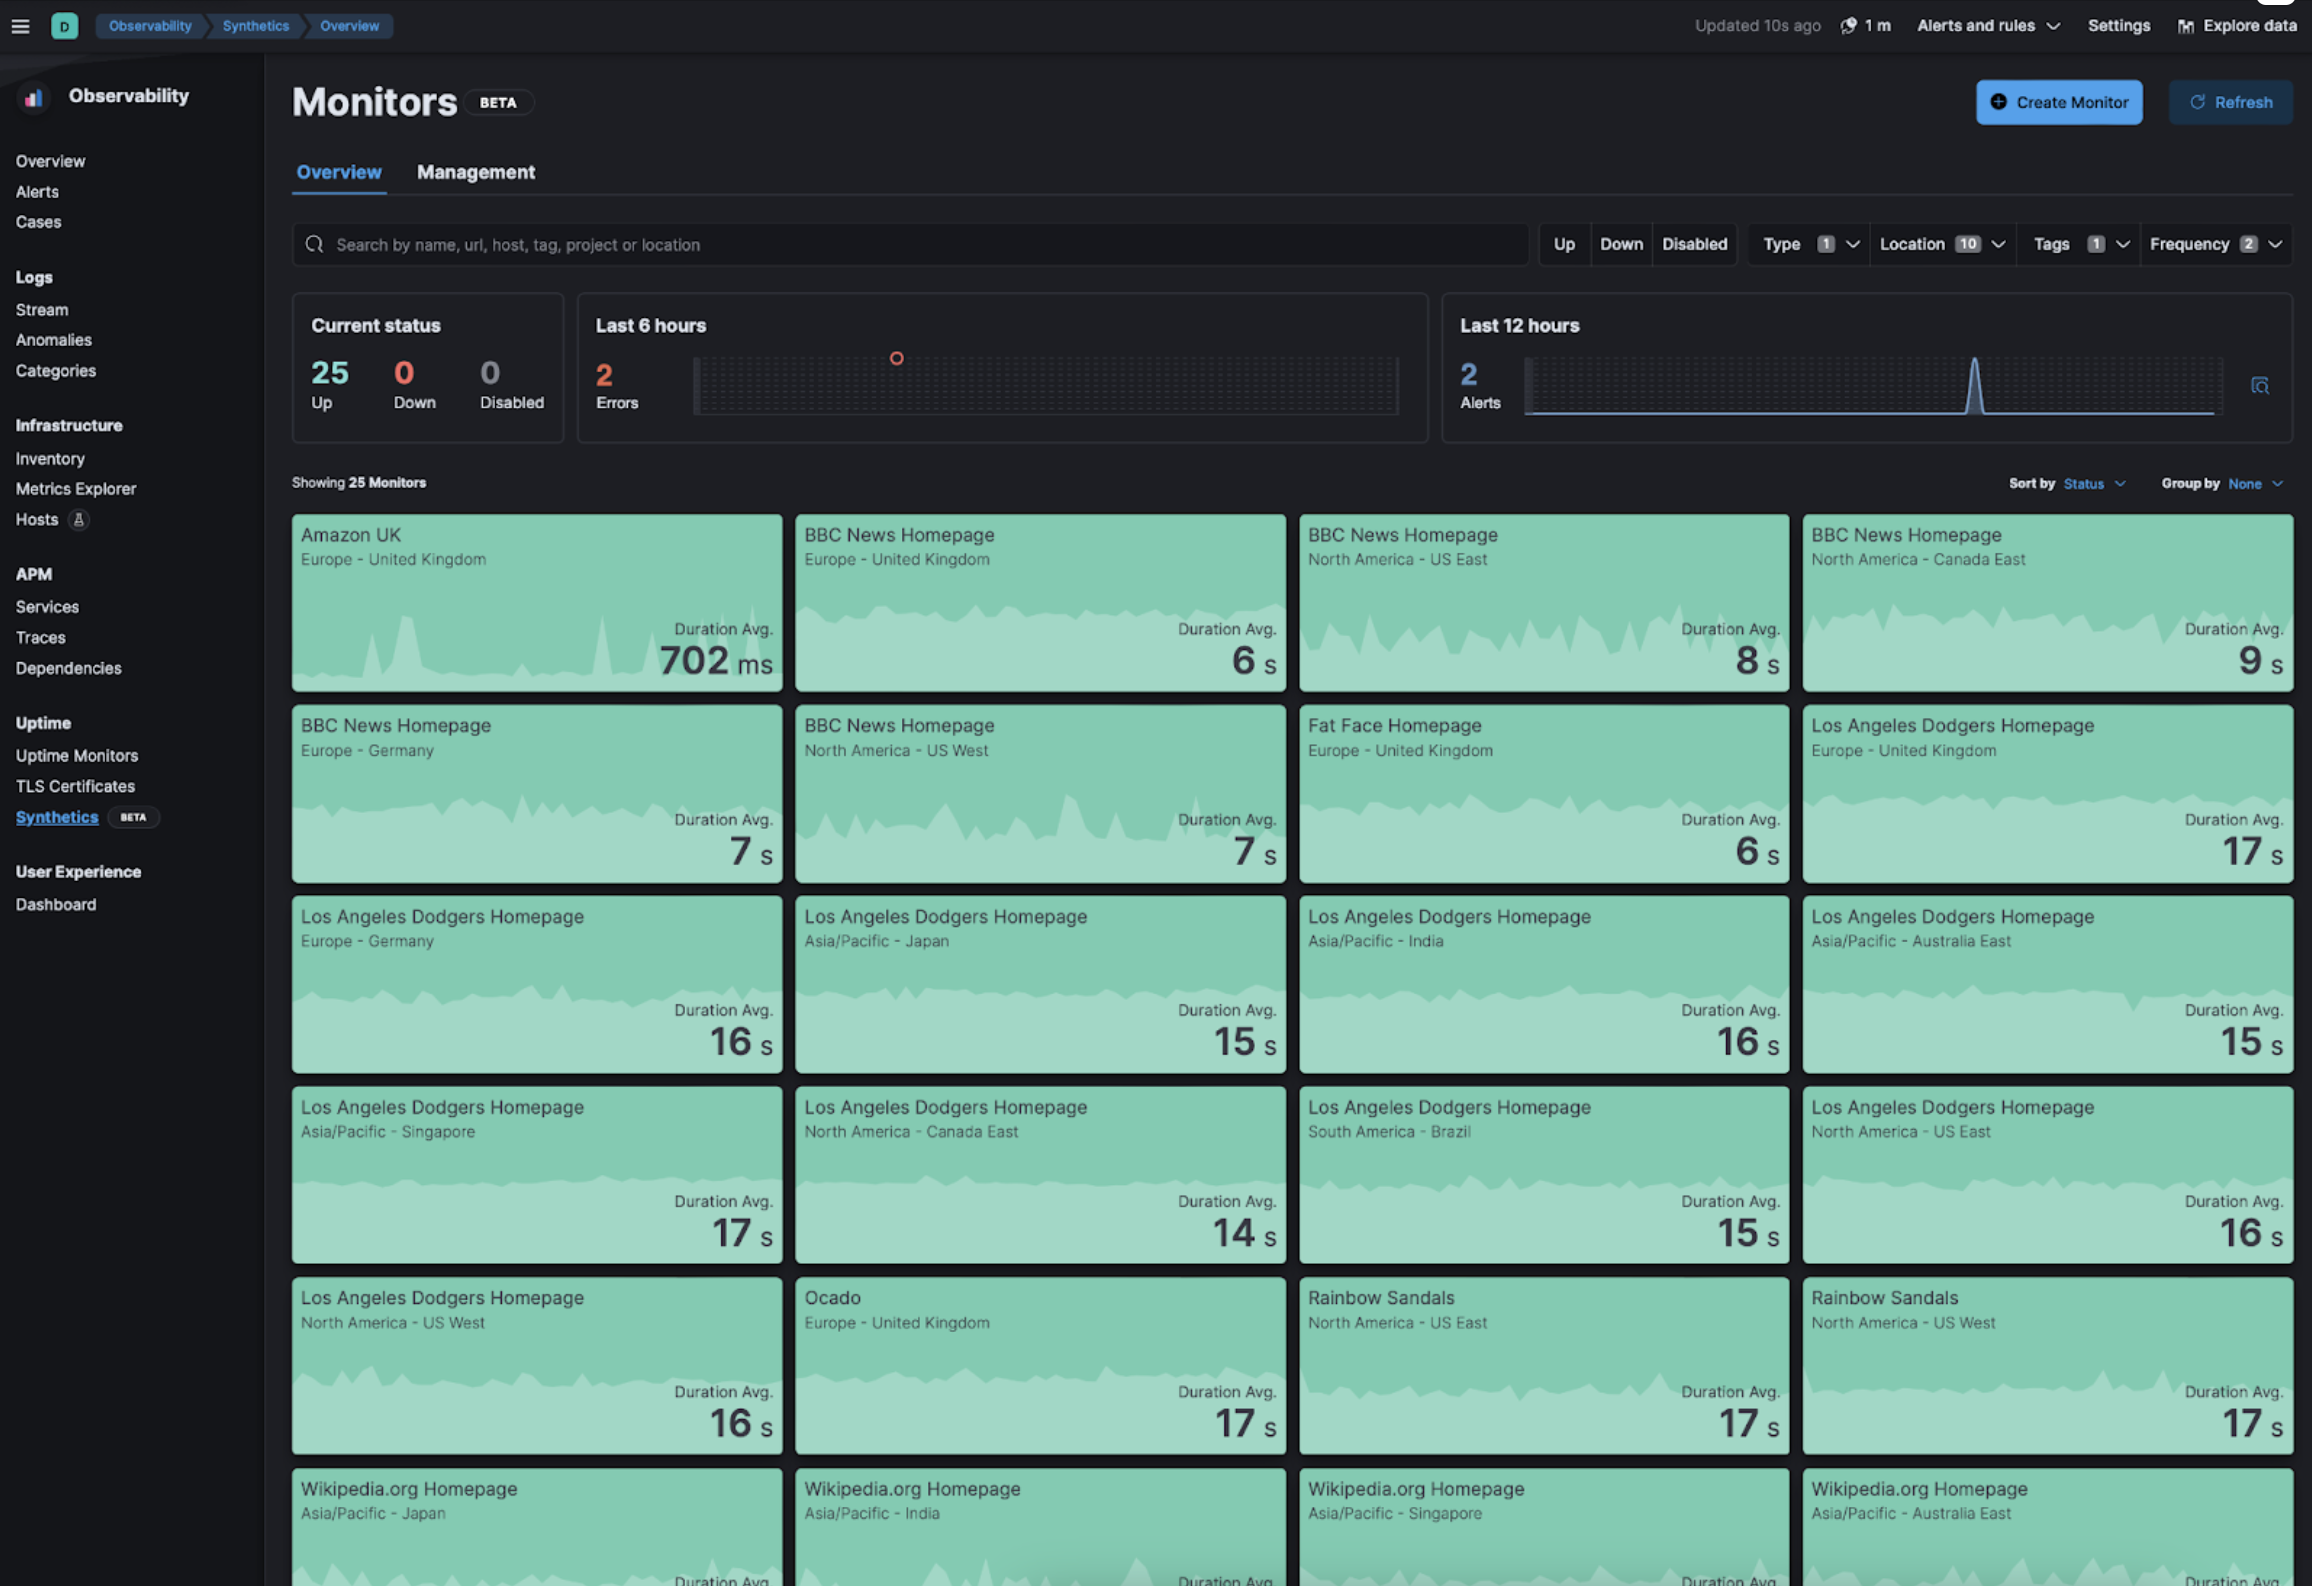
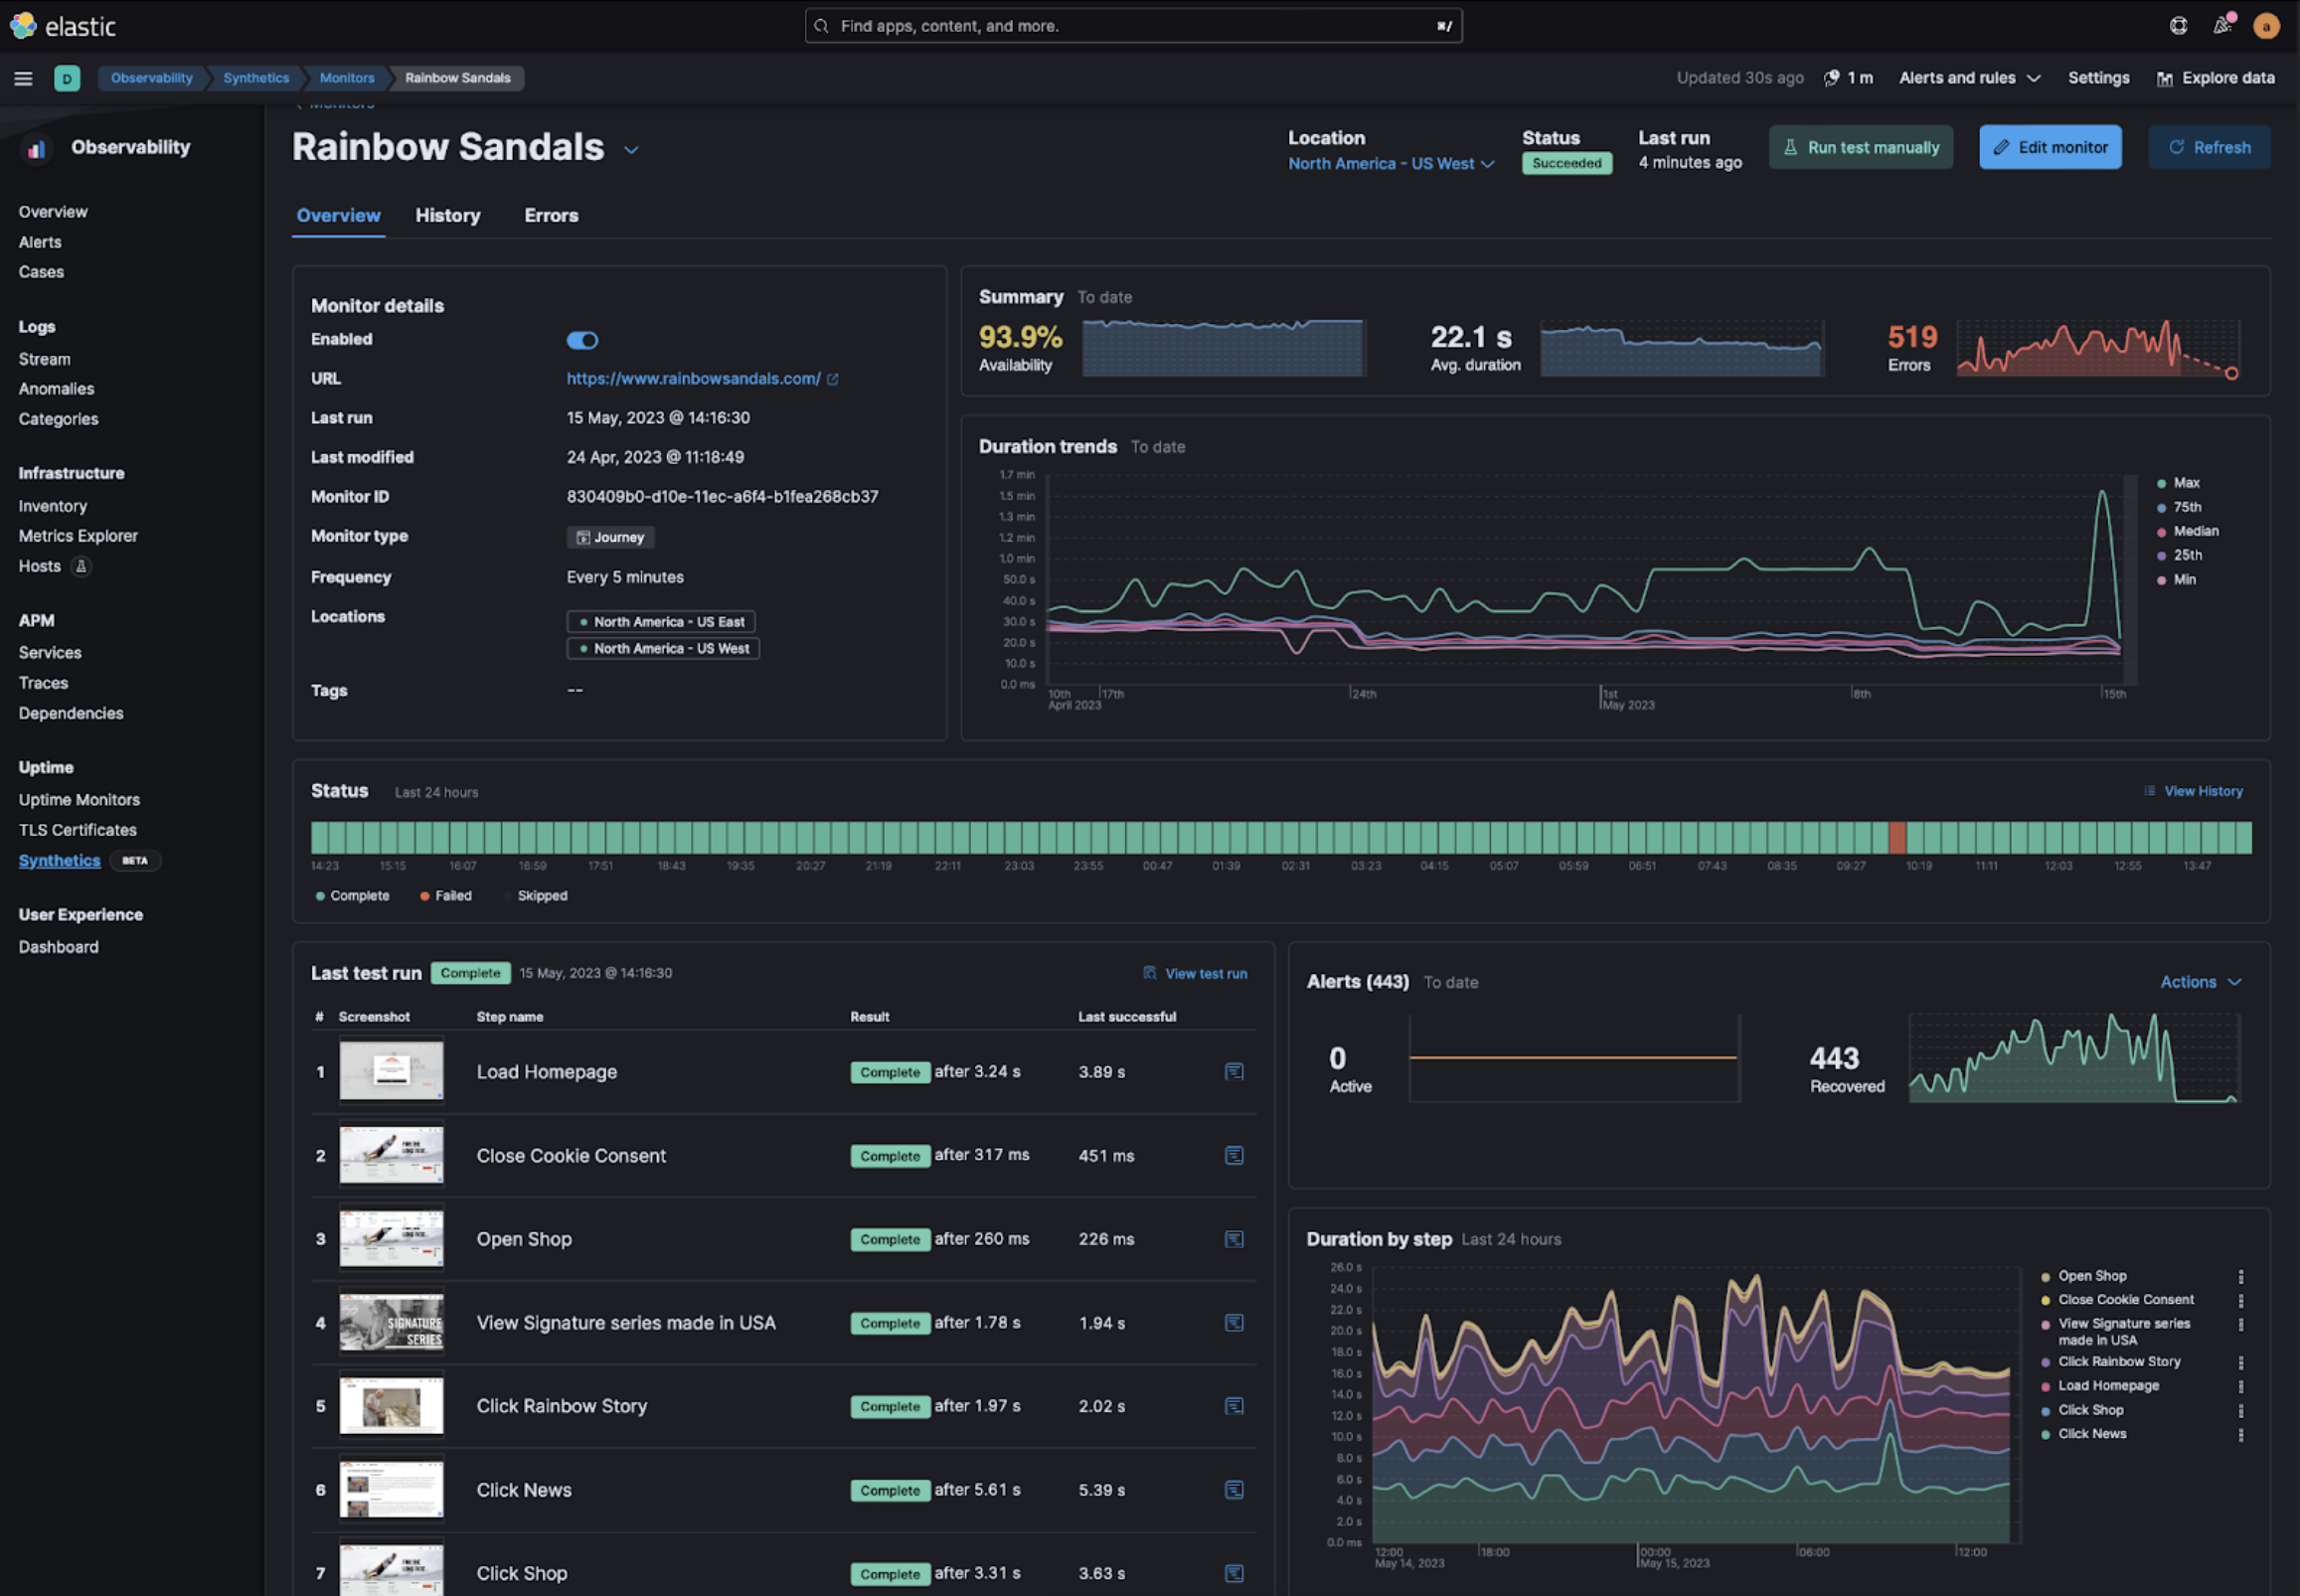
Enhanced SRE Capabilities
editOur synthetic monitoring solution bolsters your SRE experience with dedicated error detail pages and issue triage. Compare successful and failed test runs, analyze performance trends, receive proactive alerts, and integrate with incident management tools for optimized end-user experiences.
Streamlined GitOps Management
editOur industry-leading synthetic monitoring solution lets you manage monitors as code. Write tests pre-production, then push them into synthetic monitoring for post-production testing. Minimize release-testing lag, reuse scripts, and manage monitors effortlessly. Get version control, RBAC, and centralized test code benefits via source control.
Broad Coverage Capabilities
editOur front-end synthetic monitoring complements APM and Infrastructure Observability, offering critical visibility into your application’s workflows and third-party dependencies. Without it, SREs can’t fully understand an application’s ecosystem, making it vital for optimal performance and exceptional user experiences.
Comprehensive Managed Testing Infrastructure
editOur Elastic-first managed service in synthetic monitoring offers global testing coverage with no hardware management needed. Conduct lightweight to full browser tests, and enjoy automatic scaling, built-in security, and seamless Elastic Observability integration. We also support private testing locations for specific needs. Focus on delivering exceptional user experiences with our managed infrastructure.
Refer to the Synthetic monitoring docs for more information.
Ingest logs from Amazon Kinesis Data Firehose
editAmazon Kinesis Data Firehose is an extract, transform, and load (ETL) streaming data pipeline service that reliably captures, transforms, and delivers streaming data. Users configure data producers to send data to Kinesis Data Firehose and, with this new GA integration, Kinesis Data Firehose delivers the data to Elastic Cloud in AWS. Elastic appears as a drop-down option when configuring the Kinesis delivery stream in the AWS console UI, and along with pre-filled default values for most configuration settings, this makes it a direct, easy, agentless setup process to send log data to Elastic.
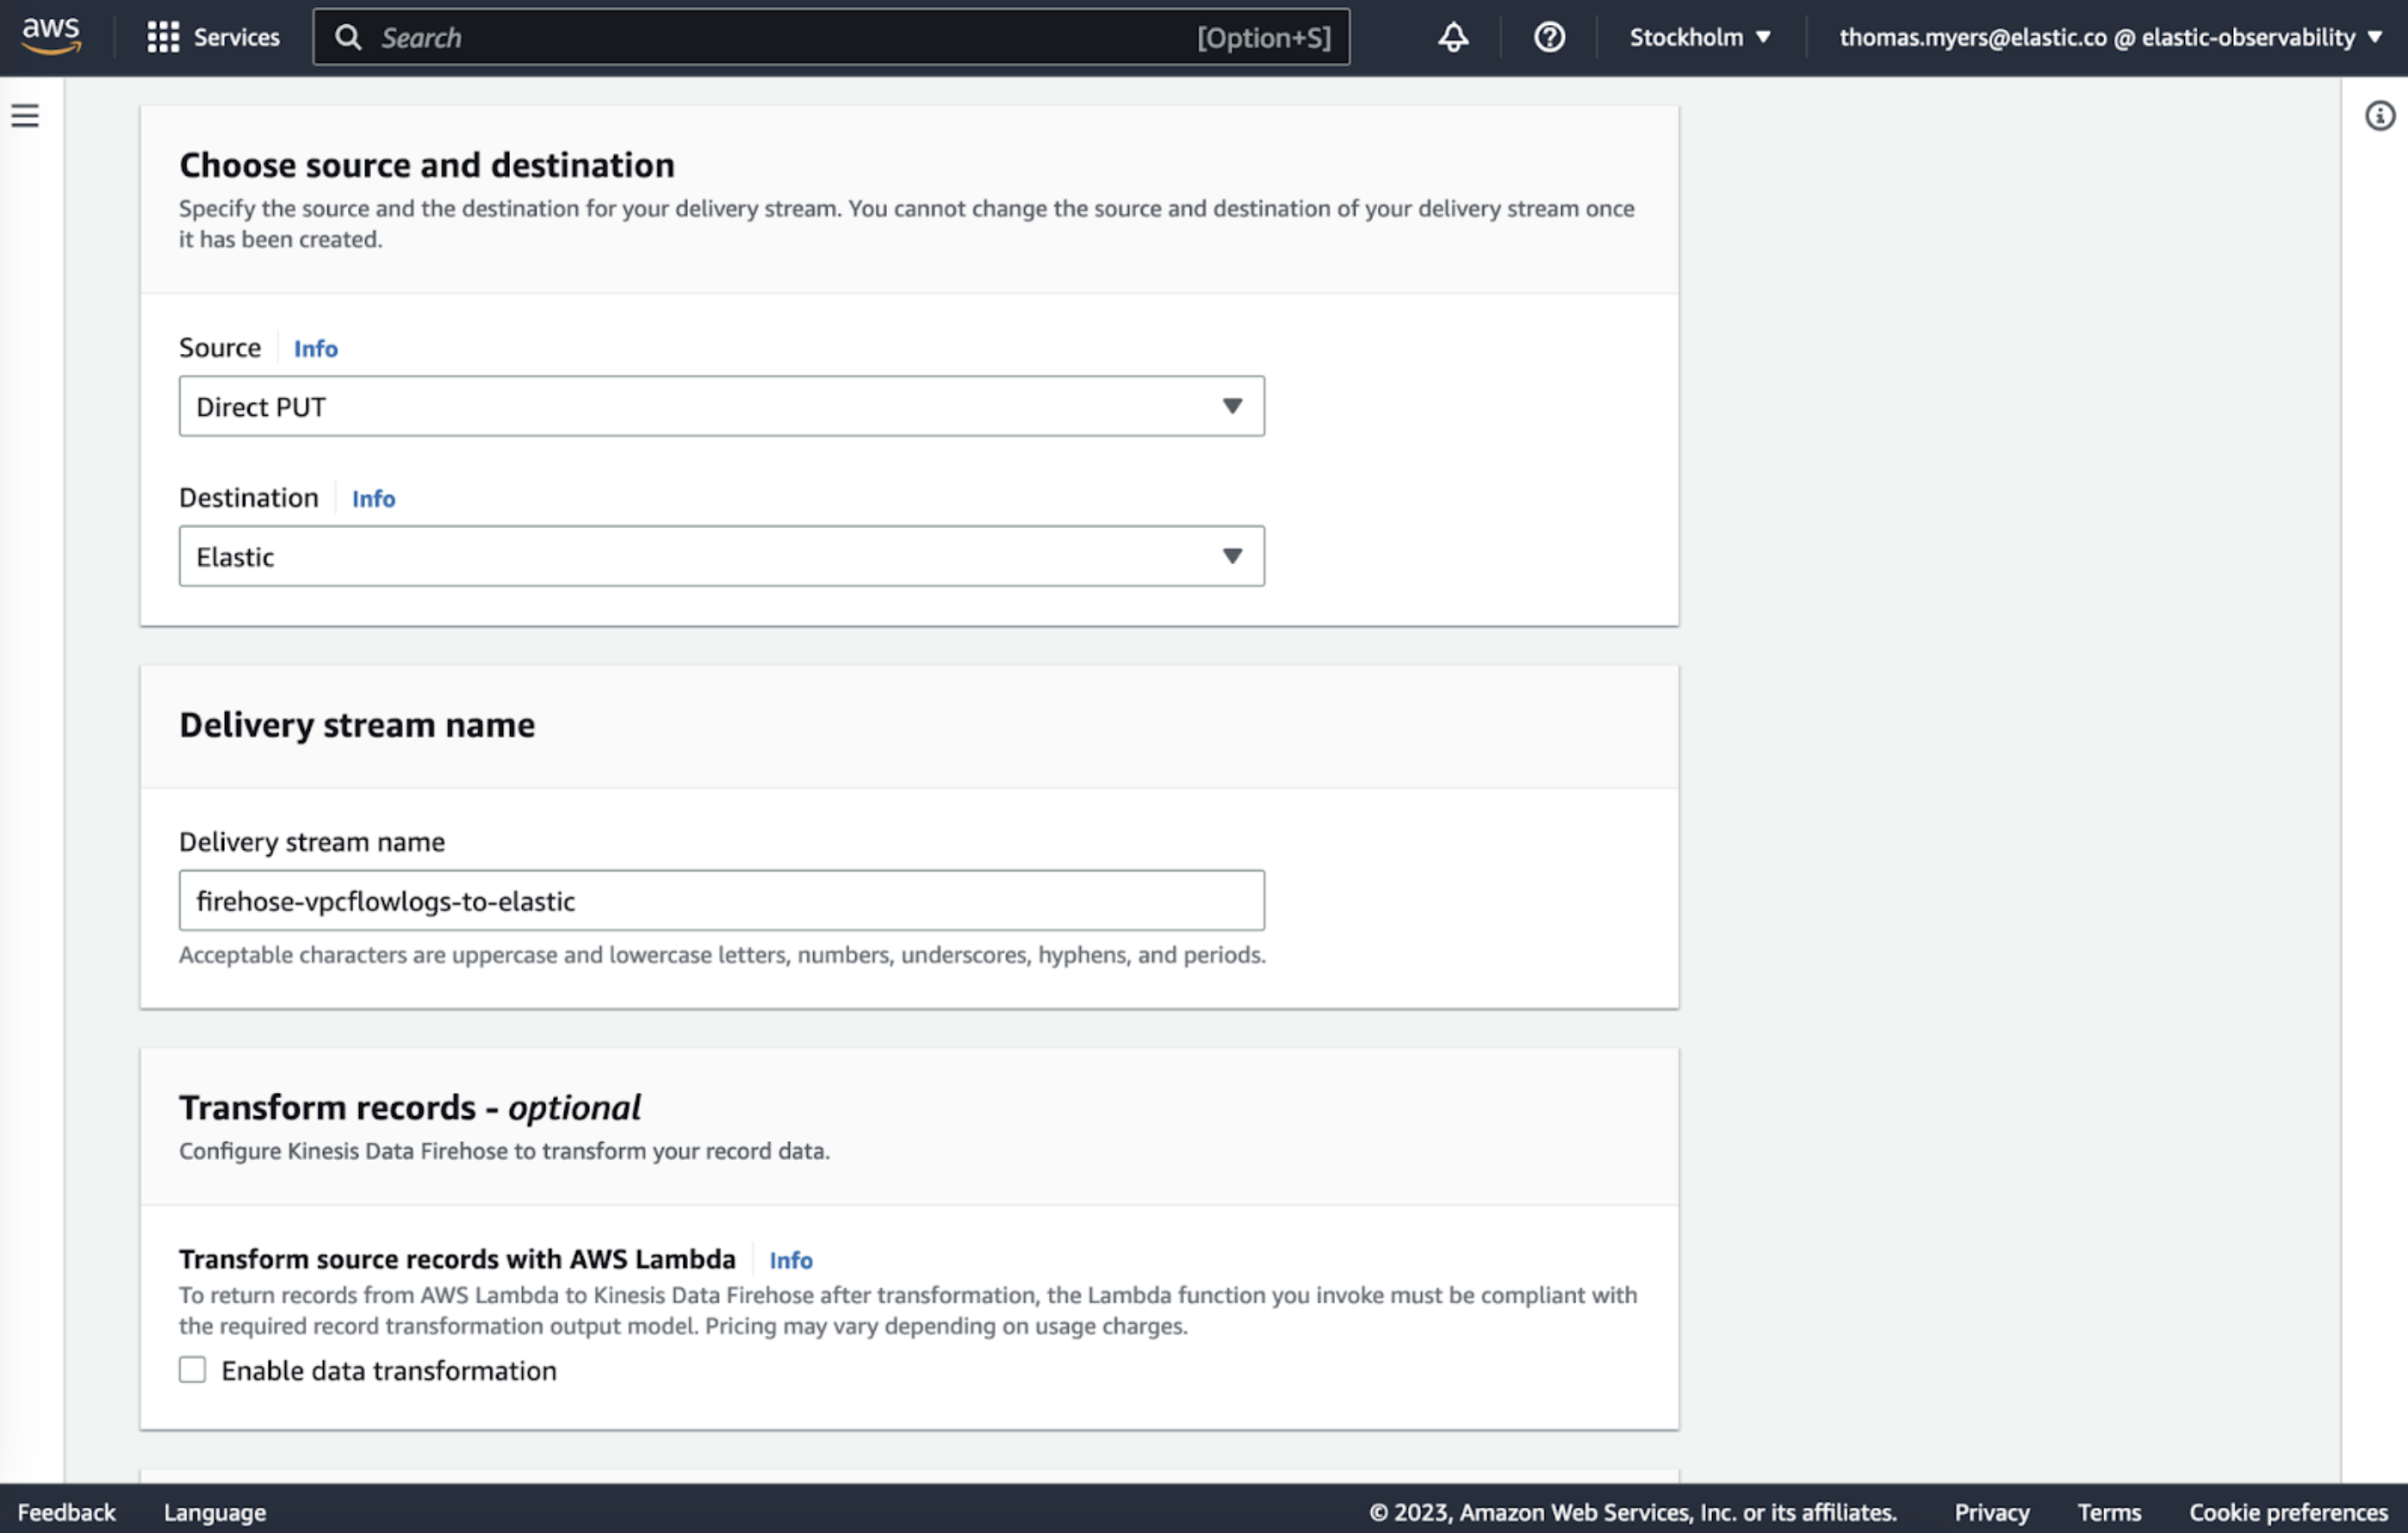
Refer to the setup guide for more information.
APM Server binary
editWhen the Elastic APM Server Integration was introduced in version 7.16, documentation was updated to state that the standalone APM Server binary was termed “legacy” and would be deprecated in a future release. After careful consideration of learnings and feedback, the APM Server binary (legacy, standalone) will not be deprecated.
Starting with version 8.8, we are returning full support for standalone APM Server binary for self-managed deployments. The documentation has been updated accordingly, completely removing the “legacy” terminology and deprecation notices. Moving forward, you can choose between two equally supported options:
- Fleet-managed APM Server
- APM Server binary
Refer to the APM documentation for more information.
Service-level objectives in beta
editThis functionality is in beta and is subject to change. The design and code is less mature than official GA features and is being provided as-is with no warranties. Beta features are not subject to the support SLA of official GA features.
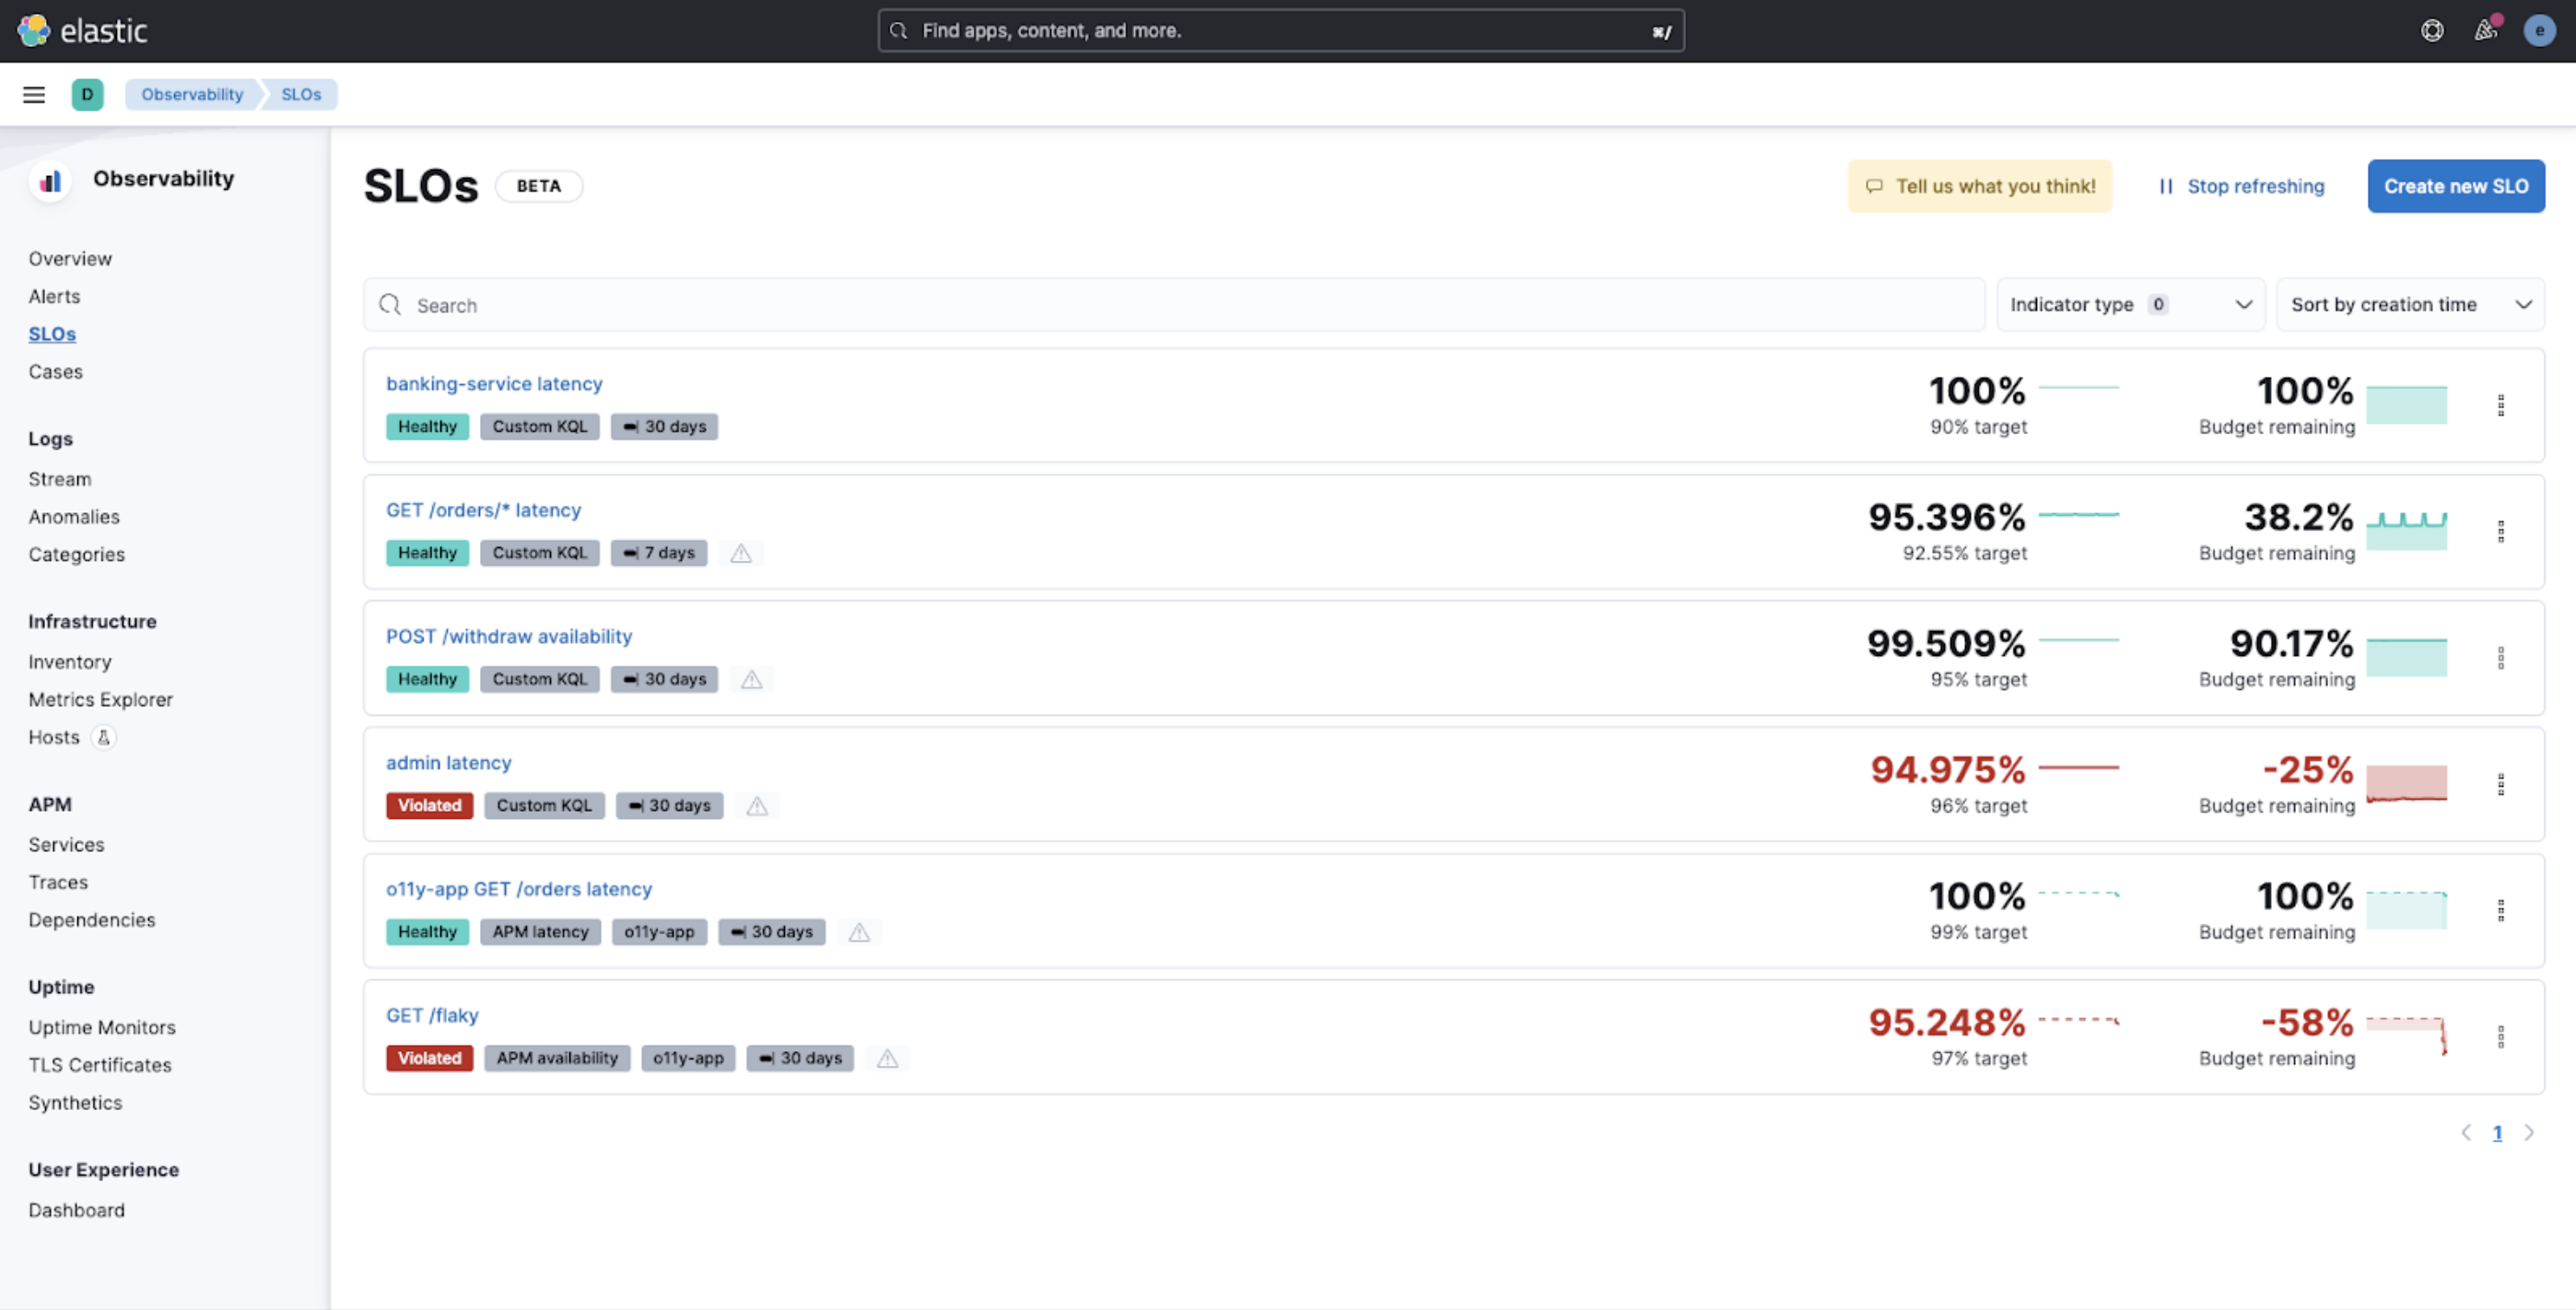
In 8.8, we are introducing new Service-level objectives (SLOs) management in Elastic Observability, which provides a powerful new way to measure and monitor your service quality over time.
SLOs allow you to set clear, measurable targets for your service performance based on factors like availability, response times, error rates, and other key metrics. You can define SLOs based on different types of data sources like custom KQL queries, APM latency or availability data, and more to come.
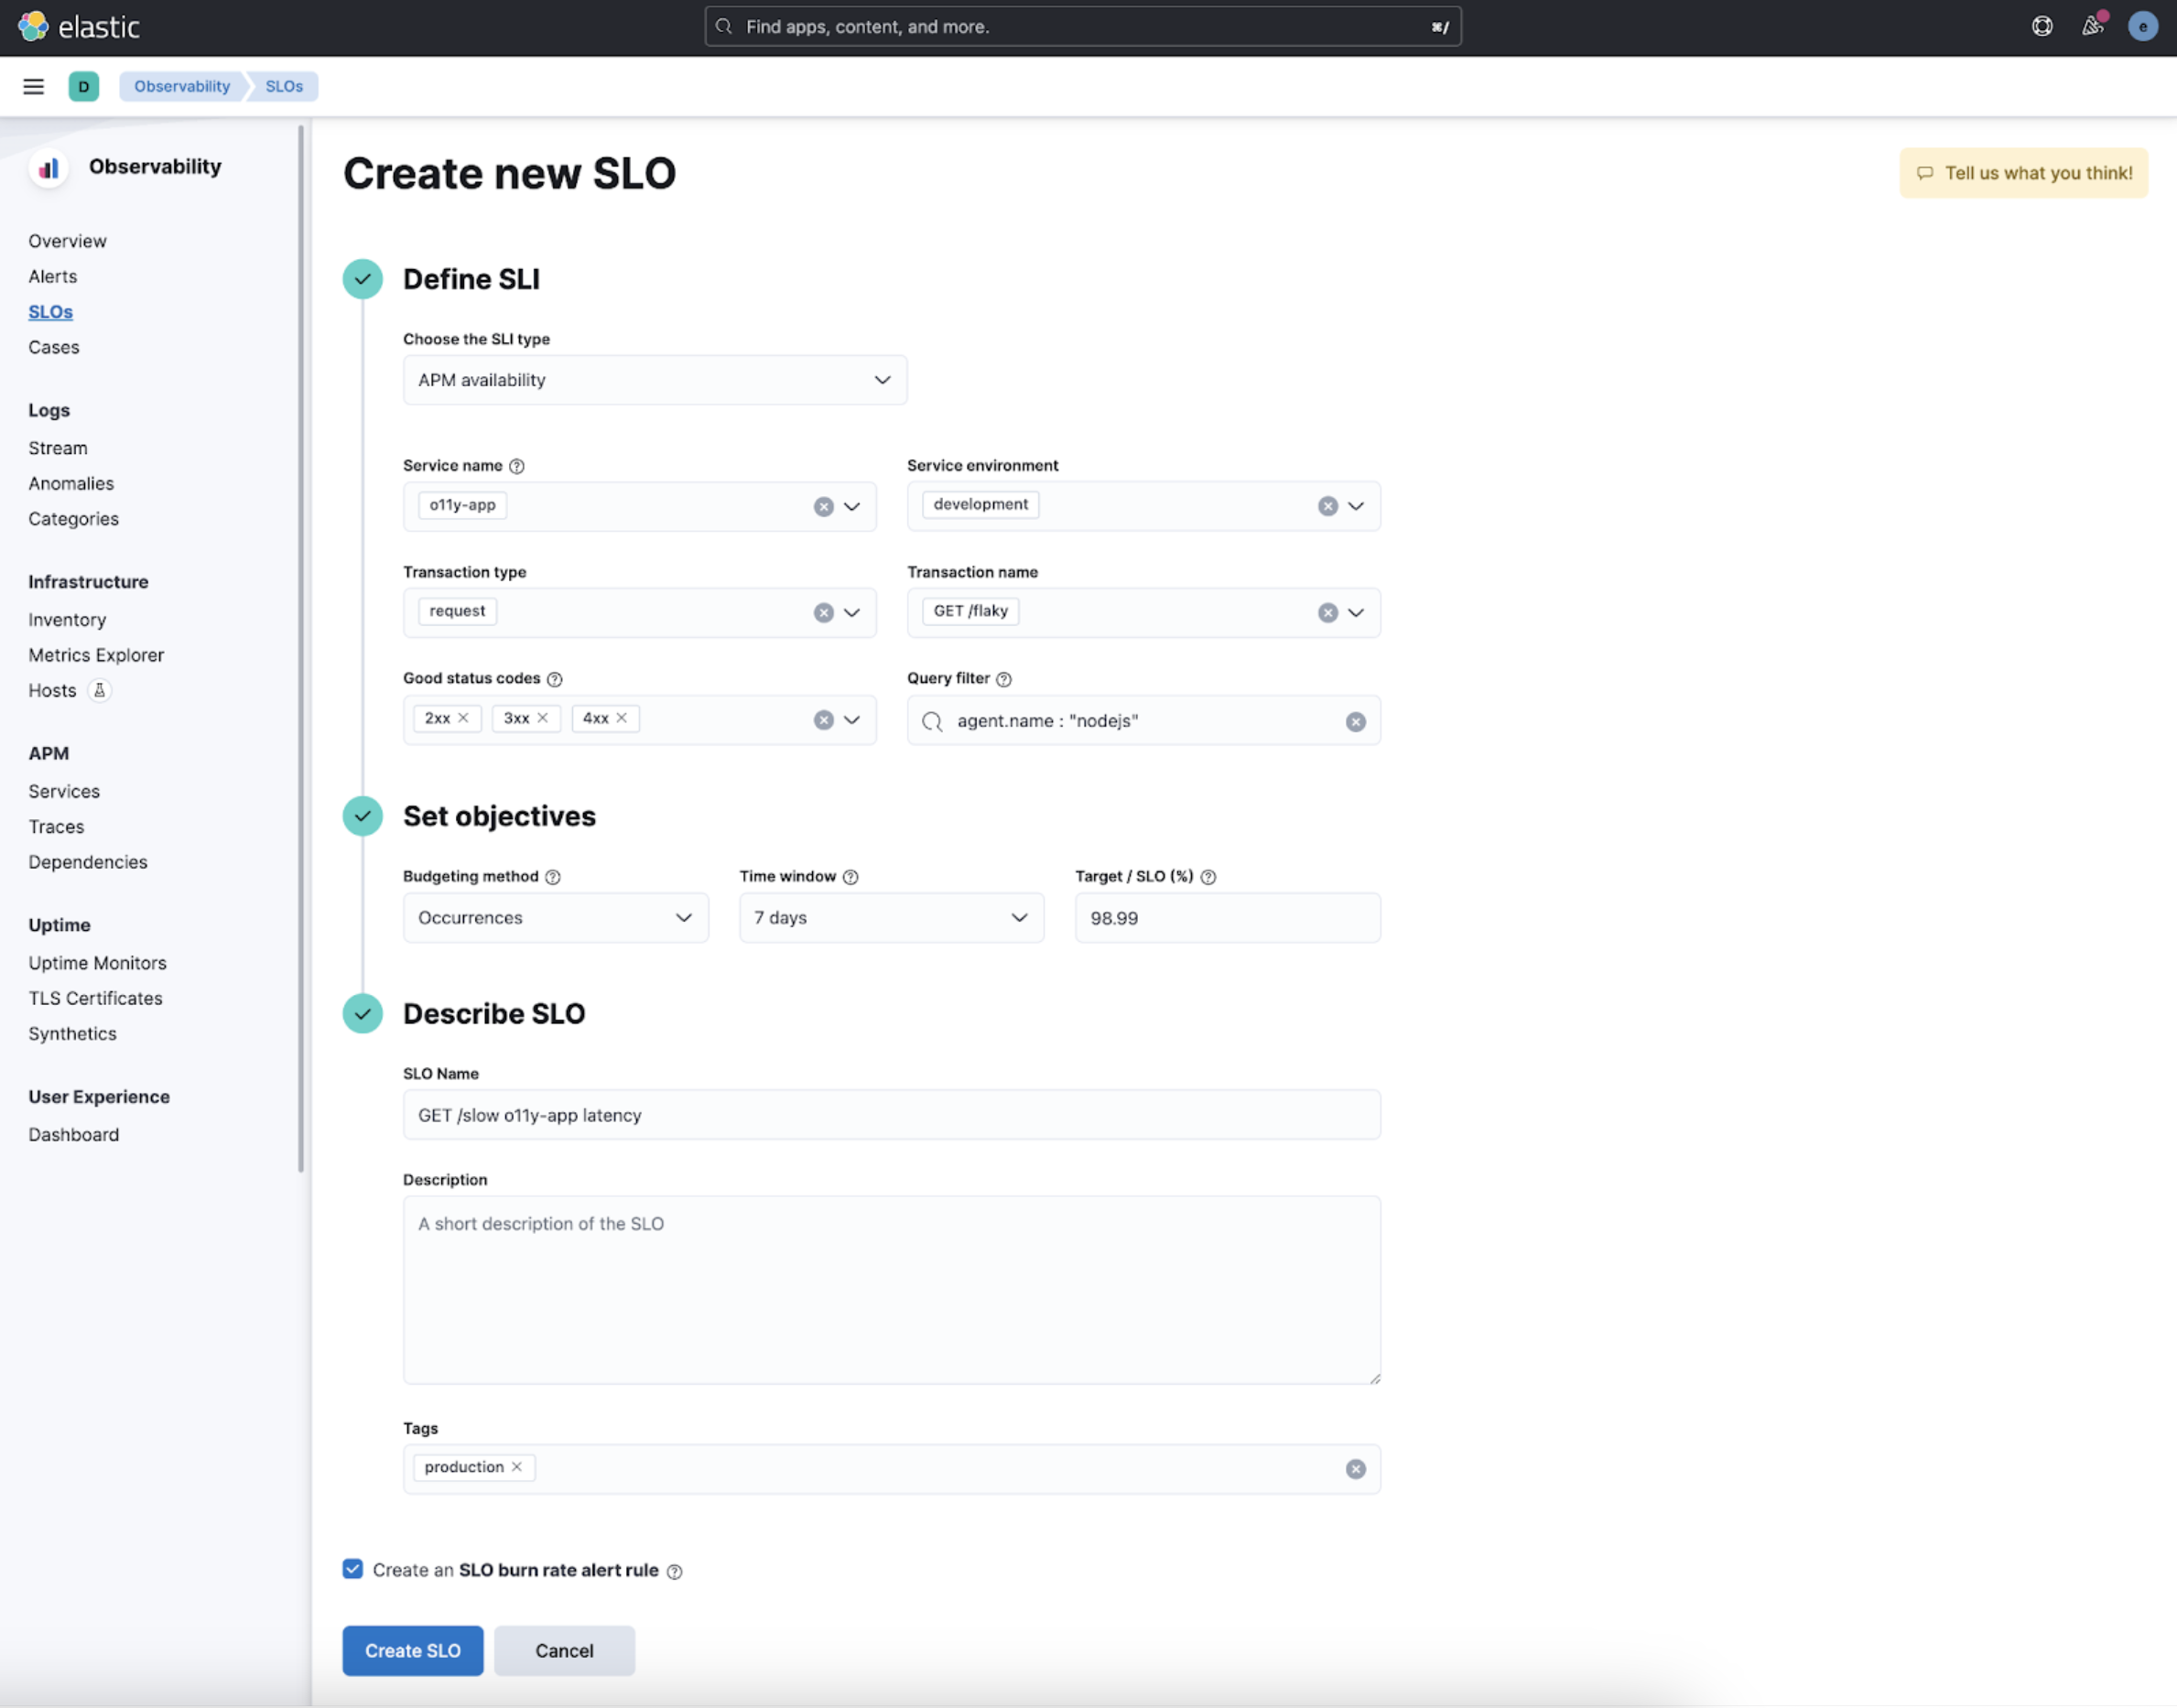
Once you’ve defined your SLOs, you can monitor them in real time, with detailed dashboards and alerts that help you quickly identify and troubleshoot issues. You can also track your progress against your SLO targets over time, with a clear view of your error budgets and burn rates.
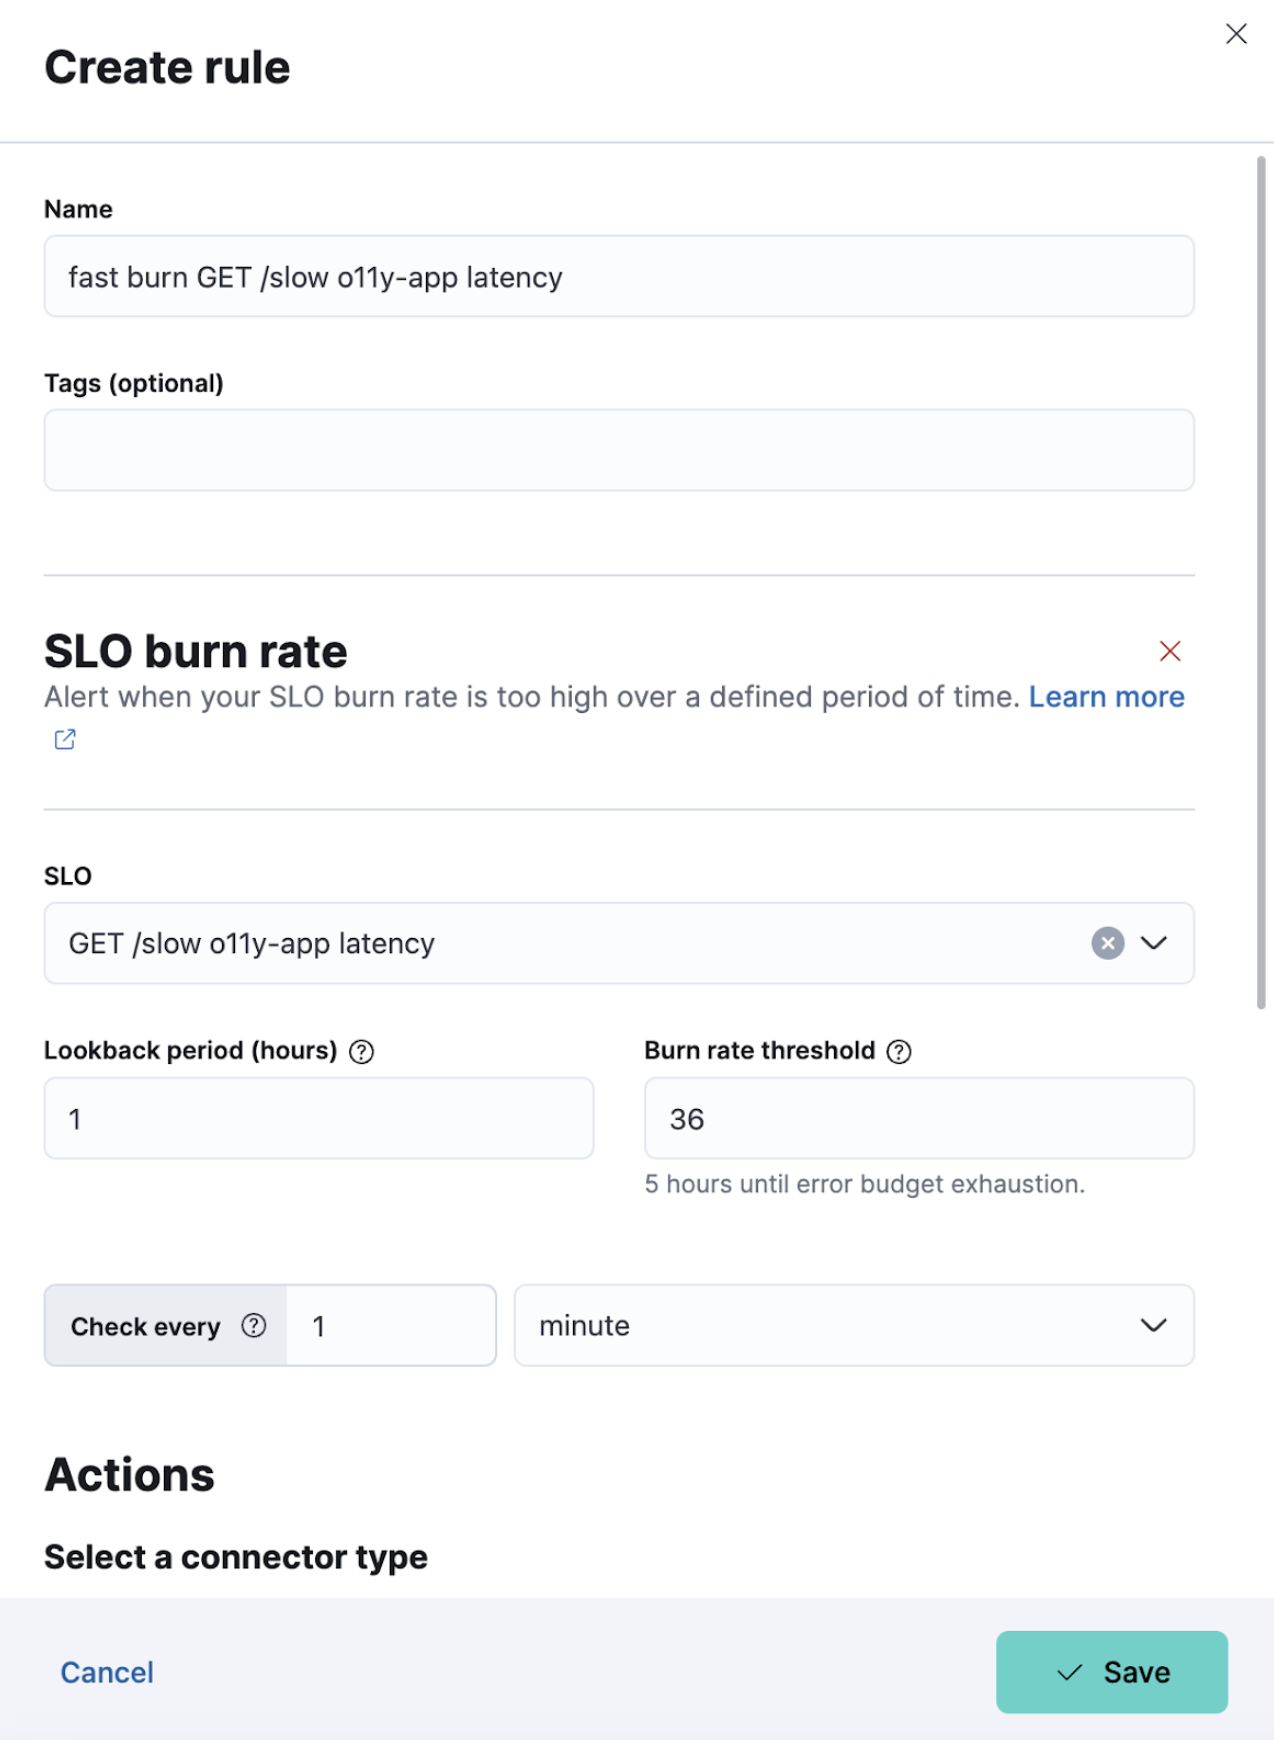
Support for multiwindow burn rate alerting on SLOs, as defined by the Google SRE book, is included. This allows you to get alerted when the burn rate of your SLO is above a defined threshold for two different lookback windows:
- A long window, which you define.
- A shorter window, which is automatically defined as 1/12th of the long window.
For example, if you set the long window to 1 hour, the short window will be set to 5 minutes.
Then for each lookback window, we compute the burn rate as the error rate divided by the error budget. When both burn rates are above the threshold, we trigger an alert.
Refer to the Service-level objectives (SLOs) documentation for more information.
Enhanced APM rule definition
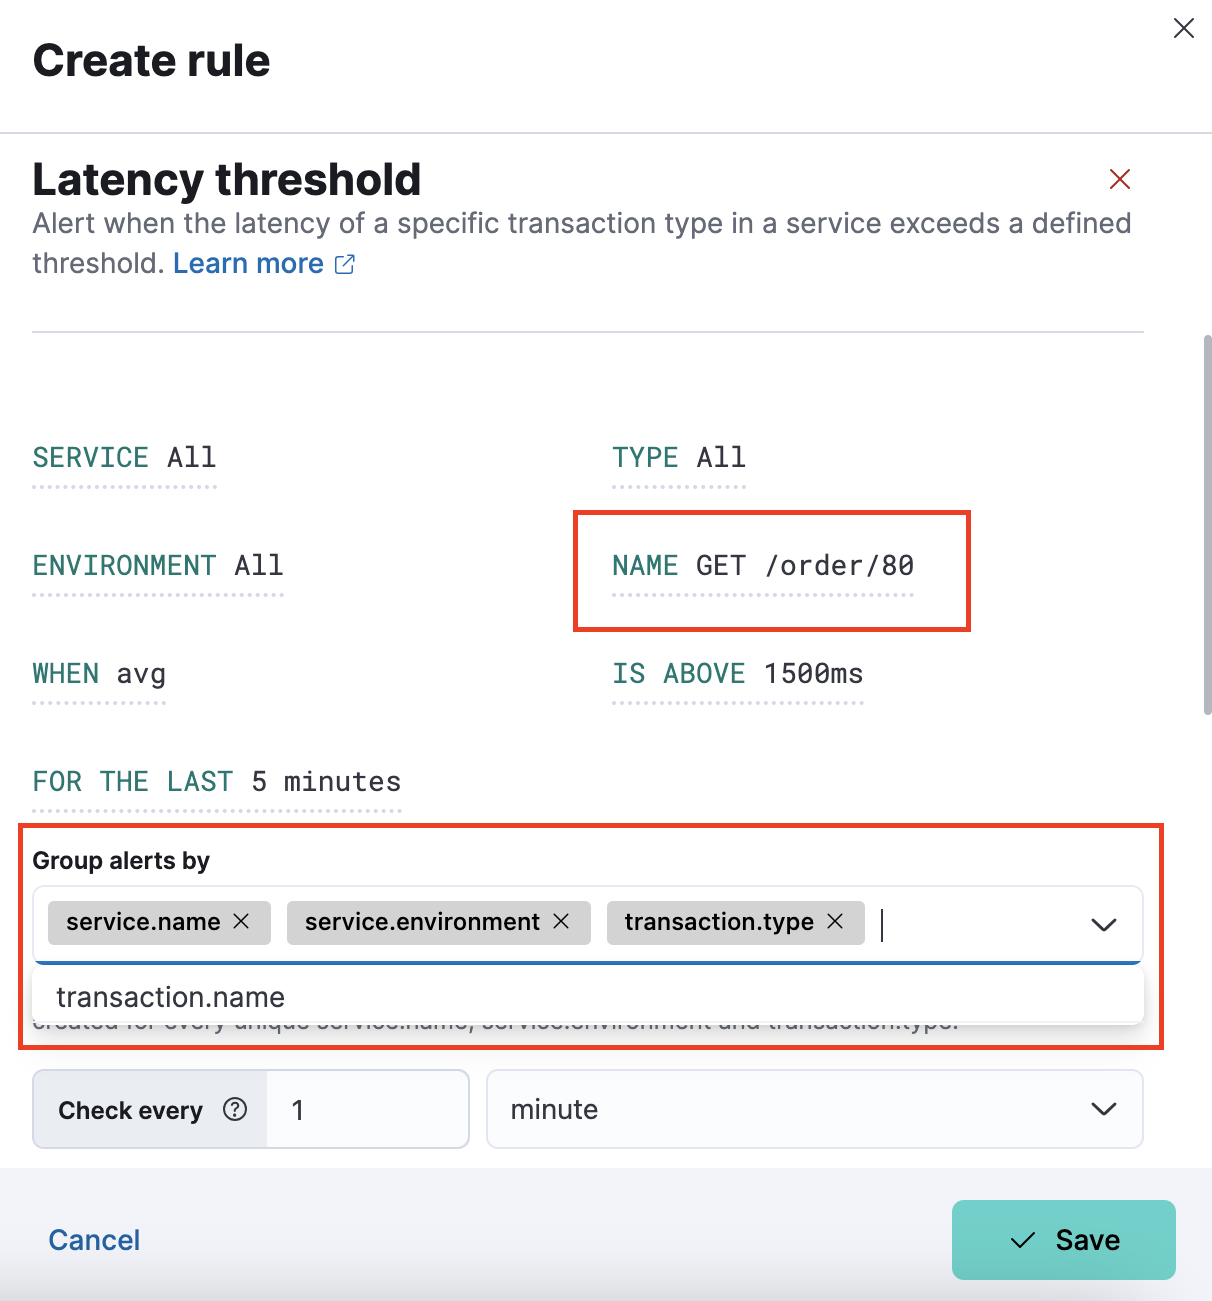
editYou can now enhance Observability APM rule definitions with additional dimensions to filter and group alerts. For example, alerts can be based on specific variables like transaction types, transaction names, and error groups. This allows for more granular controls on alerting to reduce alert fatigue and make notifications more actionable. You can also group alerts on specific fields which will breakdown the alerts based on the selected fields. For example, you can create a rule grouped by transaction name. This creates an alert for each transaction name in the service.
Alert details view
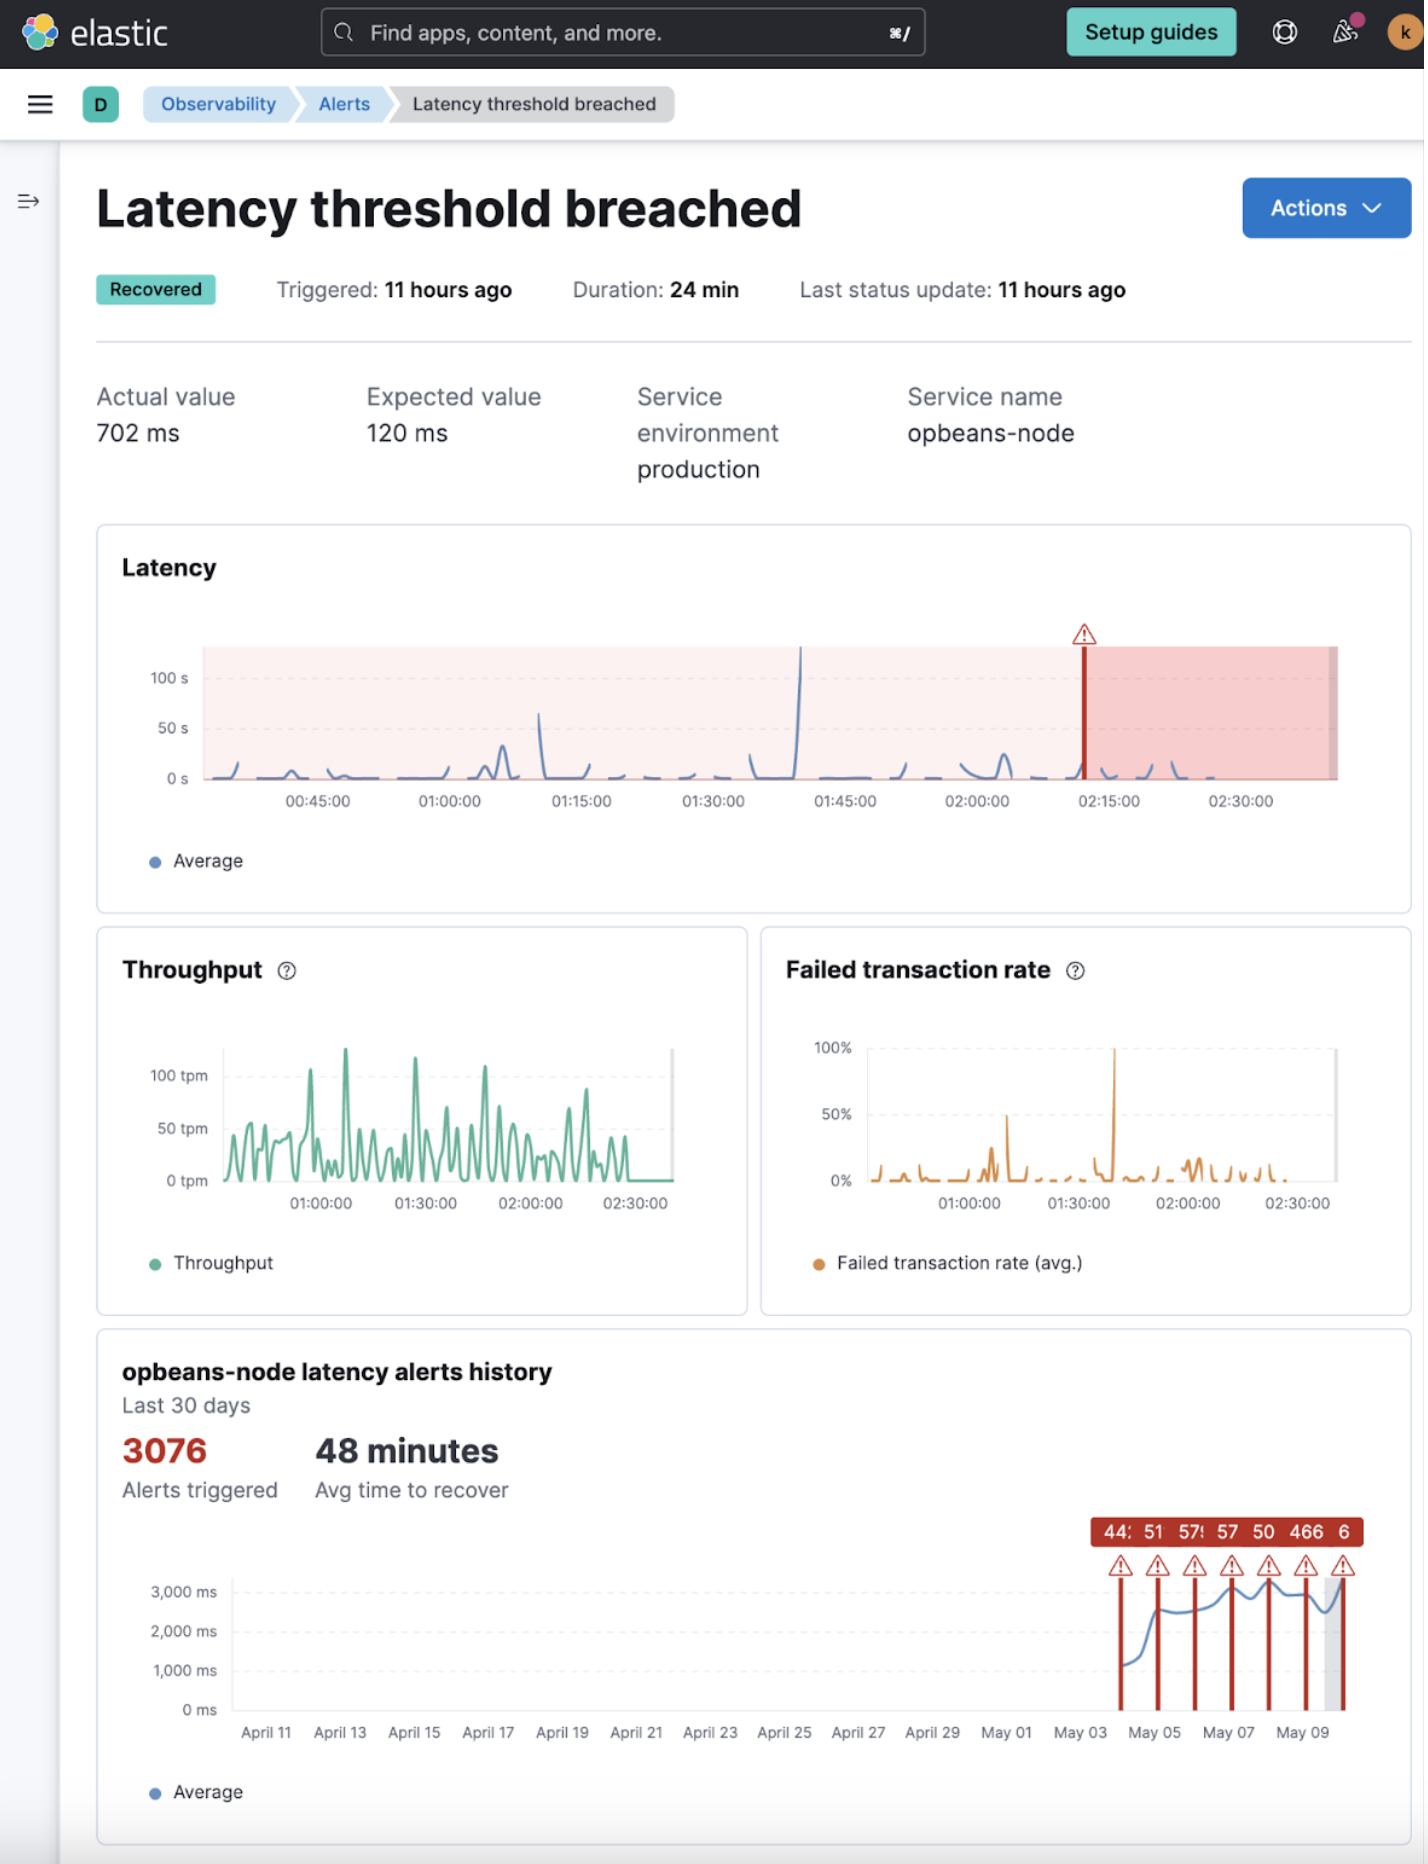
editAlert details pages have been added for APM latency alerts. The Alert details page provides the alert history and related information. You can use the alert detail page to gather information necessary to define the impact, urgency, and next steps for resolving an alert. APM latency gets the first alert detail page for triaging alerts, but many more are coming for other Observability alerts in upcoming releases.
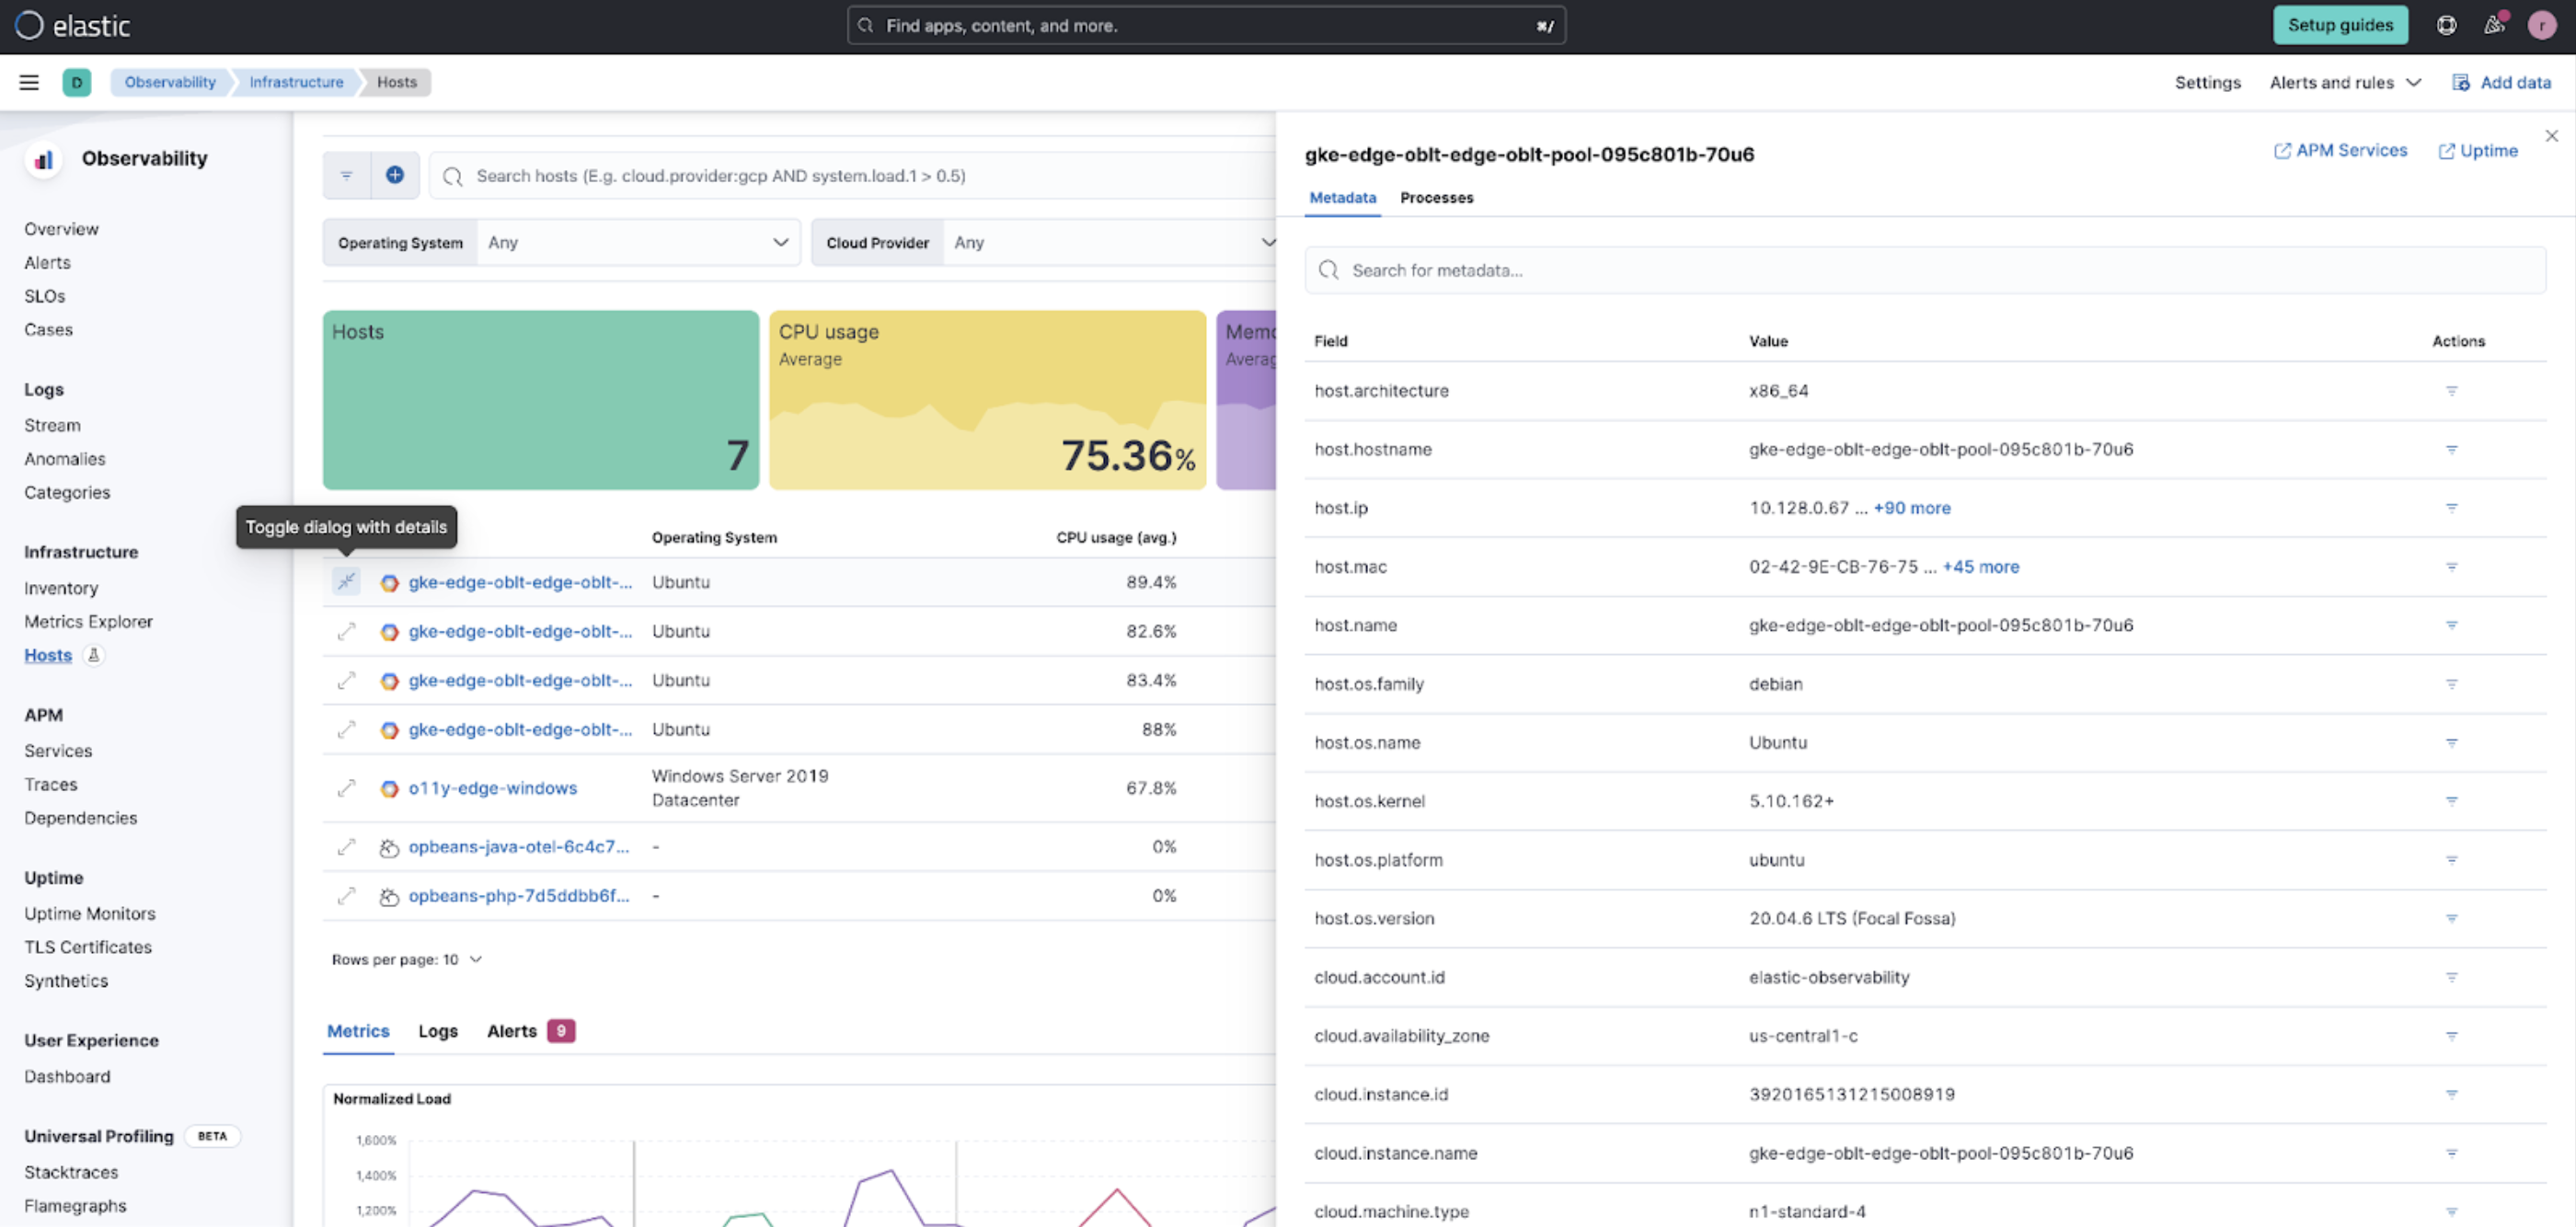
Easier filtering, previewing hosts and viewing logs and alerts in Infrastructure Hosts
editThe Hosts feature now allows you to view and filter by metadata (as well as processes) in the new preview fly-out available on each host to make it easier to compare similar hosts:
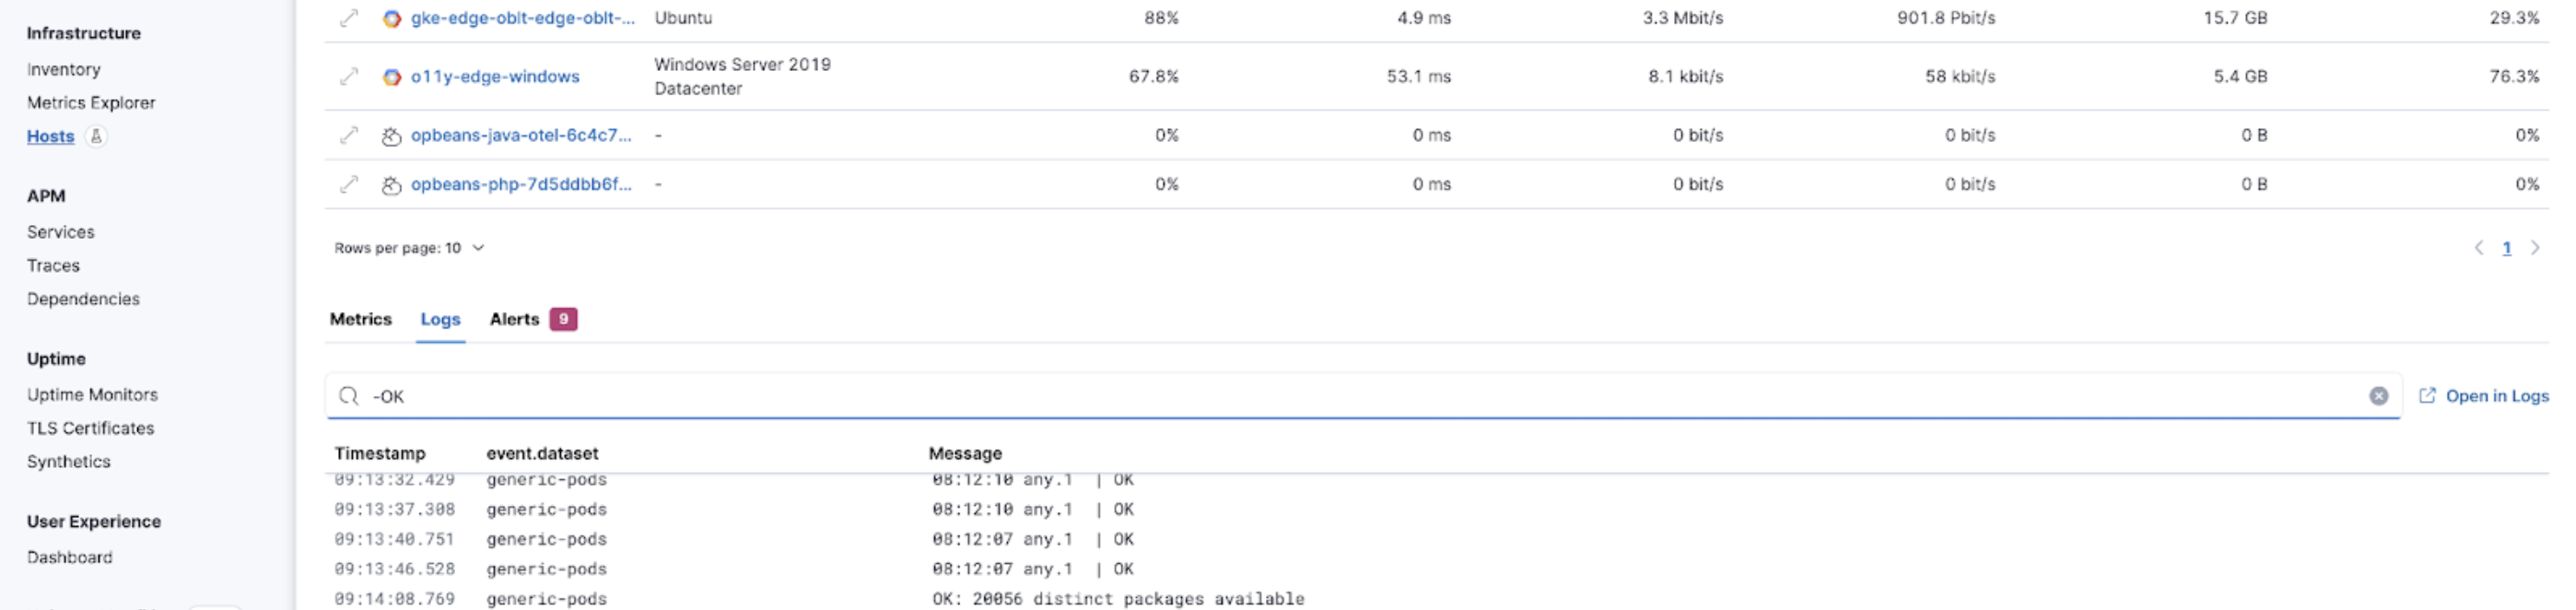
You can also search the logs for your hosts using the new logs tab to find the logs to help you further your investigations:
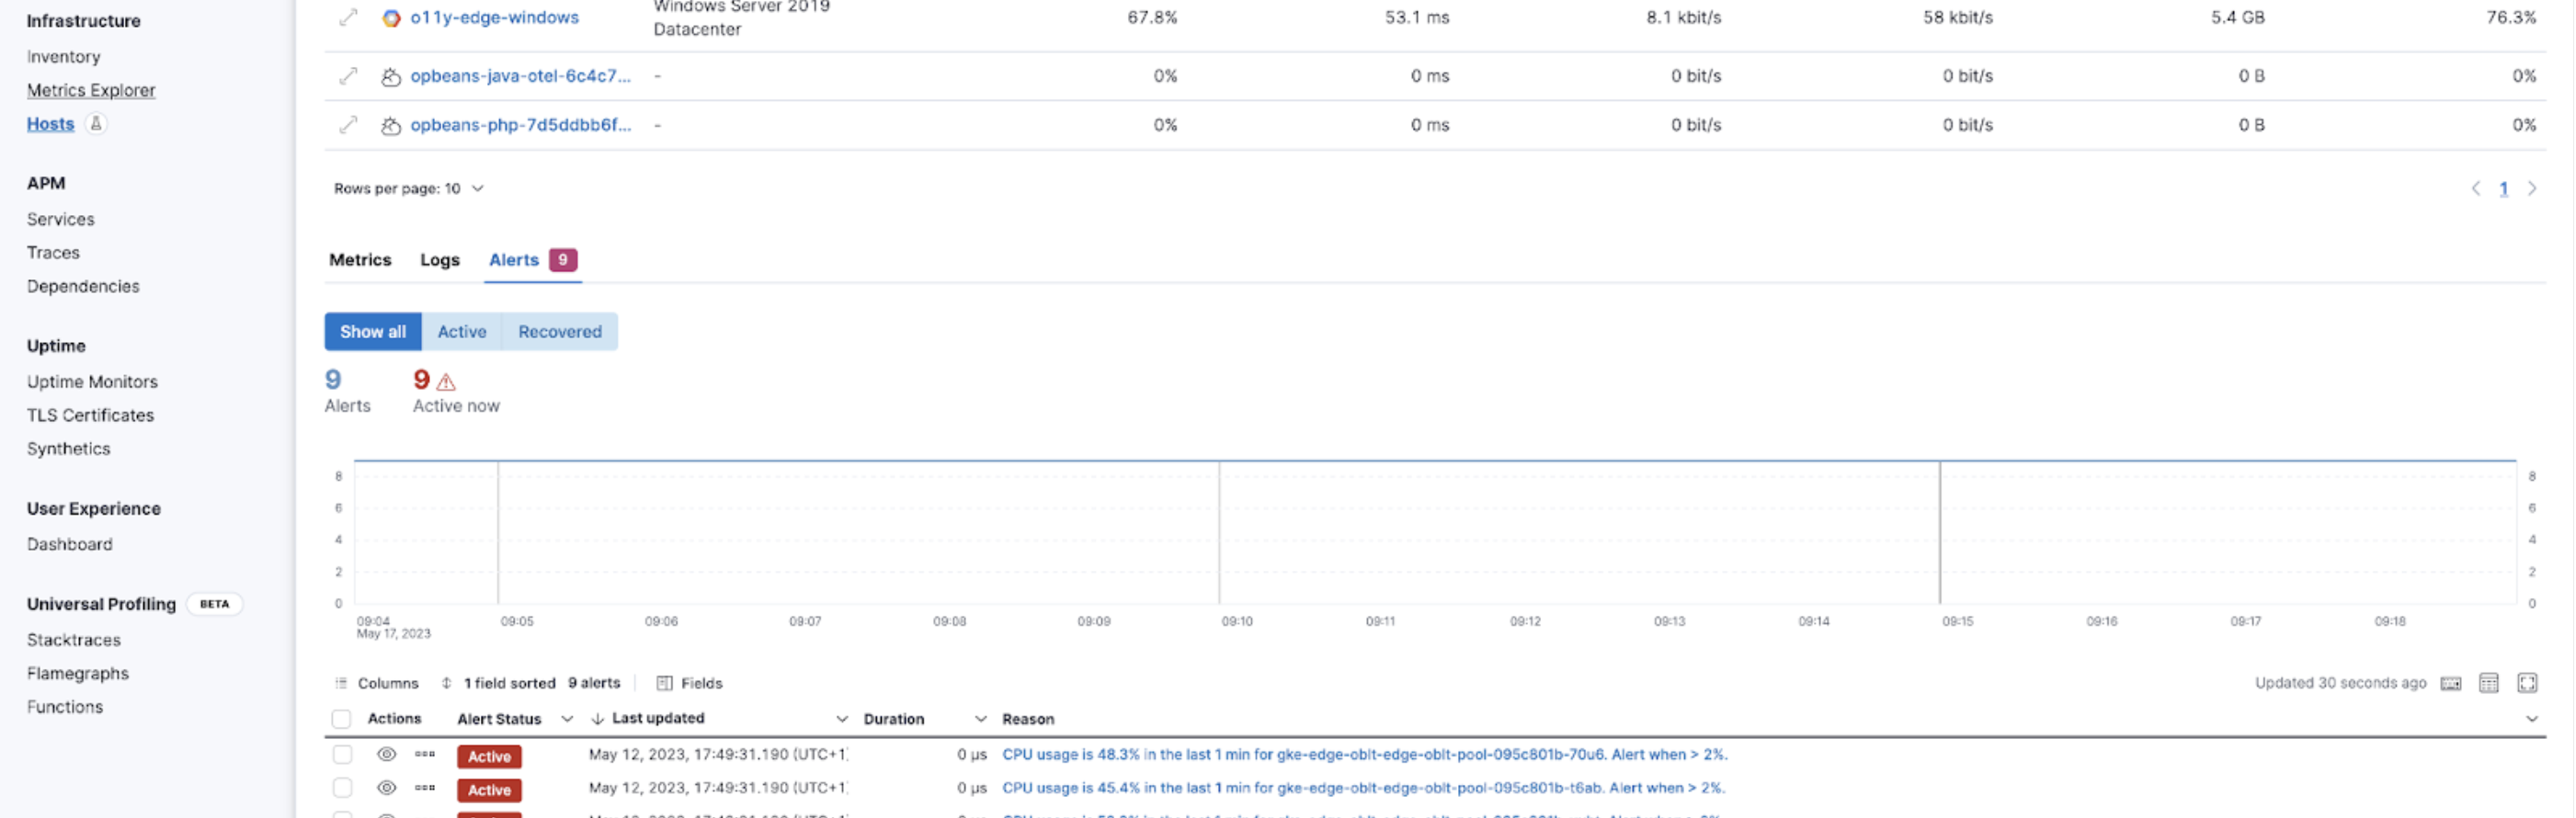
The new alerts tab shows you at a glance if there are any active alerts in your hosts so you can dig into any active issues:
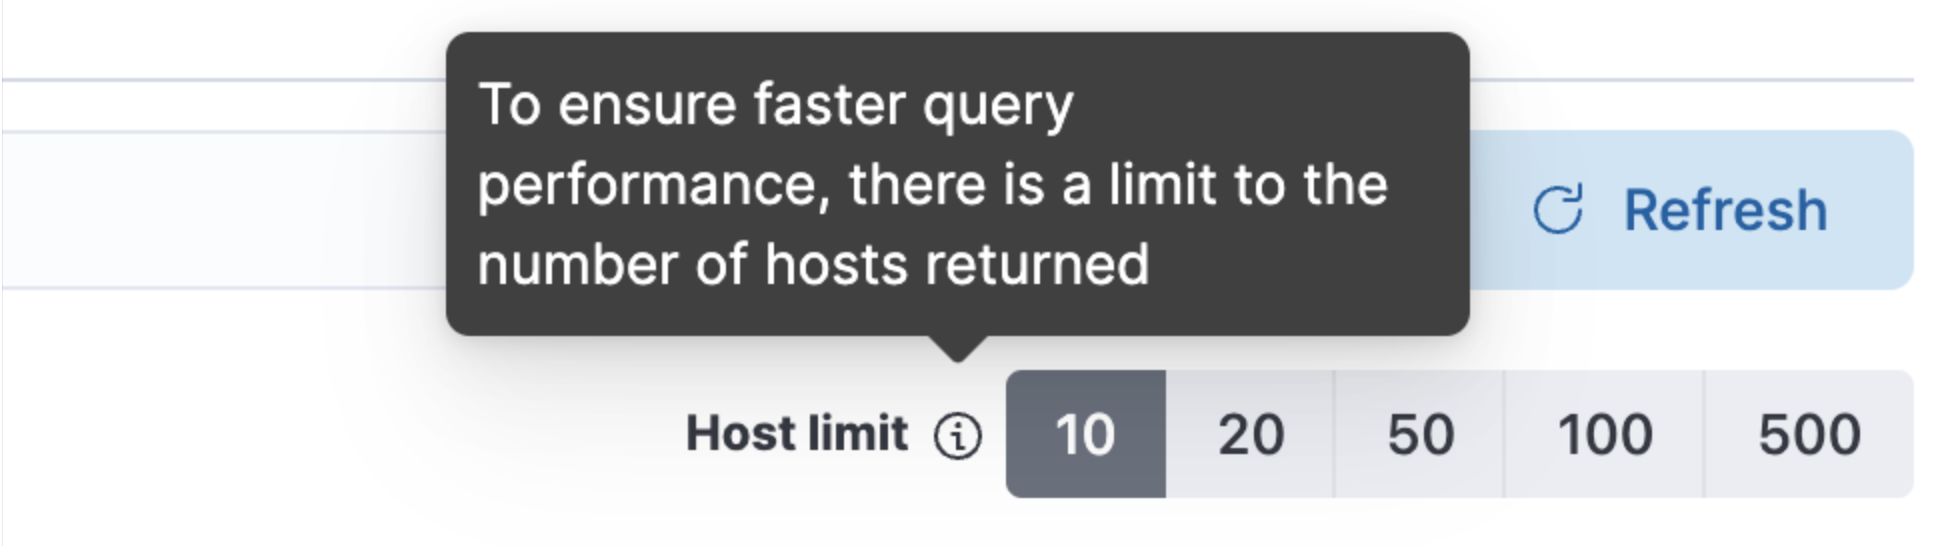
There is also now a host limit to allow you to run quicker queries by limiting the number of hosts being returned in your query so you don’t lose focus in your workflow:
There have also been various UI improvements such as a sticky universal search bar so you can see and manipulate your queries from anywhere on the page and also viewport-based loading of metrics charts to improve the responsiveness of the page.