Analyze and compare hosts on the Hosts page
editAnalyze and compare hosts on the Hosts page
editThe Hosts page provides a metrics-driven view of your infrastructure backed by an easy-to-use interface called Lens. On the Hosts page, you can view health and performance metrics to help you quickly:
- Analyze and compare hosts without having to build new dashboards.
- Identify which hosts trigger the most alerts.
- Troubleshoot and resolve issues quickly.
- View historical data to rule out false alerts and identify root causes.
- Filter and search the data to focus on the hosts you care about the most.
To access this page from the main Kibana menu, go to Observability → Infrastructure, and then click Hosts. If the view is not enabled, click Enable host view to begin exploring.
If there are no metrics to display, Kibana prompts you to add a metrics integration. Click Add a metrics integration to get started.
If you want to add more data in the future, click Add data from any page in the Infrastructure UI.
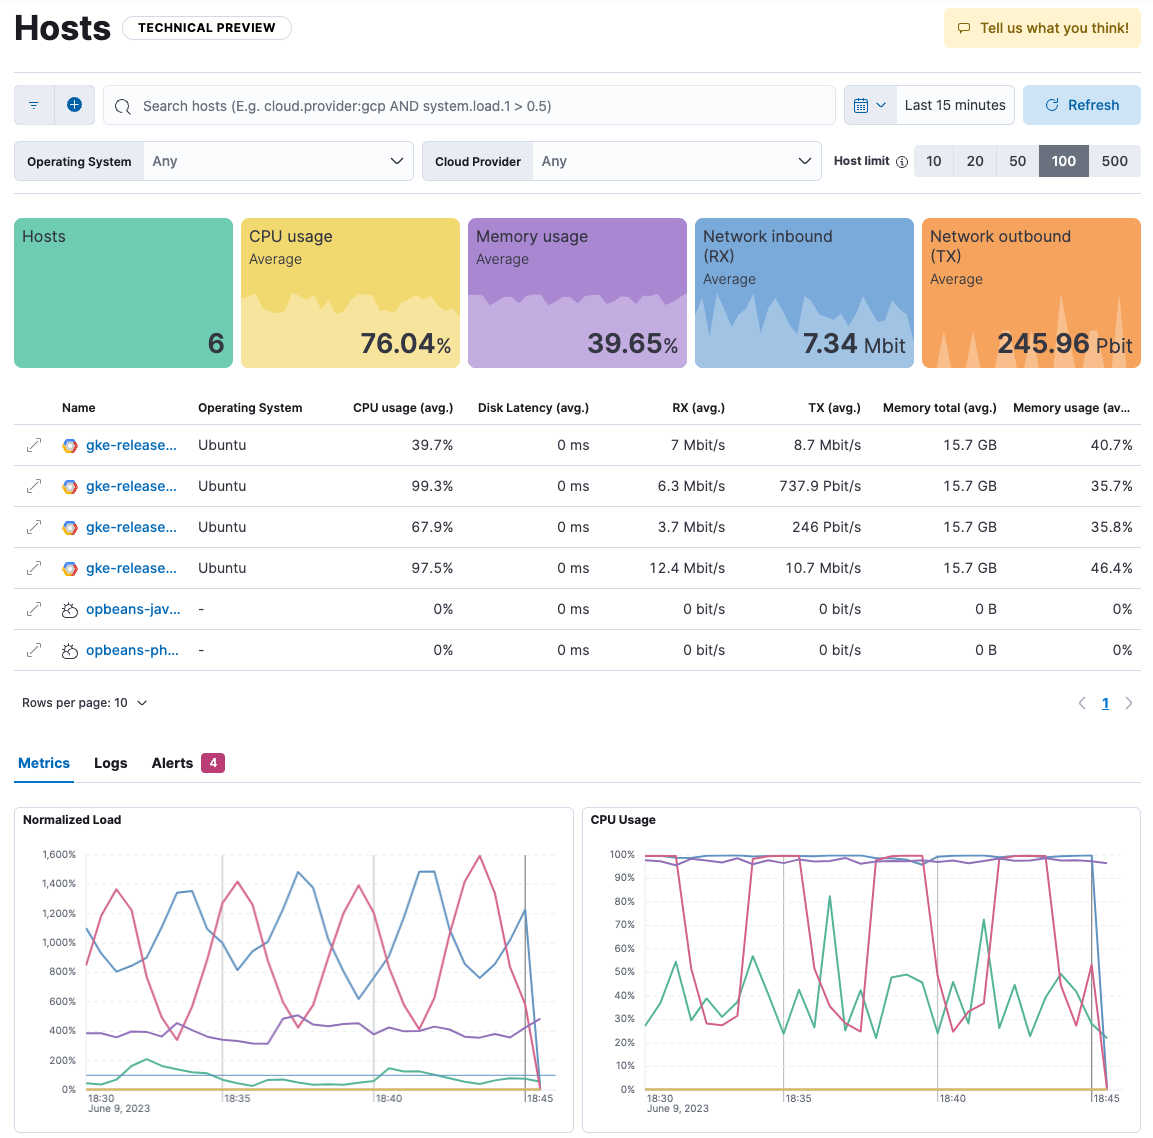
The Hosts page provides a few different ways to view host metrics:
- Overview tiles show the number of hosts returned by your search plus averages of key metrics, including CPU usage, memory usage, and throughput.
- The Host limit controls the maximum number of hosts shown on the page. The default is 20, which means the page shows data for the top 20 hosts based on the most recent timestamps. You can increase the host limit to see data for more hosts, but doing so may impact query performance.
- The Hosts table shows a breakdown of metrics for each host. You may need to page through the list or change the number of rows displayed on each page to see all of your hosts.
- Each host name is an active link to an overview page with additional metrics about the host, such as CPU usage, load, memory usage, and network traffic.
- Table columns are sortable, but note that the sorting behavior is applied to the already returned data set.
- The Metrics view shows metrics trending over time, including normalized load, CPU usage, memory usage, network inbound, network outbound, disk read IOPS, and disk write IOPS. Place your cursor over a line to view metrics at a specific point in time.
For information about how the metrics on this page are calculated, refer to Fields used to populate the Hosts page.
Filter the Hosts view
editThe Hosts page provides several mechanisms for filtering the data on the page:
-
Enter a search query to show metrics that match your search criteria. For example,
to see metrics for hosts running on linux, enter
host.os.type : "linux". Otherwise you’ll see metrics for all your monitored hosts (up to the number of hosts specified by the host limit). -
Select additional criteria to filter the view:
- In the Operating System list, select one or more operating systems and include (or exclude) metrics for those hosts.
- In the Cloud Provider list, select one or more cloud cloud providers to include (or exclude) metrics for the selected cloud providers.
- Change the date range in the Time Picker, or click and drag on a visualization to change the date range.
- In the visualizations under Metrics, click a point on a line and apply filters to set other visualizations on the page to the same time and/or host.
To learn more about filtering data in Kibana, refer to Kibana concepts.
Limitation on filtering by service names
You may see queries where either the expected hosts are not returned, or where returned hosts do not return metrics. This may happen when your filter returns events that do not contain all of the fields and/or values specified within your search.
For example, if you search for service.name : myservice, you will return all hosts where there are events
containing both service.name : myservice and where host.name exists.
You may find that some metrics show as 0 when there are no events which contain both
host.name and service.name : myservice and the metric you are looking for — like system.memory.actual.used.pct for Memory Usage.
You can configure which indices you are searching in the Settings page.
Open in Lens
editMetrics visualizations are powered by Lens, meaning you can continue your analysis in Lens if you require more flexibility. Under Metrics, hover your cursor over a visualization, then click the ellipsis icon in the upper-right corner to open the visualization in Lens.
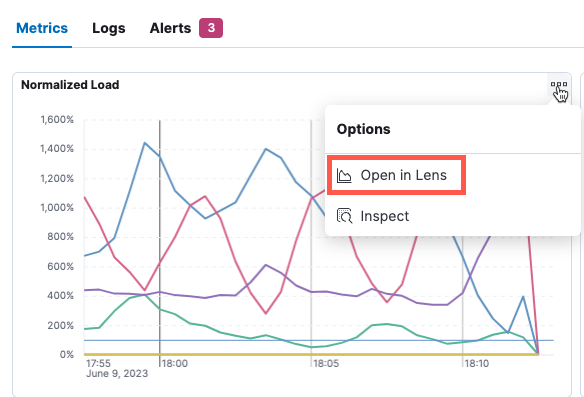
In Lens, you can examine all the fields and formulas used to create the visualization, make modifications to the visualization, and save your changes.
For more information about using Lens, refer to the Kibana documentation about Lens.
Inspect and download metrics
editOn the Metrics tab, you can access a text-based view of the data underlying your metrics visualizations and optionally download the data to a comma-separated (CSV) file.
Hover your cursor over a visualization, then in the upper-right corner, click the ellipsis icon to inspect the data.
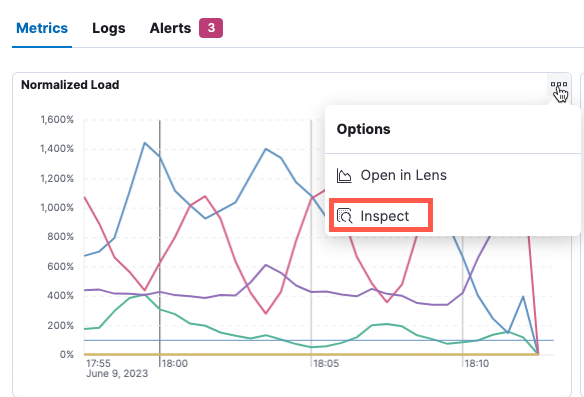
In the flyout, click Download CSV to download formatted or raw data to a CSV file.
Notice that you can change the view to View: Requests to explore the request used to fetch the data and the response returned from Elasticsearch. You can click links to further inspect and analyze the request in the Dev Console or Search Profiler.
View logs
editOn the Logs tab, view logs for the systems you are monitoring and search for specific log entries. This view shows logs for all of the hosts returned by the current query.
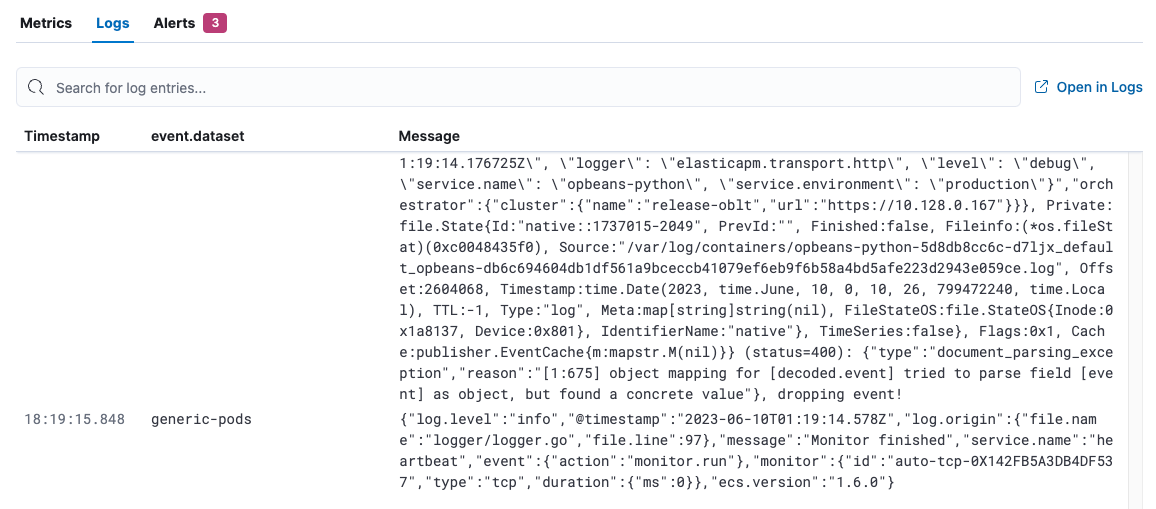
This view uses the log sources and column settings specified in the Logs app. To add log sources or columns (such as host name), refer to Configure data sources.
Click Open in Logs to tail your log files. For more information, refer to Tail log files.
View alerts
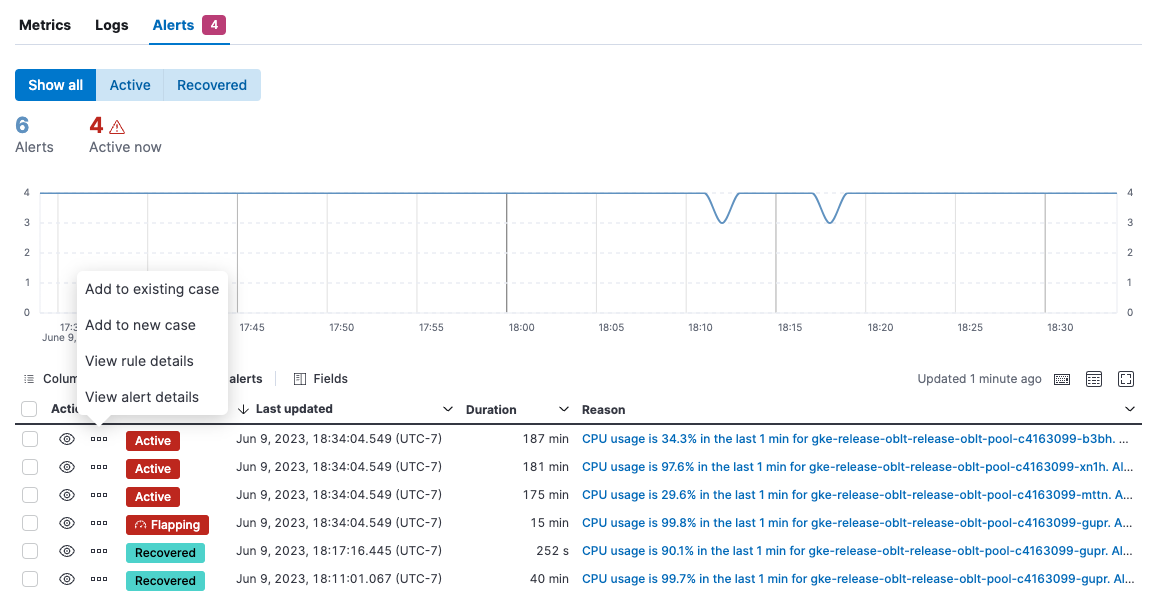
editOn the Alerts tab, view active alerts to pinpoint problems. Use this view to figure out which hosts triggered alerts and identify root causes. This view shows alerts for all of the hosts returned by the current query.
From the Actions menu, you can choose to:
- Add the alert to a new or existing case.
- View rule details.
- View alert details.
Fields used to populate the Hosts page
editThe Hosts page displays metrics from indices that match the index patterns
specified on the Settings page. For example, the default patterns are
metrics-* and metricbeat-*.
Log sources are specified on the Settings page of the Logs app. For example,
the default patterns are logs-*,filebeat-*,kibana_sample_data_logs*.
The following sections describe the fields used to populate the Hosts page with data.
Metrics
edit| Metric | Description |
|---|---|
# of CPUs |
Number of CPU cores Field Calculation: |
CPU Usage |
Percentage of CPU time spent in states other than Idle and IOWait, normalized by the number of CPU cores. This includes both time spent on user space and kernel space. 100% means all CPUs of the host are busy. Field Calculation: |
Disk Latency |
Time spent to service disk requests. Field Calculation: |
Disk Read IOPS |
Average number of bytes read from the device per second. Field Calculation: |
Disk Write IOPS |
Average number of bytes written from the device per second. Field Calculation: |
Memory Total |
Total available memory. Field Calculation: |
Memory Usage |
Percentage of main memory usage excluding page cache. This includes resident memory for all processes plus memory used by the kernel structures and code apart from the page cache. A high level indicates a situation of memory saturation for the host. For example, 100% means the main memory is entirely filled with memory that can’t be reclaimed, except by swapping out. Field Calculation: |
Network Inbound (RX) |
Number of bytes which have been received per second on the public interfaces of the hosts. Field Calculation: |
Network Outbound (TX) |
Number of bytes which have been sent per second on the public interfaces of the hosts. Field Calculation: |
Normalized Load |
1 minute load average normalized by the number of CPU cores. Load average gives an indication of the number of threads that are runnable (either busy running on CPU, waiting to run or waiting for a blocking IO operation to complete). 100% means the 1 minute load average is equal to the number of CPU cores of the host. For example, with a 32 CPU cores host, if 1 min load average is 32, the value reported here is 100%. If 1 min load average is 48, the value reported here is 150%. Field Calculation: |
Fields
edit| Field | Description |
|---|---|
Name |
Name of host. Field Calculation: |
Operating System |
Operating System of host. Field Calculation: |
Cloud Provider |
Cloud Provider host is running on. Field Calculation: |