What’s new in 8.9
editWhat’s new in 8.9
editHere are the highlights of what’s new and improved in 8.9.
Other versions: 8.8 | 8.7 | 8.6 | 8.5 | 8.4 | 8.3 | 8.2 | 8.1 | 8.0 | 7.17
Introducing Elastic AI Assistant use cases for Observability
edit[preview] This functionality is in technical preview and may be changed or removed in a future release. Elastic will work to fix any issues, but features in technical preview are not subject to the support SLA of official GA features. Elastic Observability is excited to announce the initial (technical preview) release of the Elastic AI Assistant for Observability. Key observability workflows have been enhanced with generative AI (GAI) to help improve troubleshooting processes and provide automated explanations for information that is not easily understood. This will lead to better root cause analysis and improved MTTx.
Elastic AI Assistant for Observability is incorporating generative AI in the following user workflows:
-
Elastic AI Assistant for log message: Provides the ability to use generative AI to look up the meaning of the log message details and help you find related messages.
-
Elastic AI Assistant for APM errors: Provides the ability to explain an error or stack trace in APM and suggest remediations.
-
Elastic AI Assistant for log alerts: Provides the ability to use machine learning (ML) to explain what caused the spike in log messages and to use that information with generative AI to provide potential root cause and remediation steps.
-
Elastic AI Assistant for host processes: Provides the ability to get details on a process and how to optimize the process for resources like CPU or memory.
-
Elastic AI Assistant for profiling: Provides the ability to explain the most expensive processes/functions in your organization and suggest optimizations — the AI assistant can use generative AI to explain any function and provide details on how to optimize the function.
All of the Elastic AI Assistant use cases mentioned above will be provided in 8.9 as a technical preview with the exception of log alerts (due to ML licensing requirements).
This feature is available by configuring the Elastic AI Assistant, selecting the model, and entering in your credentials. Initially we will be supporting Azure OpenAI and OpenAI.
Ready to get started? See the documentation. Here’s a quick overview of the process:
- Ensure you have an API key for OpenAI or Azure OpenAI Service.
-
Edit your
kibana.yamlfile (either for self-managed or Elastic Cloud deployments) with one of the following configurations:OpenAI:
xpack.observability.aiAssistant.enabled: true
xpack.observability.aiAssistant.provider.openAI.apiKey: <insert API key>
xpack.observability.aiAssistant.provider.openAI.model: <insert model name, e.g. gpt-4>
Azure OpenAIService:
xpack.observability.aiAssistant.enabled: true
xpack.observability.aiAssistant.provider.azureOpenAI.deploymentId: <insert deployment ID>
xpack.observability.aiAssistant.provider.azureOpenAI.resourceName: <insert resource name>
xpack.observability.aiAssistant.provider.azureOpenAI.apiKey: <insert API key>
Read more about Elastic Observability GAI support in the following blogs:
Collect metrics from linked Amazon CloudWatch accounts
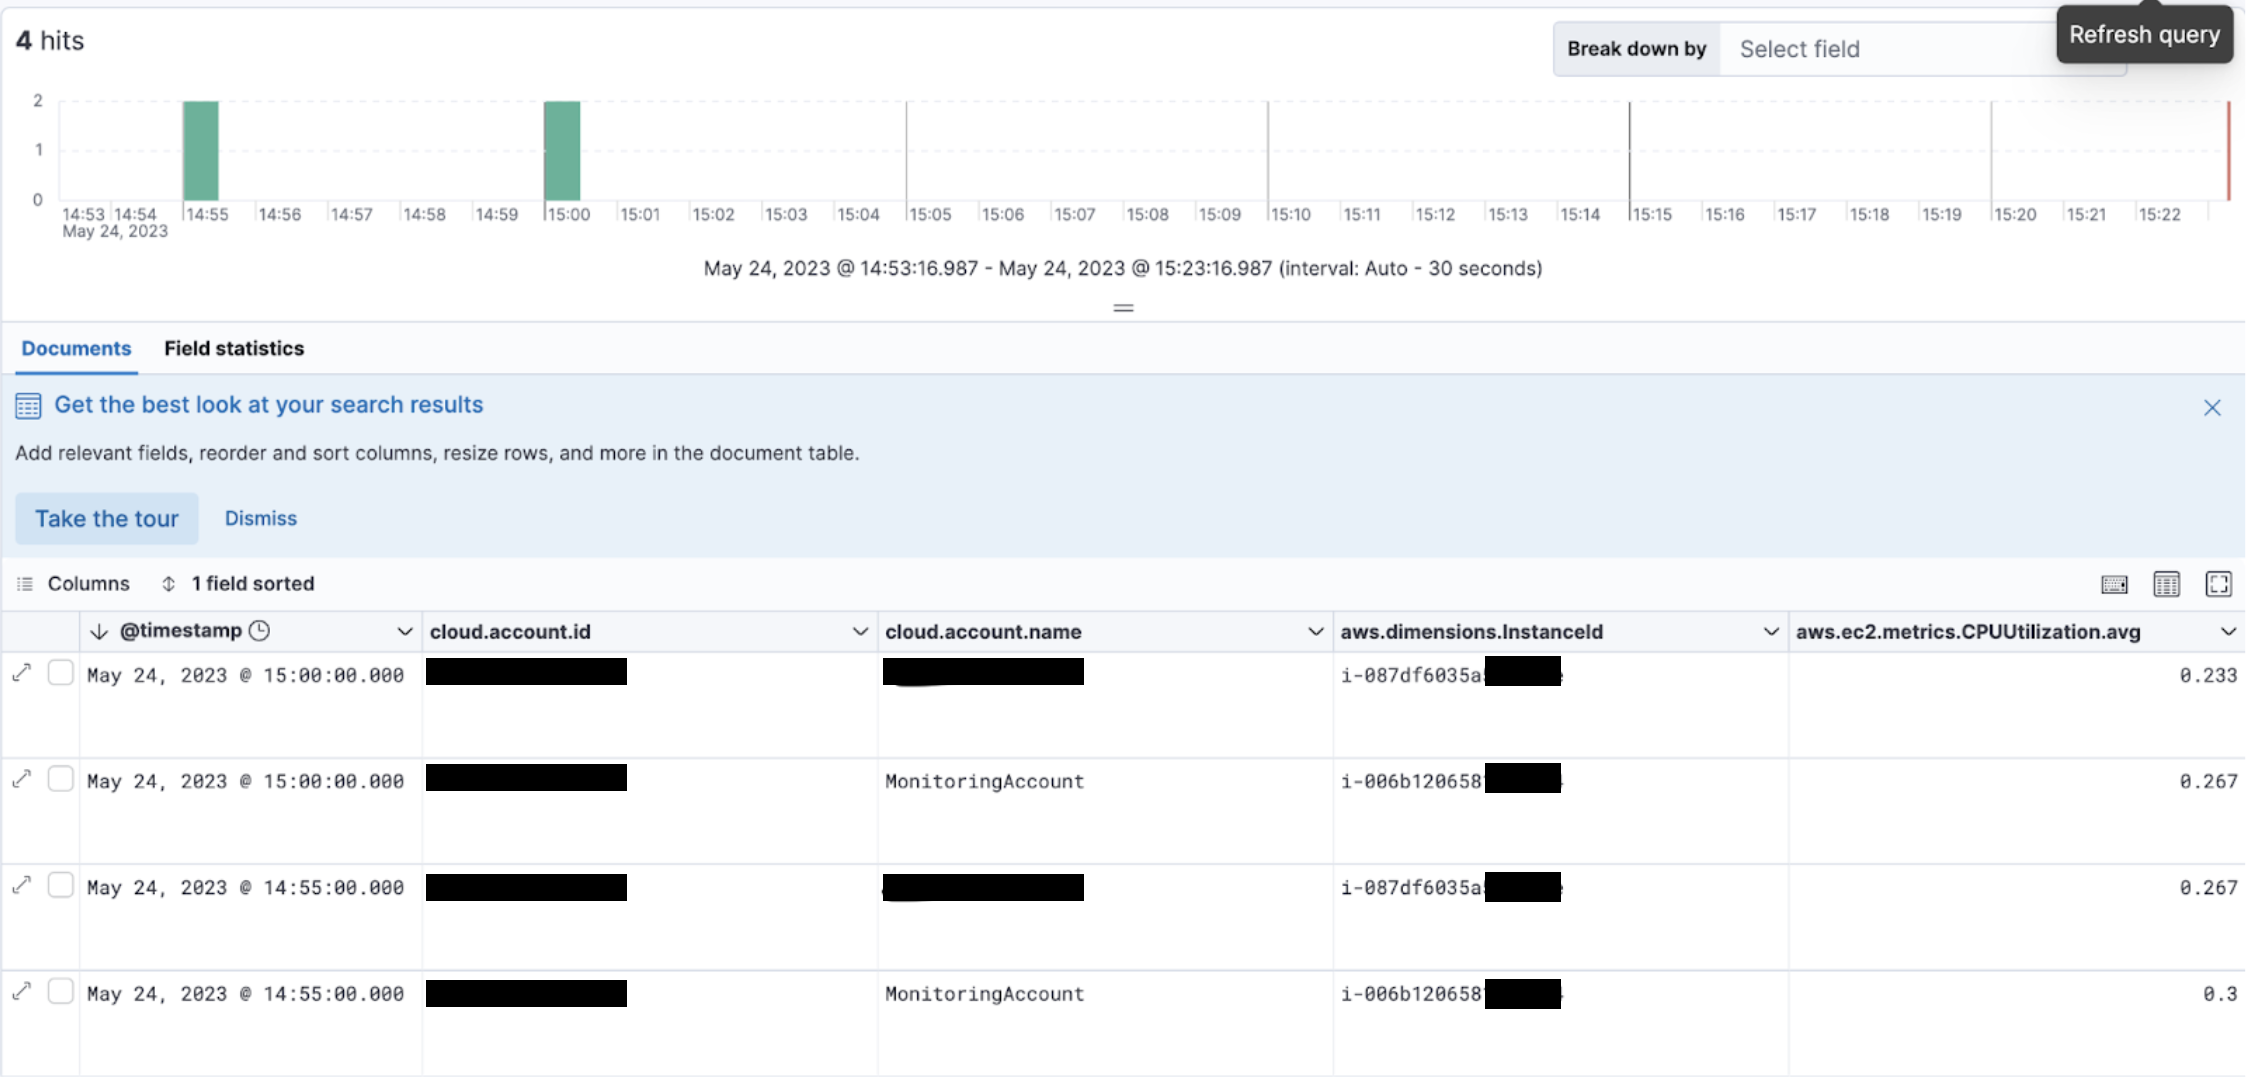
editAmazon CloudWatch support for cross-account monitoring enables Cloudwatch customers to set up a single monitoring account that can access Cloudwatch metrics from multiple other sharing accounts. We have enhanced our AWS integration to support cross-account metrics. When enabled, metrics from the monitoring account and the shared accounts are included. To include metrics from linked sharing accounts, the IncludeLinkedAccounts parameter must be included in our ListMetrics API calls. The resulting response contains metrics for the shared accounts and the monitoring account. The owning account is also listed for each returned metric, which will allow us to ensure that cloud.account.id is correct on all reported metrics.
To learn more about the IncludeLinkedAccounts parameter, see the AWS integration documentation.
Hosts available in Beta
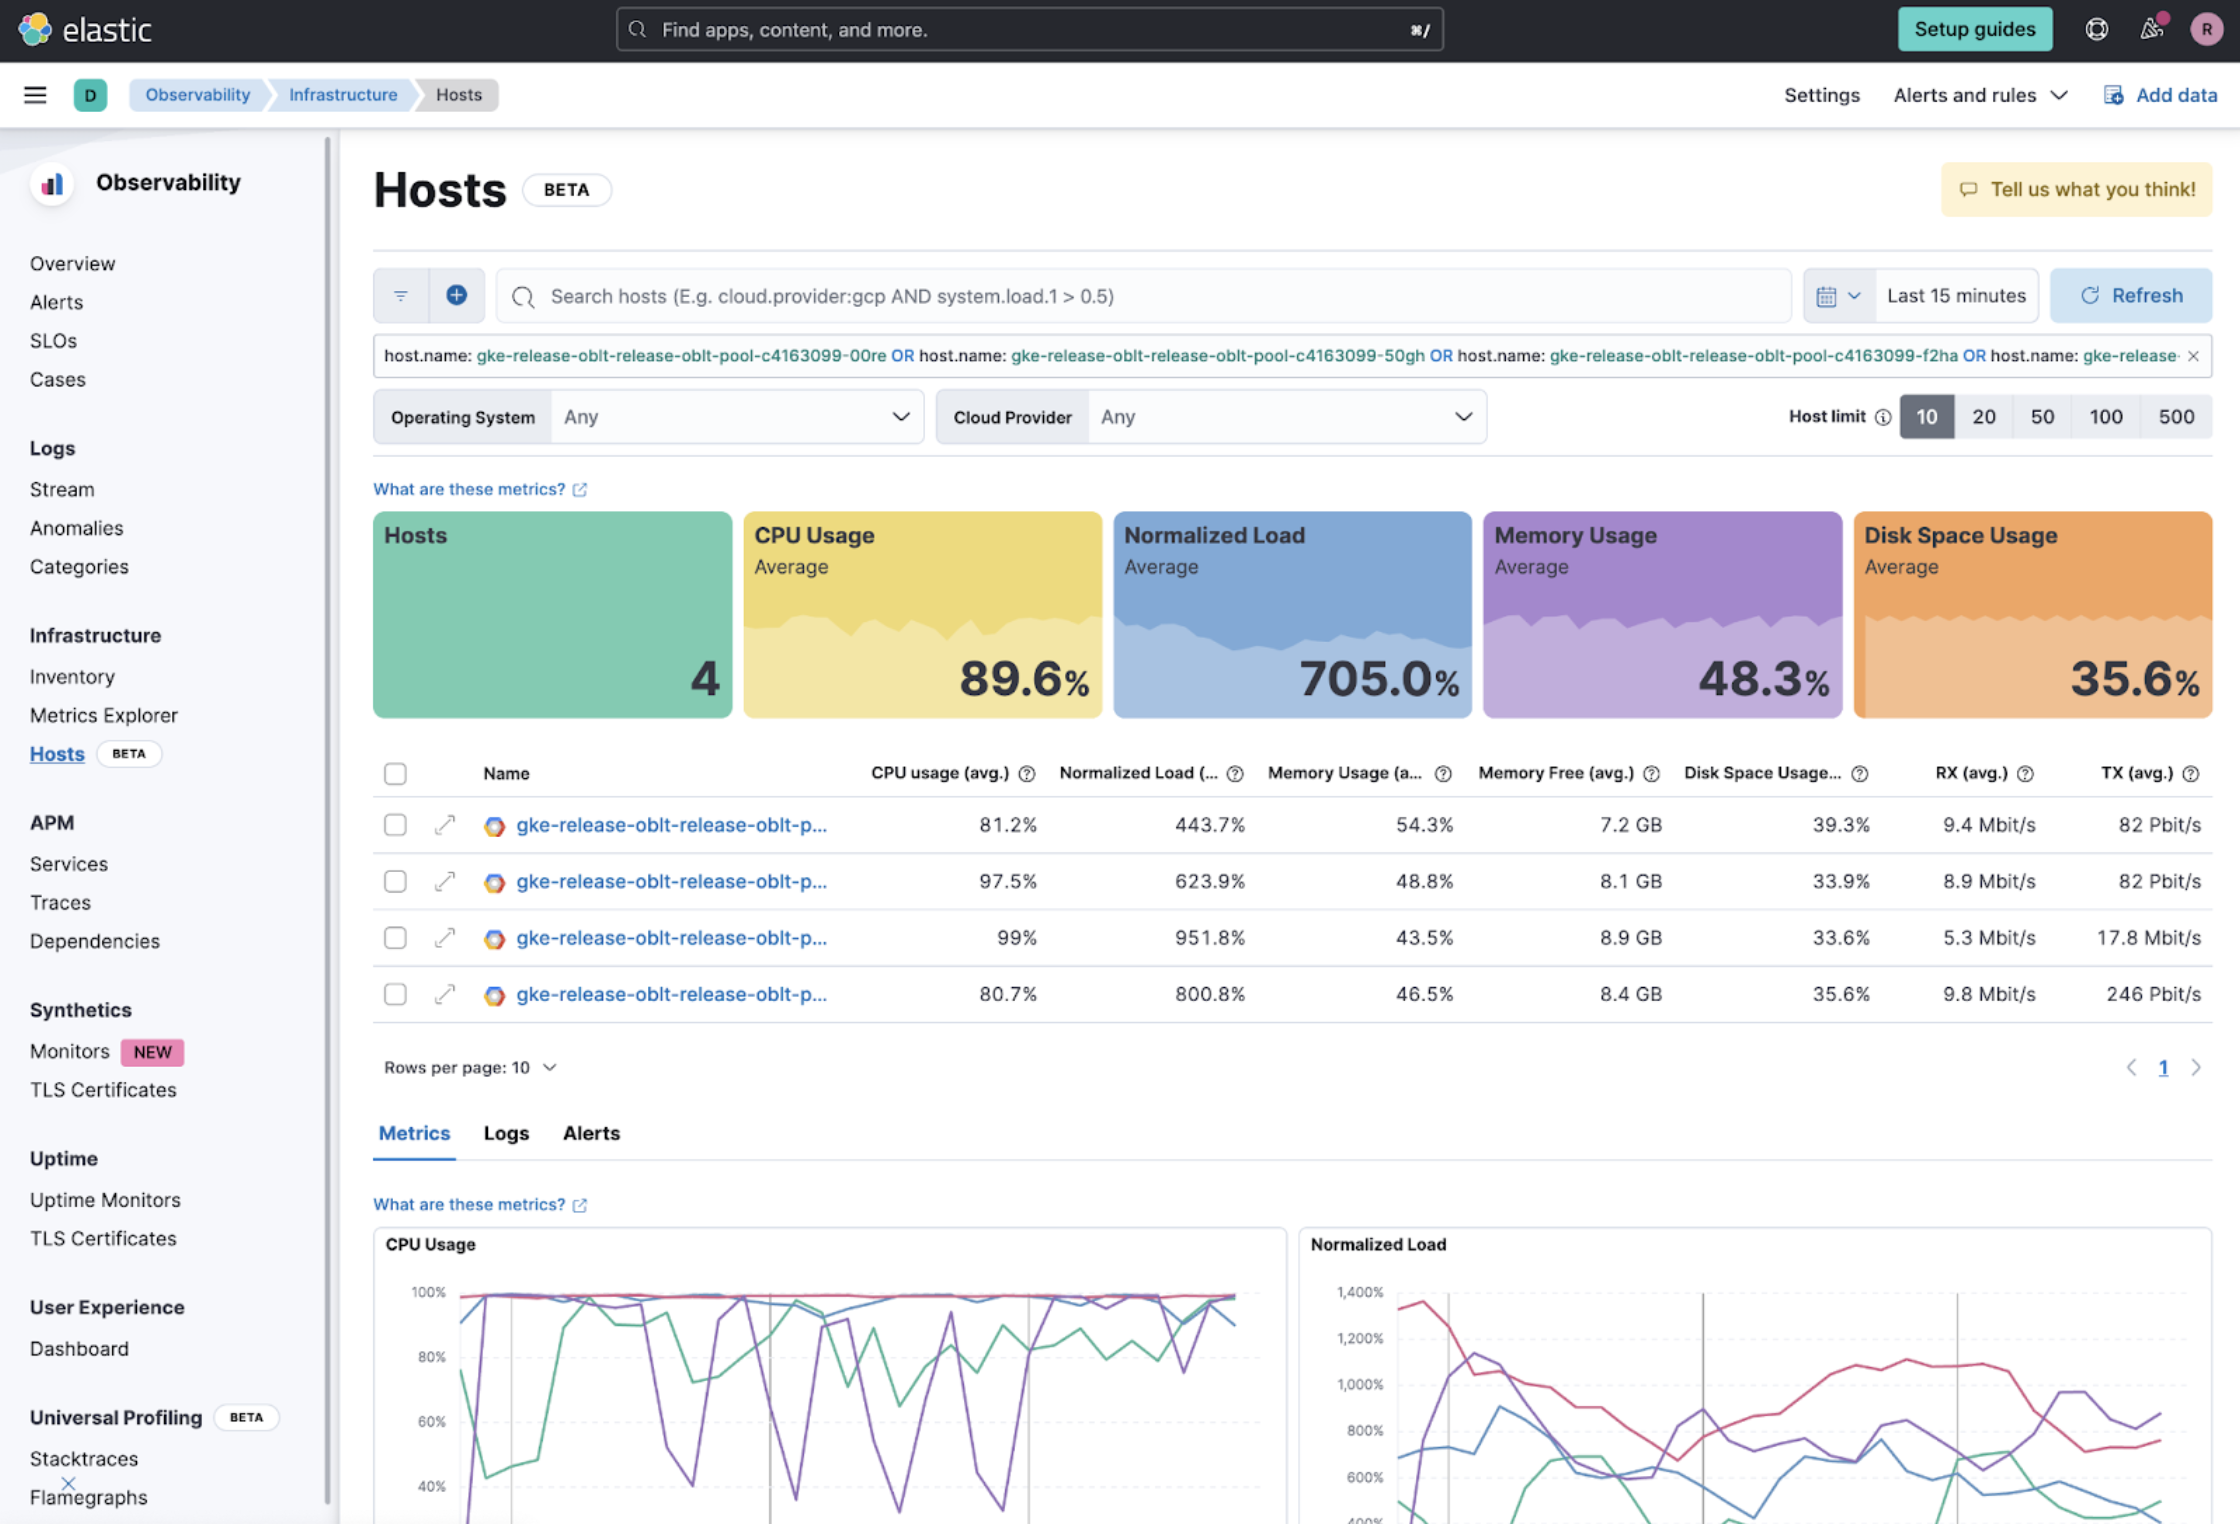
edit[beta] This functionality is in beta and is subject to change. The design and code is less mature than official GA features and is being provided as-is with no warranties. Beta features are not subject to the support SLA of official GA features. The Hosts page is now available in beta to all customers.
The Hosts page provides a metrics-driven view of your infrastructure backed by an easy-to-use interface called Lens. On the Hosts page, you can view health and performance metrics to help you quickly:
Analyze and compare hosts without having to build new dashboards. Identify which hosts trigger the most alerts. Troubleshoot and resolve issues quickly. View historical data to rule out false alerts and identify root causes. Filter and search the data to focus on the hosts you care about the most.
Analyze the storage footprint of your APM data with storage explorer
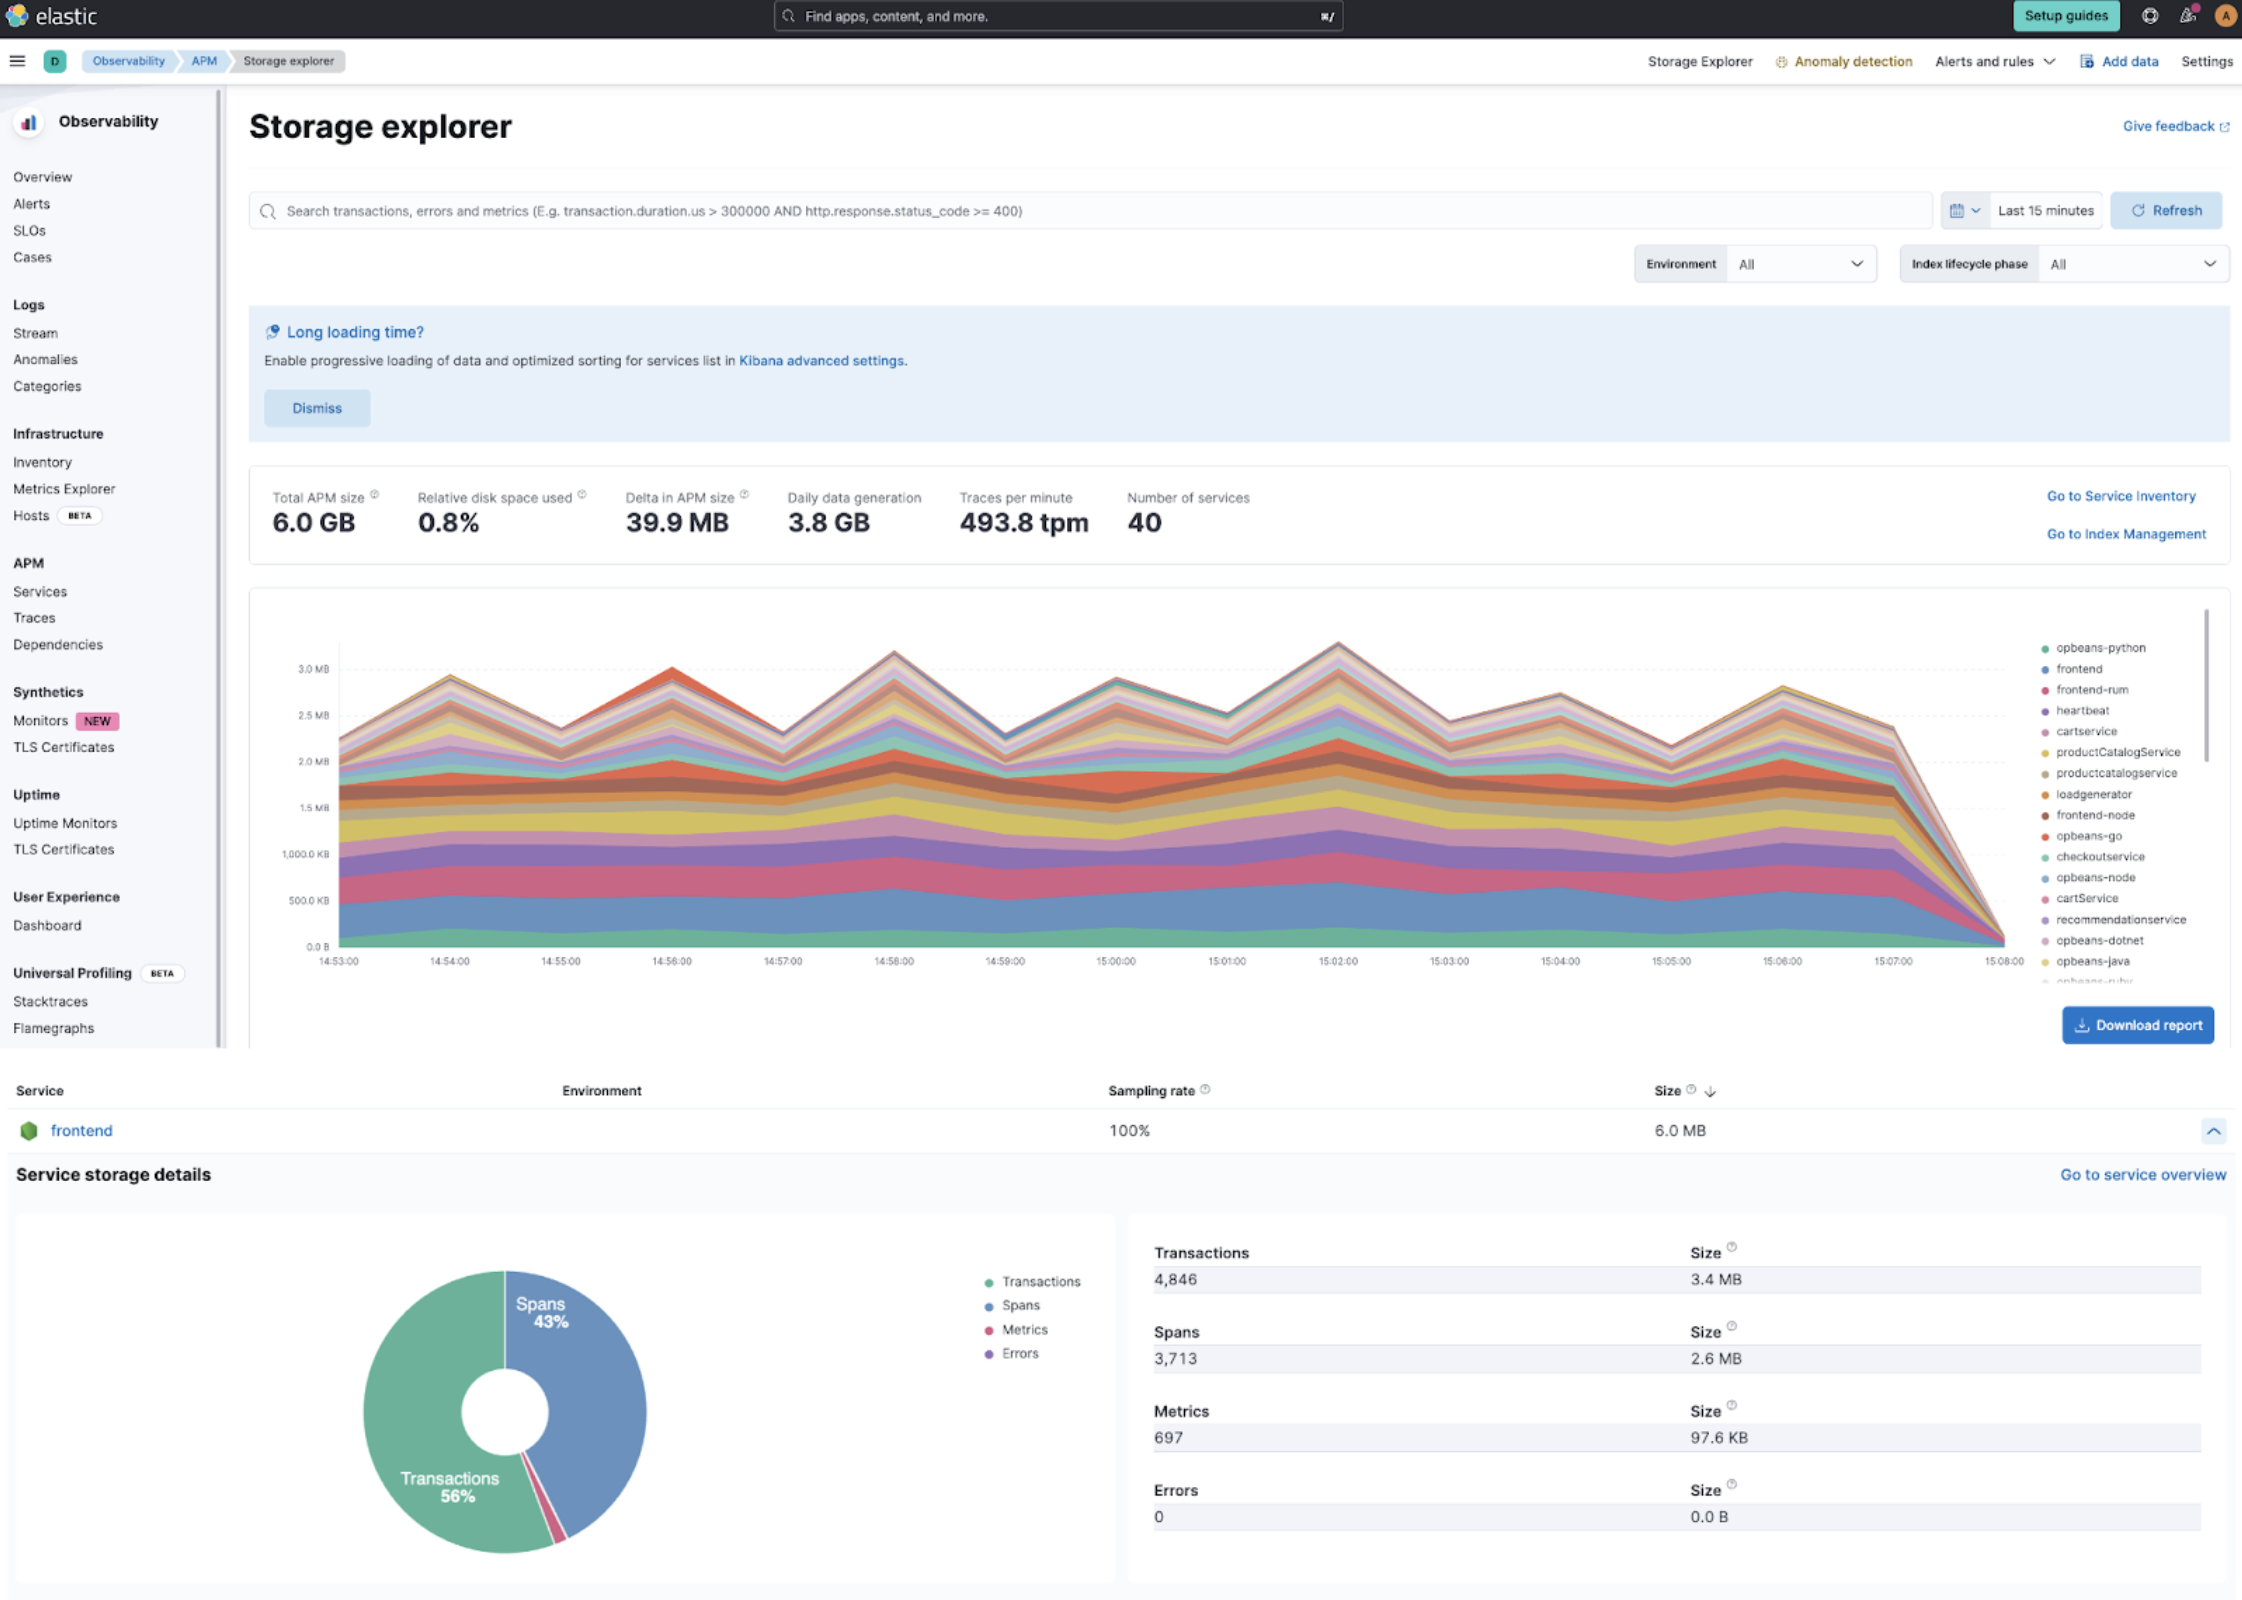
editWith Elastic Observability 8.9, APM Storage Explorer is now Generally Available. Storage explorer enables you to view the total and relative storage footprint of APM documents for each instrumented service. This provides visibility into the storage impact of configuration changes such as sampling rates, and will help you to improve storage requirement forecasts.
Learn more in the docs.
Unlock up to 70% metrics storage savings with TSDS enabled integrations
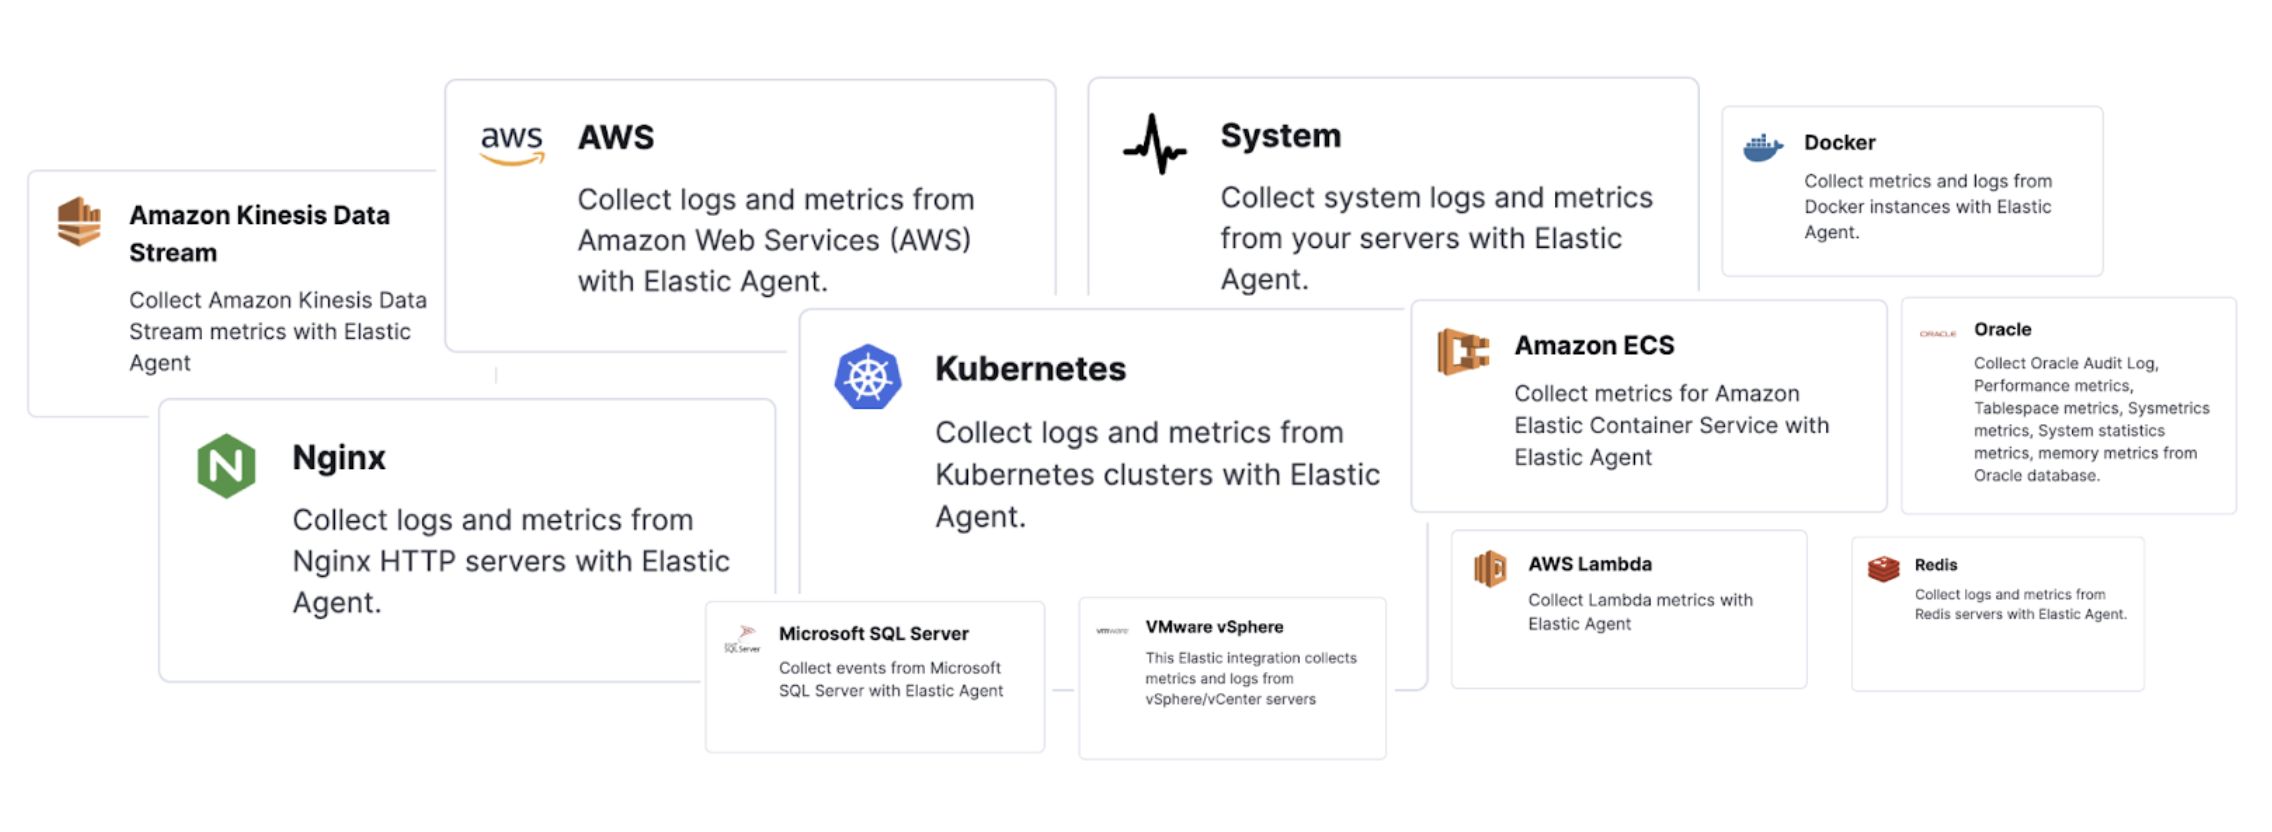
editThe latest versions of Elastic Observability’s most popular observability integrations now use the storage cost-efficient time series index mode for metrics by default. Kubernetes, Nginx, System, AWS, Azure, RabbitMQ, Redis, and more popular Elastic Observability integrations are time series data stream (TSDS) enabled integrations.
Elastic released the time series data stream functionality to GA in 8.7. Elastic time series data stream (TSDS) stores metrics in indices optimized for a time series database (TSDB), which is optimized to store time series metrics.
When using the TSDS-enabled version for an integration collecting metrics, the benefits that you can realize are the following:
- Up to 70% less disk space: With TSDS seamlessly enabled in the integration for your platforms, you can enjoy up to a significant 70% reduction in disk storage for your metrics data. This reduction translates to cost savings and increased scalability for your infrastructure.
- Streamlined data management: TSDS simplifies the storage and retrieval of your time stamped metrics data, making it effortless to organize and analyze your valuable insights.
- Out-of-the-box functionality: Thanks to the native integration of TSDS, you can leverage its powerful features without any user input or additional configuration. The integration seamlessly optimizes storage efficiency for your metrics data, allowing you to focus on deriving meaningful insights.
For more information, or to learn how to do this in Kibana, read our blog post.
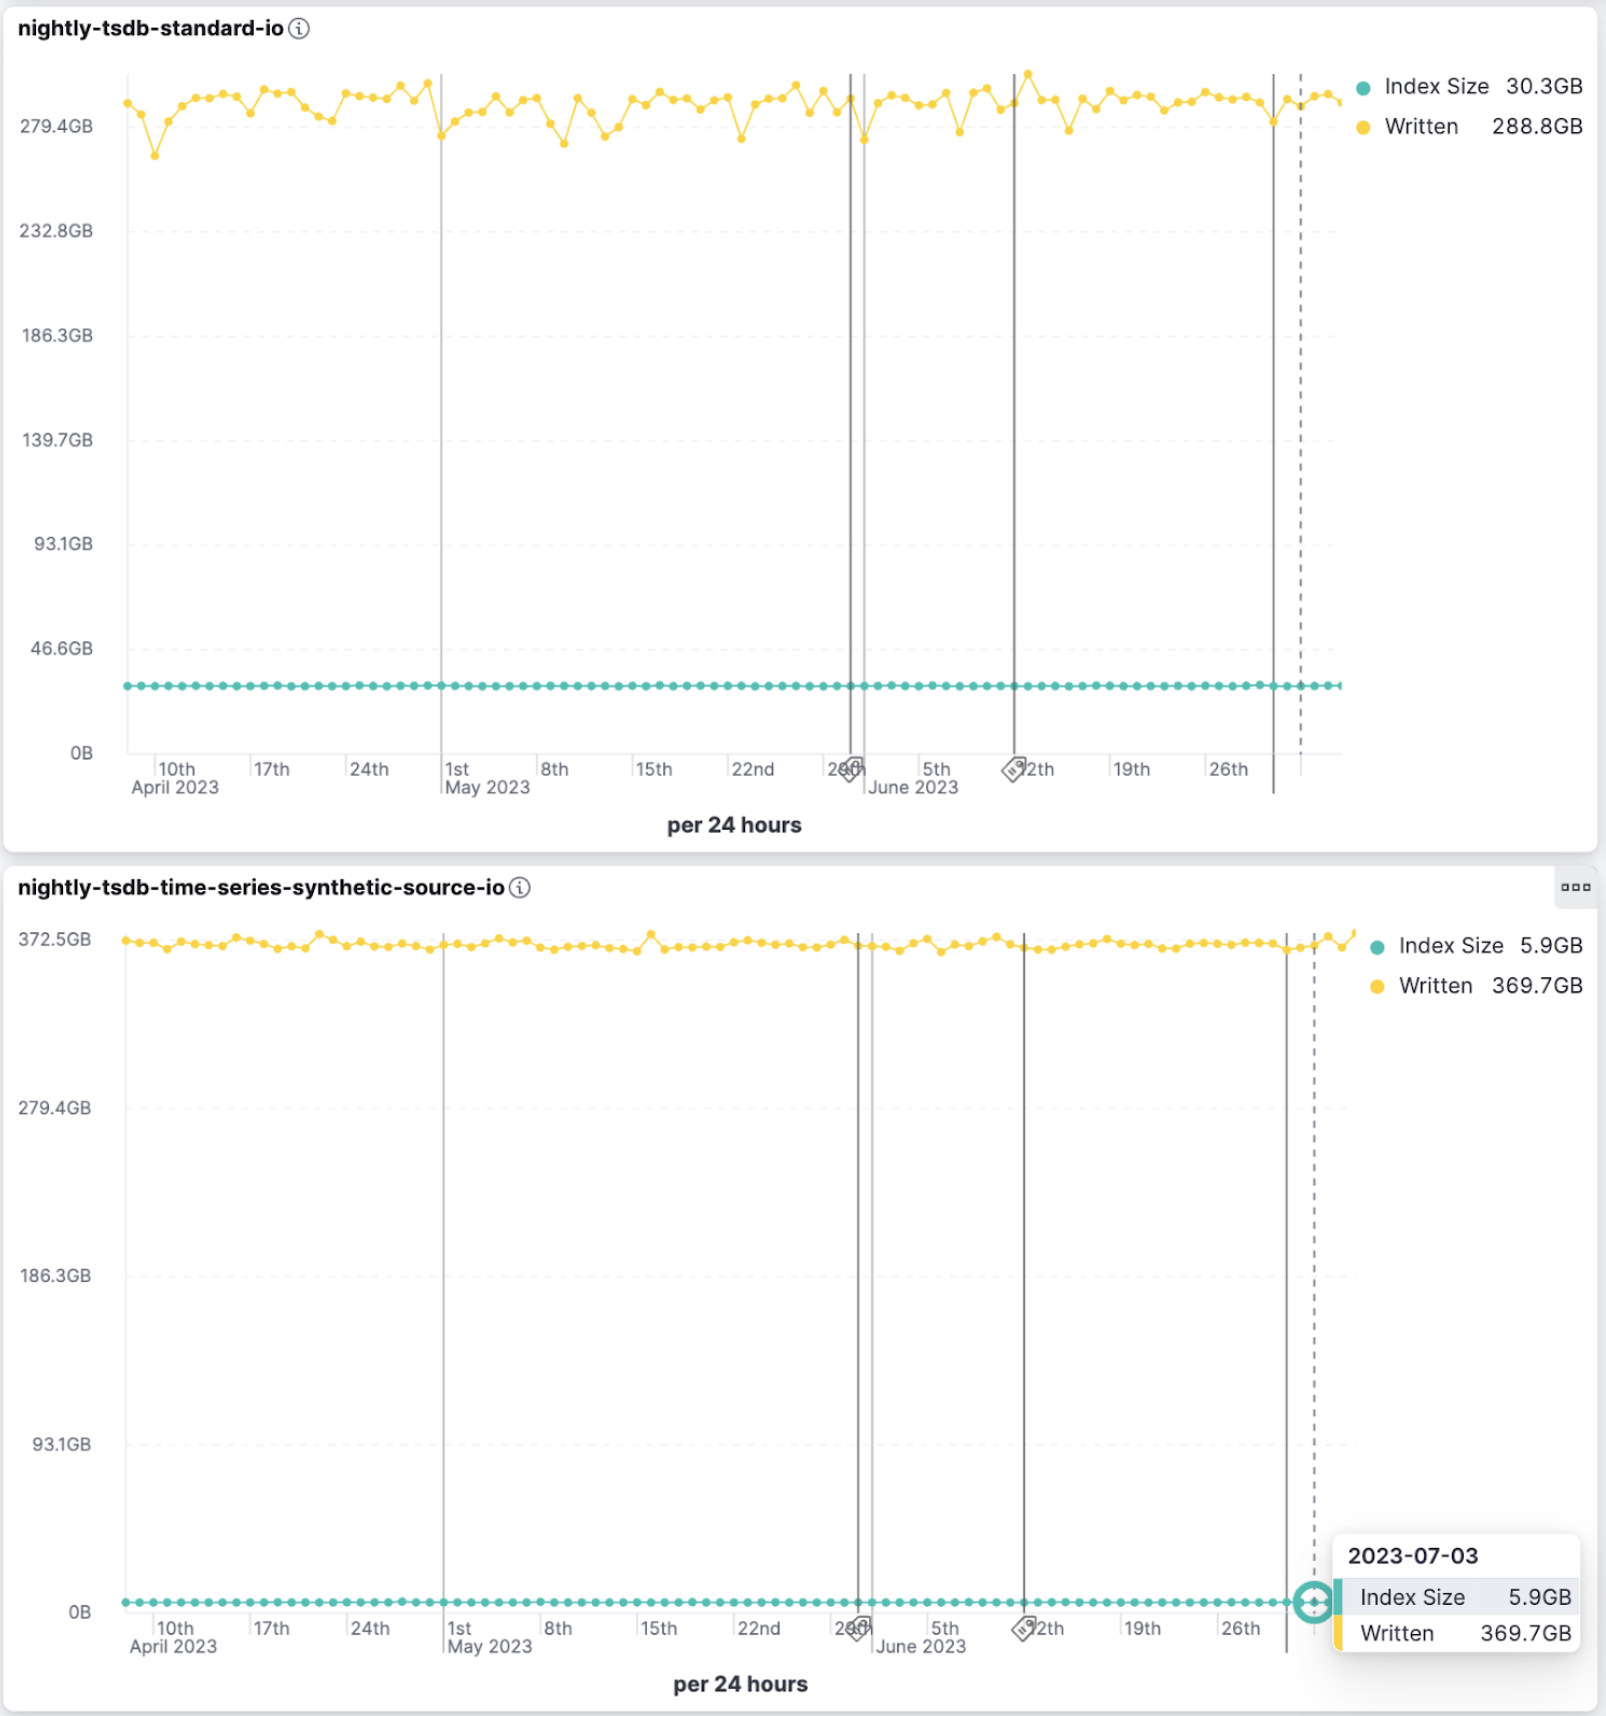
Index size comparison for metrics stored using standard (30.4GB) vs time series (5.9GB) mode
Rules as code
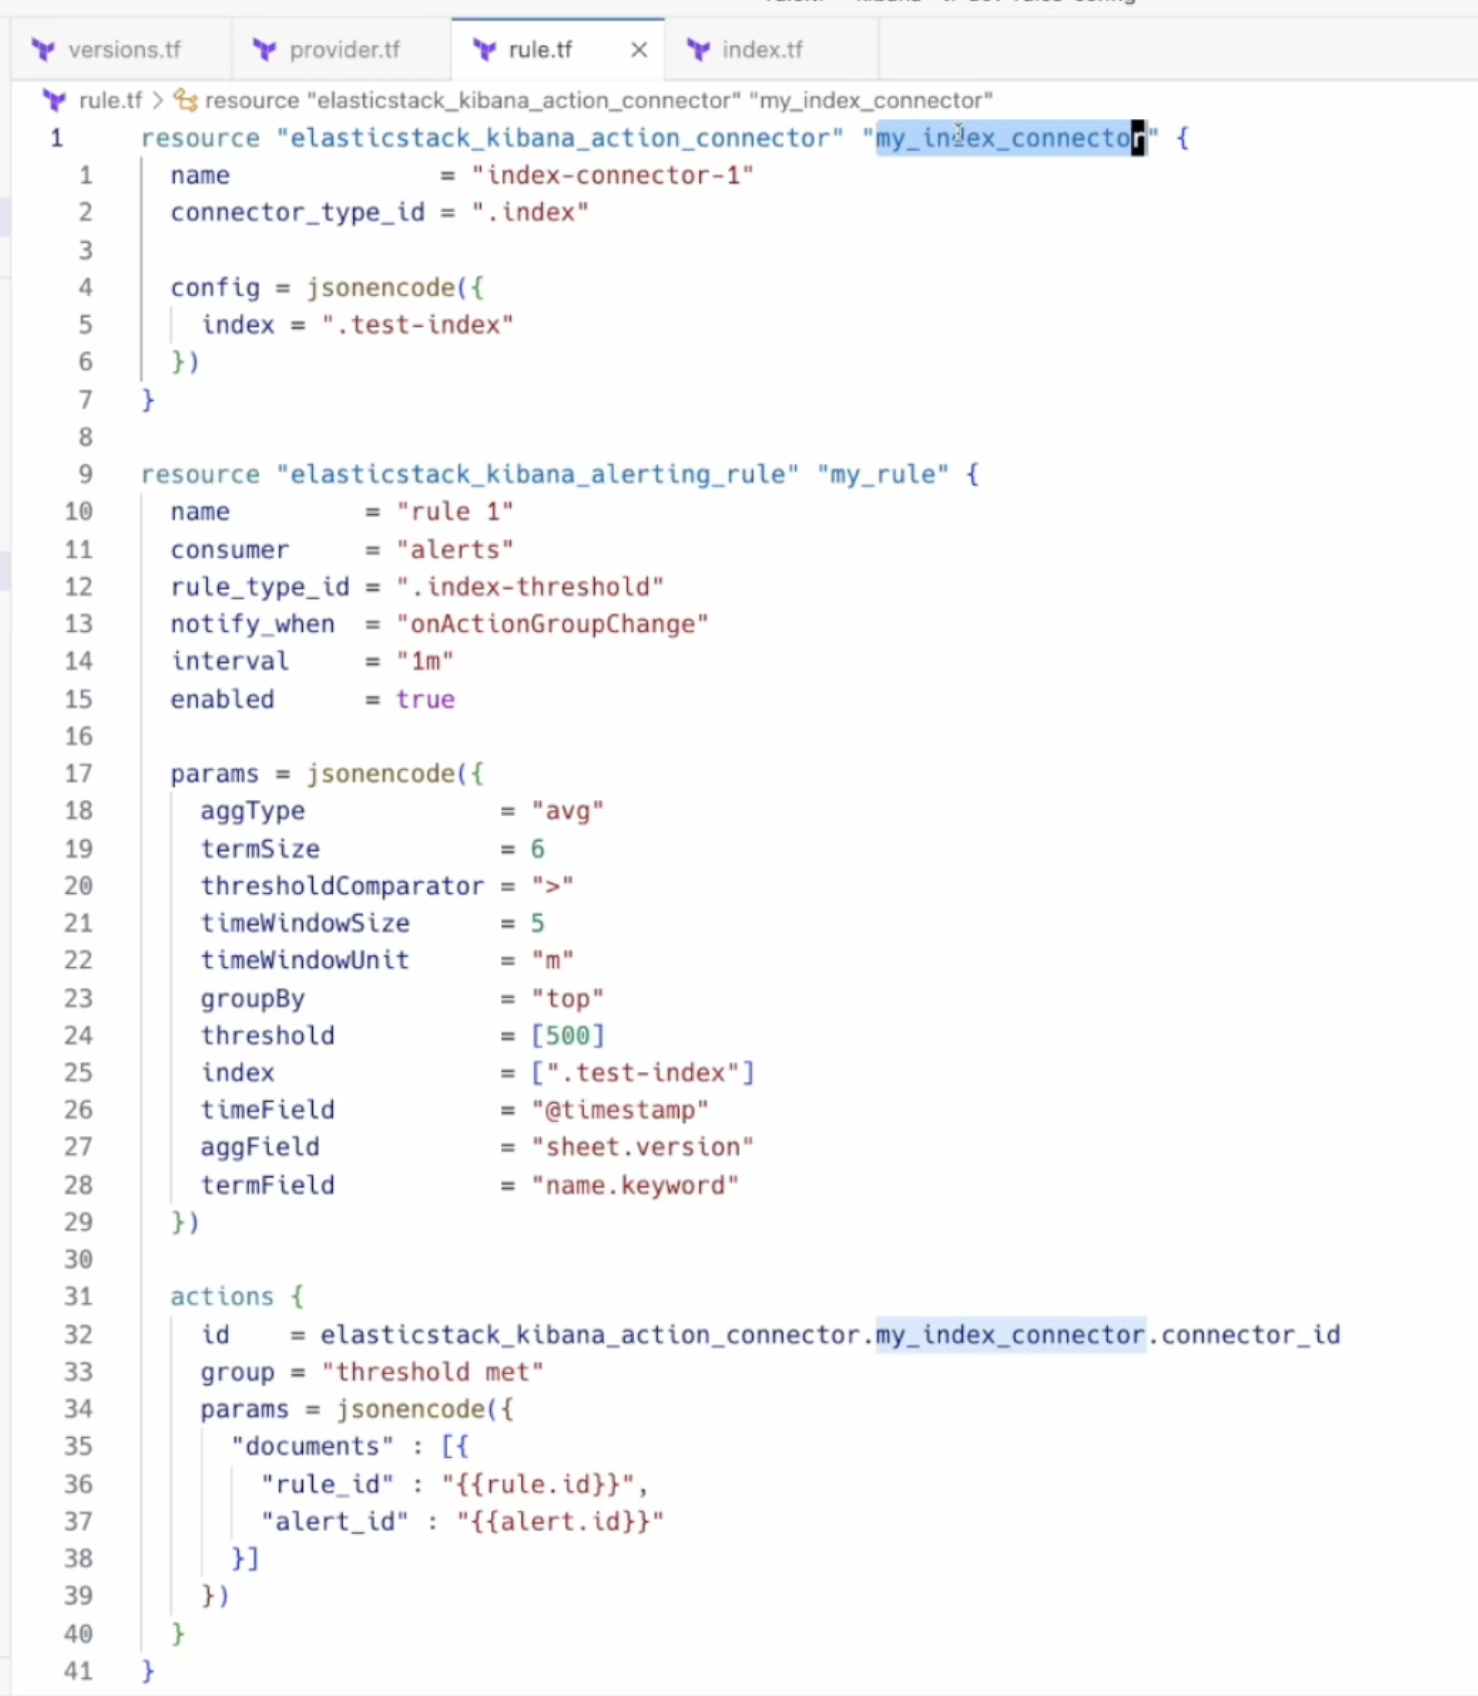
editThe Terraform Elastic Stack provider is released with a new capability that allows users to manage their alerting rules and connectors within Kibana. This empowers users to automate manual processes, manage multiple clusters from a single place, and unlock more use cases like version control.
Enhancing Service Level Objectives with Multi-window burn rates & custom metrics
editStarting in 8.9, the SLO burn rate rule allows you to set multi-window burn rates, which provide a powerful way to implement SLO-based alerting. The SLO alert rule can use multiple burn rates and time windows, and fire alerts when burn rates surpass a specified threshold. This option retains the benefits of alerting on burn rates and provides a method to make sure lower error rates will not be overlooked.
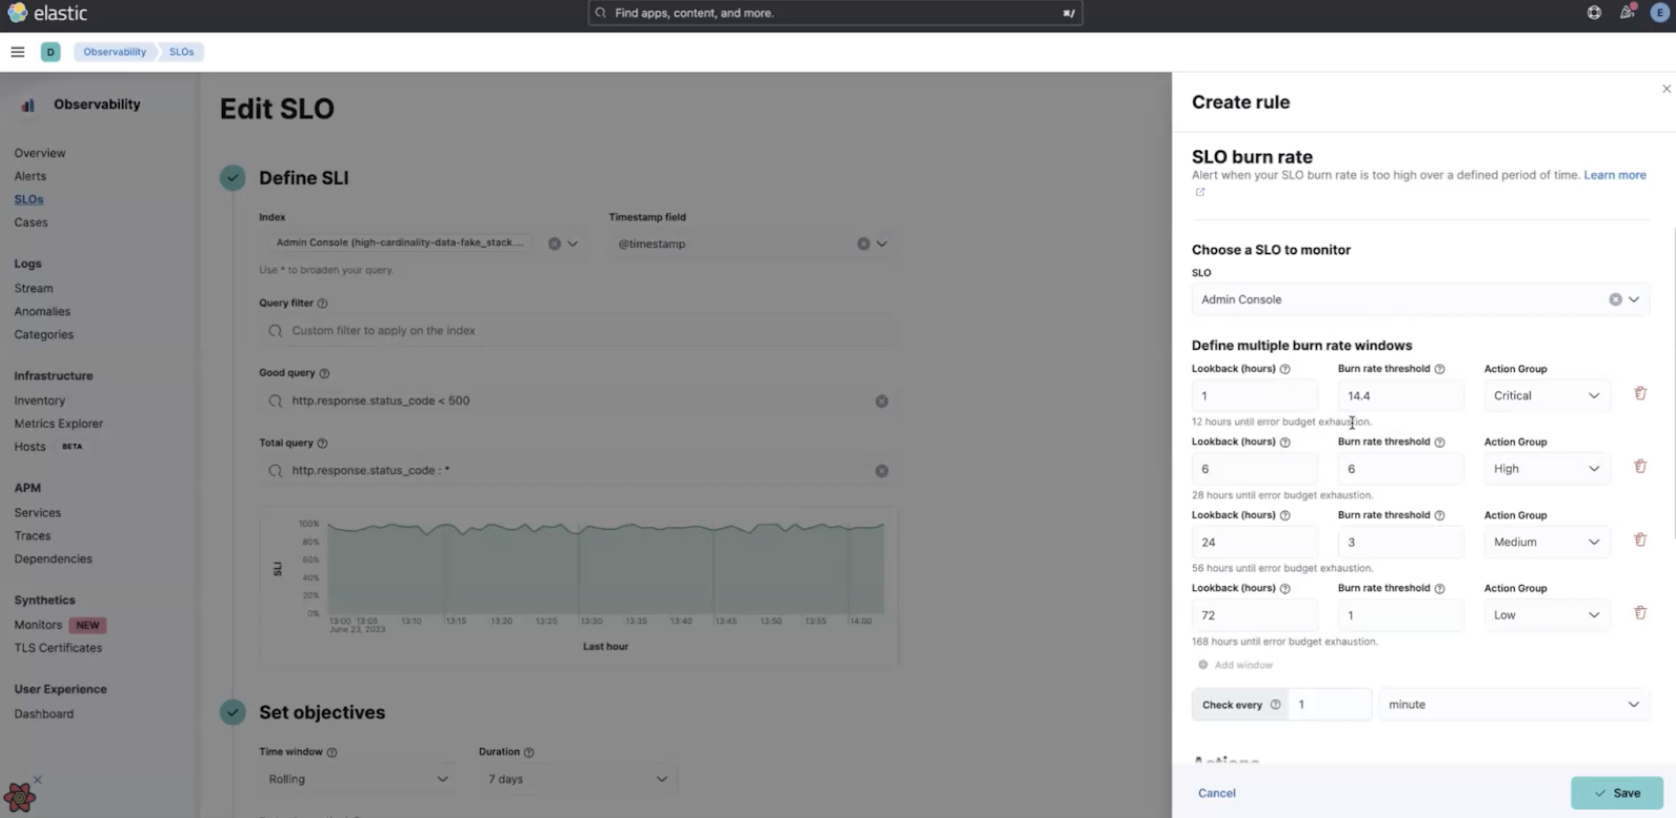
Multiple burn rates allow you to adjust the alert to give appropriate priority based on how quickly you have to respond. If an issue will exhaust the error budget within hours or a few days, sending an active notification is appropriate.
Also introduced in 8.9 for SLOs is the new custom metric option for the KQL Service Level Indicator (SLI). For example, this allows users to base their alerts on a ratio of error rate compared to the overall rate of messages.