Analyze and compare hosts
editAnalyze and compare hosts
editThis functionality is in beta and is subject to change. The design and code is less mature than official GA features and is being provided as-is with no warranties. Beta features are not subject to the support SLA of official GA features.
We’d love to get your feedback! Tell us what you think!
The Hosts page provides a metrics-driven view of your infrastructure backed by an easy-to-use interface called Lens. On the Hosts page, you can view health and performance metrics to help you quickly:
- Analyze and compare hosts without having to build new dashboards.
- Identify which hosts trigger the most alerts.
- Troubleshoot and resolve issues quickly.
- View historical data to rule out false alerts and identify root causes.
- Filter and search the data to focus on the hosts you care about the most.
To access this page from the main Kibana menu, go to Observability → Infrastructure, and then click Hosts.
To learn more about the metrics shown on this page, refer to the Metrics reference documentation.
If there are no metrics to display, Kibana prompts you to add a metrics integration. Click Add a metrics integration to get started. If you want to add more data in the future, click Add data from any page in the Infrastructure app.
Need help getting started? Follow the steps in Get started with logs and metrics.
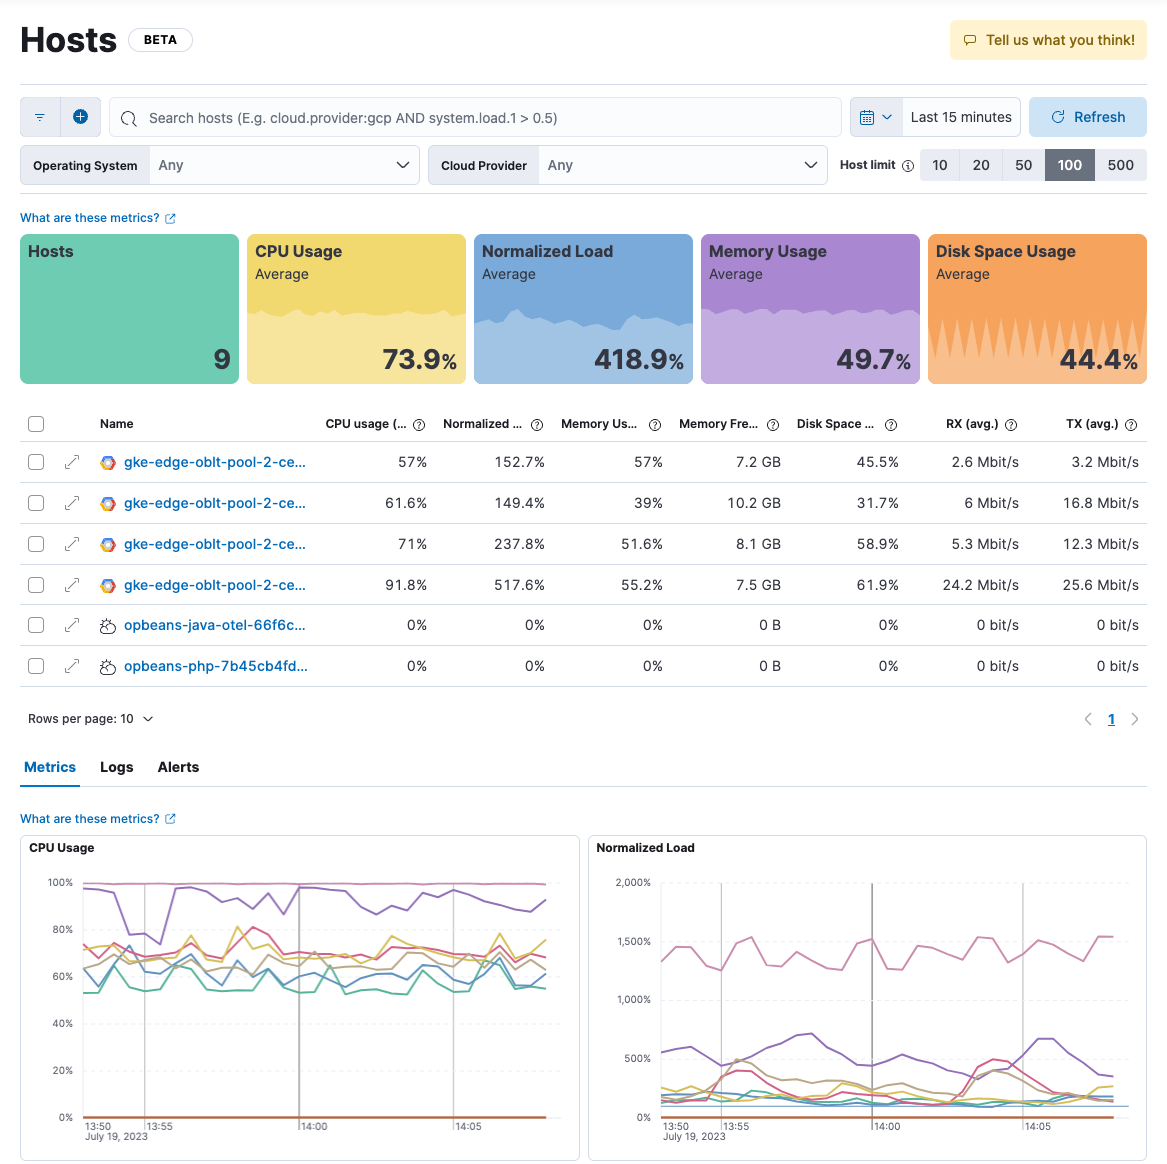
The Hosts page provides a few different ways to view host metrics:
- Overview tiles show the number of hosts returned by your search plus averages of key metrics, including CPU usage, memory usage, and throughput.
- The Host limit controls the maximum number of hosts shown on the page. The default is 20, which means the page shows data for the top 20 hosts based on the most recent timestamps. You can increase the host limit to see data for more hosts, but doing so may impact query performance.
- The Hosts table shows a breakdown of metrics for each host. You may need to page through the list or change the number of rows displayed on each page to see all of your hosts.
- Each host name is an active link to an overview page with additional metrics about the host, such as CPU usage, load, memory usage, and network traffic.
- Table columns are sortable, but note that the sorting behavior is applied to the already returned data set.
- The Metrics view shows metrics trending over time, including normalized load, CPU usage, memory usage, network inbound, network outbound, disk read IOPS, and disk write IOPS. Place your cursor over a line to view metrics at a specific point in time.
Filter the Hosts view
editThe Hosts page provides several mechanisms for filtering the data on the page:
-
Enter a search query to show metrics that match your search criteria. For example,
to see metrics for hosts running on linux, enter
host.os.type : "linux". Otherwise you’ll see metrics for all your monitored hosts (up to the number of hosts specified by the host limit). -
Select additional criteria to filter the view:
- In the Operating System list, select one or more operating systems and include (or exclude) metrics for those hosts.
- In the Cloud Provider list, select one or more cloud cloud providers to include (or exclude) metrics for the selected cloud providers.
- Change the date range in the Time Picker, or click and drag on a visualization to change the date range.
- In the visualizations under Metrics, click a point on a line and apply filters to set other visualizations on the page to the same time and/or host.
To learn more about filtering data in Kibana, refer to Kibana concepts.
Open in Lens
editMetrics visualizations are powered by Lens, meaning you can continue your analysis in Lens if you require more flexibility. Under Metrics, hover your cursor over a visualization, then click the ellipsis icon in the upper-right corner to open the visualization in Lens.
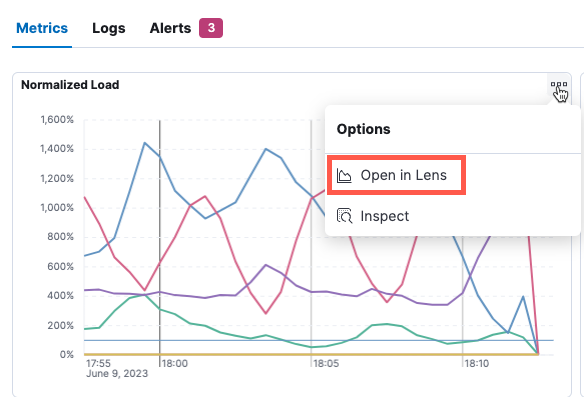
In Lens, you can examine all the fields and formulas used to create the visualization, make modifications to the visualization, and save your changes.
For more information about using Lens, refer to the Kibana documentation about Lens.
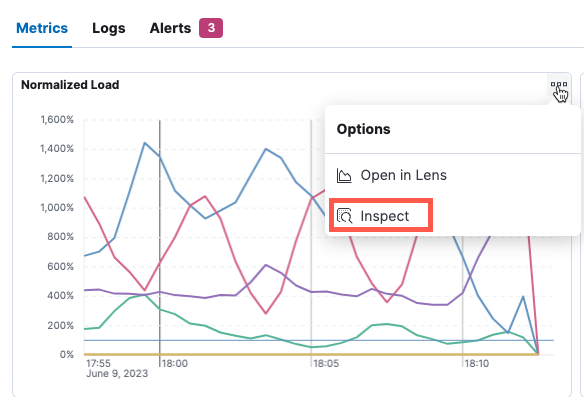
Inspect and download metrics
editOn the Metrics tab, you can access a text-based view of the data underlying your metrics visualizations and optionally download the data to a comma-separated (CSV) file.
Hover your cursor over a visualization, then in the upper-right corner, click the ellipsis icon to inspect the data.
In the flyout, click Download CSV to download formatted or raw data to a CSV file.
Notice that you can change the view to View: Requests to explore the request used to fetch the data and the response returned from Elasticsearch. You can click links to further inspect and analyze the request in the Dev Console or Search Profiler.
View logs
editOn the Logs tab, view logs for the systems you are monitoring and search for specific log entries. This view shows logs for all of the hosts returned by the current query.
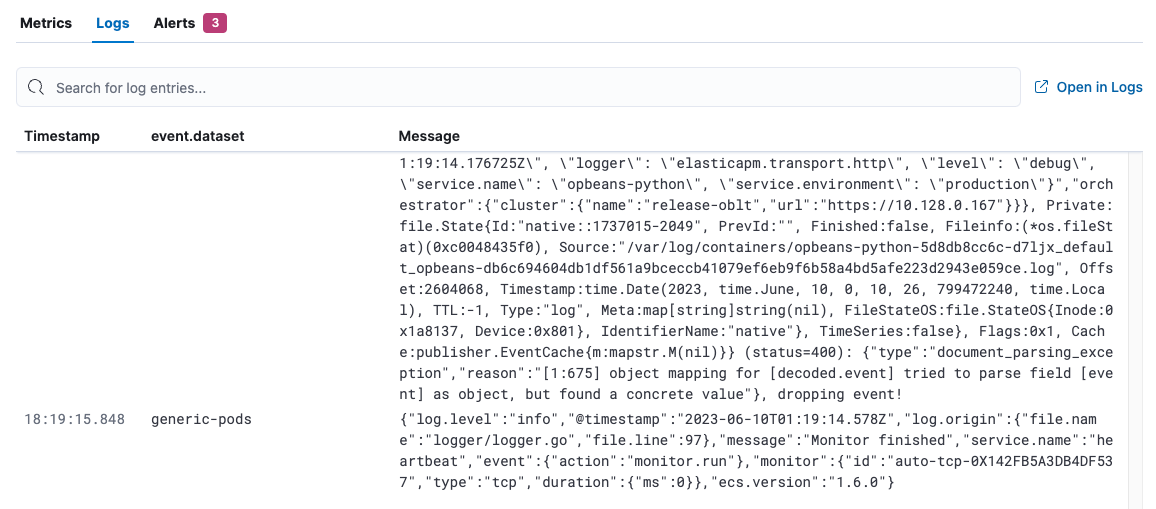
This view uses the log sources and column settings specified in the Logs app. To add log sources or columns (such as host name), refer to Configure data sources.
Click Open in Logs to tail your log files. For more information, refer to Tail log files.
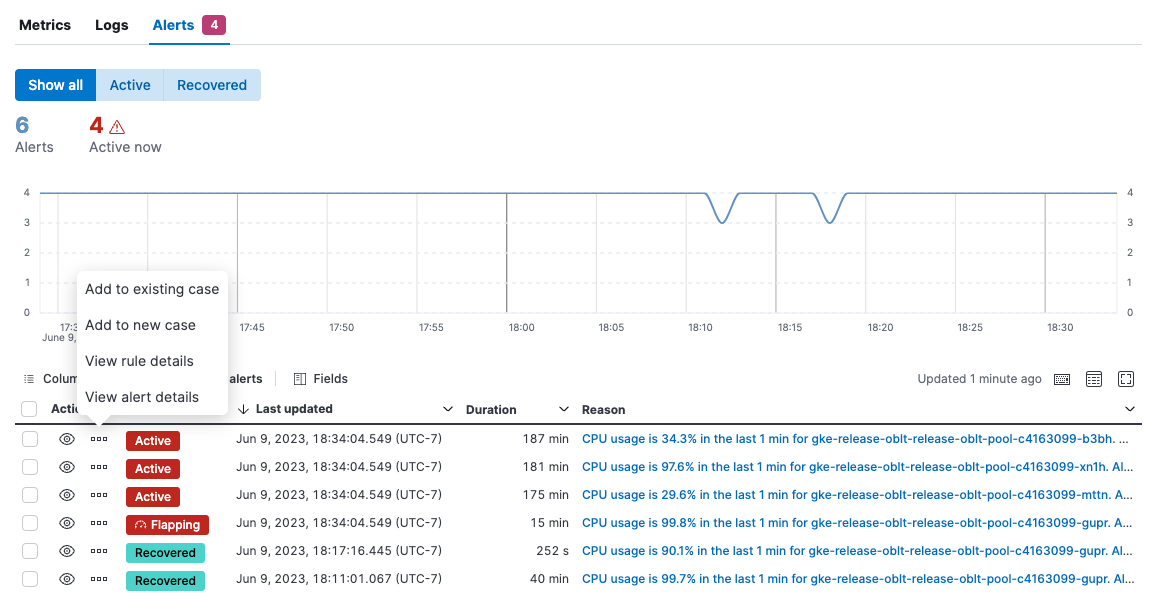
View alerts
editOn the Alerts tab, view active alerts to pinpoint problems. Use this view to figure out which hosts triggered alerts and identify root causes. This view shows alerts for all of the hosts returned by the current query.
From the Actions menu, you can choose to:
- Add the alert to a new or existing case.
- View rule details.
- View alert details.