What’s new in 8.11
editWhat’s new in 8.11
editHere are the highlights of what’s new and improved in 8.11.
Other versions: 8.10 | 8.9 | 8.8 | 8.7 | 8.6 | 8.5 | 8.4 | 8.3 | 8.2 | 8.1 | 8.0 | 7.17
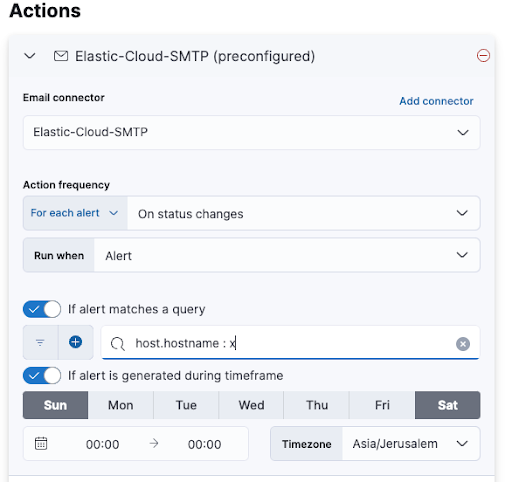
Conditional actions in alerting rules
editWhen creating an Observability alerting rule, you define conditions that must be met for an alert to occur. Now you can also add conditions that affect the actions associated with an alert. For example, you might choose to send notifications only if the alert is received between defined hours.
Faster-Loading and Consistent Host Views
editWhen investigating a host, you will now see our new, consistent, and faster experience for previewing and opening any host in a full-screen view. Alerts will feature directly in the host views and you can control the date ranges directly in the preview fly-out to help you keep your investigation flow and isolate root causes quicker!
Additionally, you will have the same experience for previewing and viewing hosts whether you are working within the Hosts or Inventory views.
Here’s the new flow:
Synthetic Monitoring Automatic retesting
editSynthetic Monitoring has rolled out an update to improve the accuracy and reliability of our error detection process. A new feature, automated retesting, has been added to the workflow. When a test fails, instead of immediately moving to an error state and sending an alert, the system will automatically trigger a retest. This aims to confirm whether the detected issue is a persistent one or just a temporary glitch. By incorporating this feature, we aim to reduce the number of false positives, ensuring that alerts sent out are indicative of a genuine issue that needs attention. For our customers, alerts will now be more indicative of actual issues requiring intervention—allowing for more focused troubleshooting and issue resolution.
This feature is available to both browser and ping tests as well as those running on either our global managed testing infrastructure or private locations. It’s available to all license levels and is considered generally available (GA).
New Integrations
editVersion 8.11 introduces powerful new integrations that elevate cloud computing and data processing capabilities. Seamlessly integrating with AWS API Gateway, Amazon EMR, Azure App Service, and Azure Functions, this release offers a unified environment for monitoring APIs, big data clusters, web applications, and serverless functions. These integrations streamline cloud resource management, enhance performance, and provide increased flexibility. Check out our documentation for more information:
Better together: Universal Profiling and APM integration
editWe are excited to announce that we have added the ability for users to quickly correlate application performance issues with underlying system functions without needing to switch context from APM to Universal Profiling.
This integration provides several benefits, including:
- Reduced time to resolution: DevOps and SREs can now troubleshoot and pinpoint performance and errors in production code down to specific parts of the code and third-party libraries that need modifying and/or upgrading. This is all done in the APM services view without needing to switch context.
- Improved visibility: Universal Profiling provides unprecedented code visibility into the runtime behavior of all applications running on a host. It profiles every line of code on the host(s) running your services, including not only your application code but also the kernel and third-party libraries. This can help you to identify suboptimal libraries and other processes or services on the same host that could impact a specific service’s performance.
Suppose you are running a containerized Java service on a host. Using APM, you notice that the performance of your Java service is degrading over time. From within the APM services page, Universal Profiling is used to identify the specific function calls that are consuming the most CPU time. You find that one of the functions that is taking the most time is a call to a library that is used to connect to a Redis.
You investigate further and find that the library is old and is not using the most efficient way to connect to Redis. You make the necessary changes to the library and the performance of your Java service improves significantly.
In addition to identifying suboptimal libraries, Universal Profiling can also be used to detect other processes or services on the same host that could impact a specific service’s performance. For example, you may have a process that is unrelated to the service in question that is using a lot of CPU resources, which could have a knock-on effect on your service.
By integrating Universal Profiling with APM, DevOps and SREs can gain even deeper insights into the runtime behavior of their code and identify and troubleshoot performance bottlenecks more quickly and efficiently.