Cloud-native observability from customer to kernel

 Share on Twitter
Share on Twitter

 Share on LinkedIn
Share on LinkedIn

 Share on Facebook
Share on Facebook

 Share by Email
Share by Email

 Print this page
Print
From its inception as a powerhouse for logging, Elastic Observability has grown into a comprehensive solution for full-stack multi and hybrid-cloud observability. Given the increasing complexity of the cloud-native world, the major challenge for observability is twofold: getting deeper and more frictionless visibility at all levels of applications, services, and infrastructure, and making sense of the overwhelming amount of data that is available.
Towards this end, recent and future areas of innovation for Elastic Observability, include:
- Zero-instrumentation “always-on” Universal Profiling™ based on eBPF (currently in beta)
- A fully reimagined cloud and developer first synthetic monitoring offering, including a cloud-based global testing infrastructure, point-and-click script recorder, and seamless ability to automatically enable synthetic tests via the unit tests built during development (partially in beta with much more to come!)
- Enhanced open standards support, including full native support for OpenTelemetry, from logs to metrics to traces; and CI/CD pipeline visibility with plugins for Jenkins, Maven, and Ansible
- Machine learning capabilities across all cloud native observability telemetry data driving smarter operations and AIOps initiatives
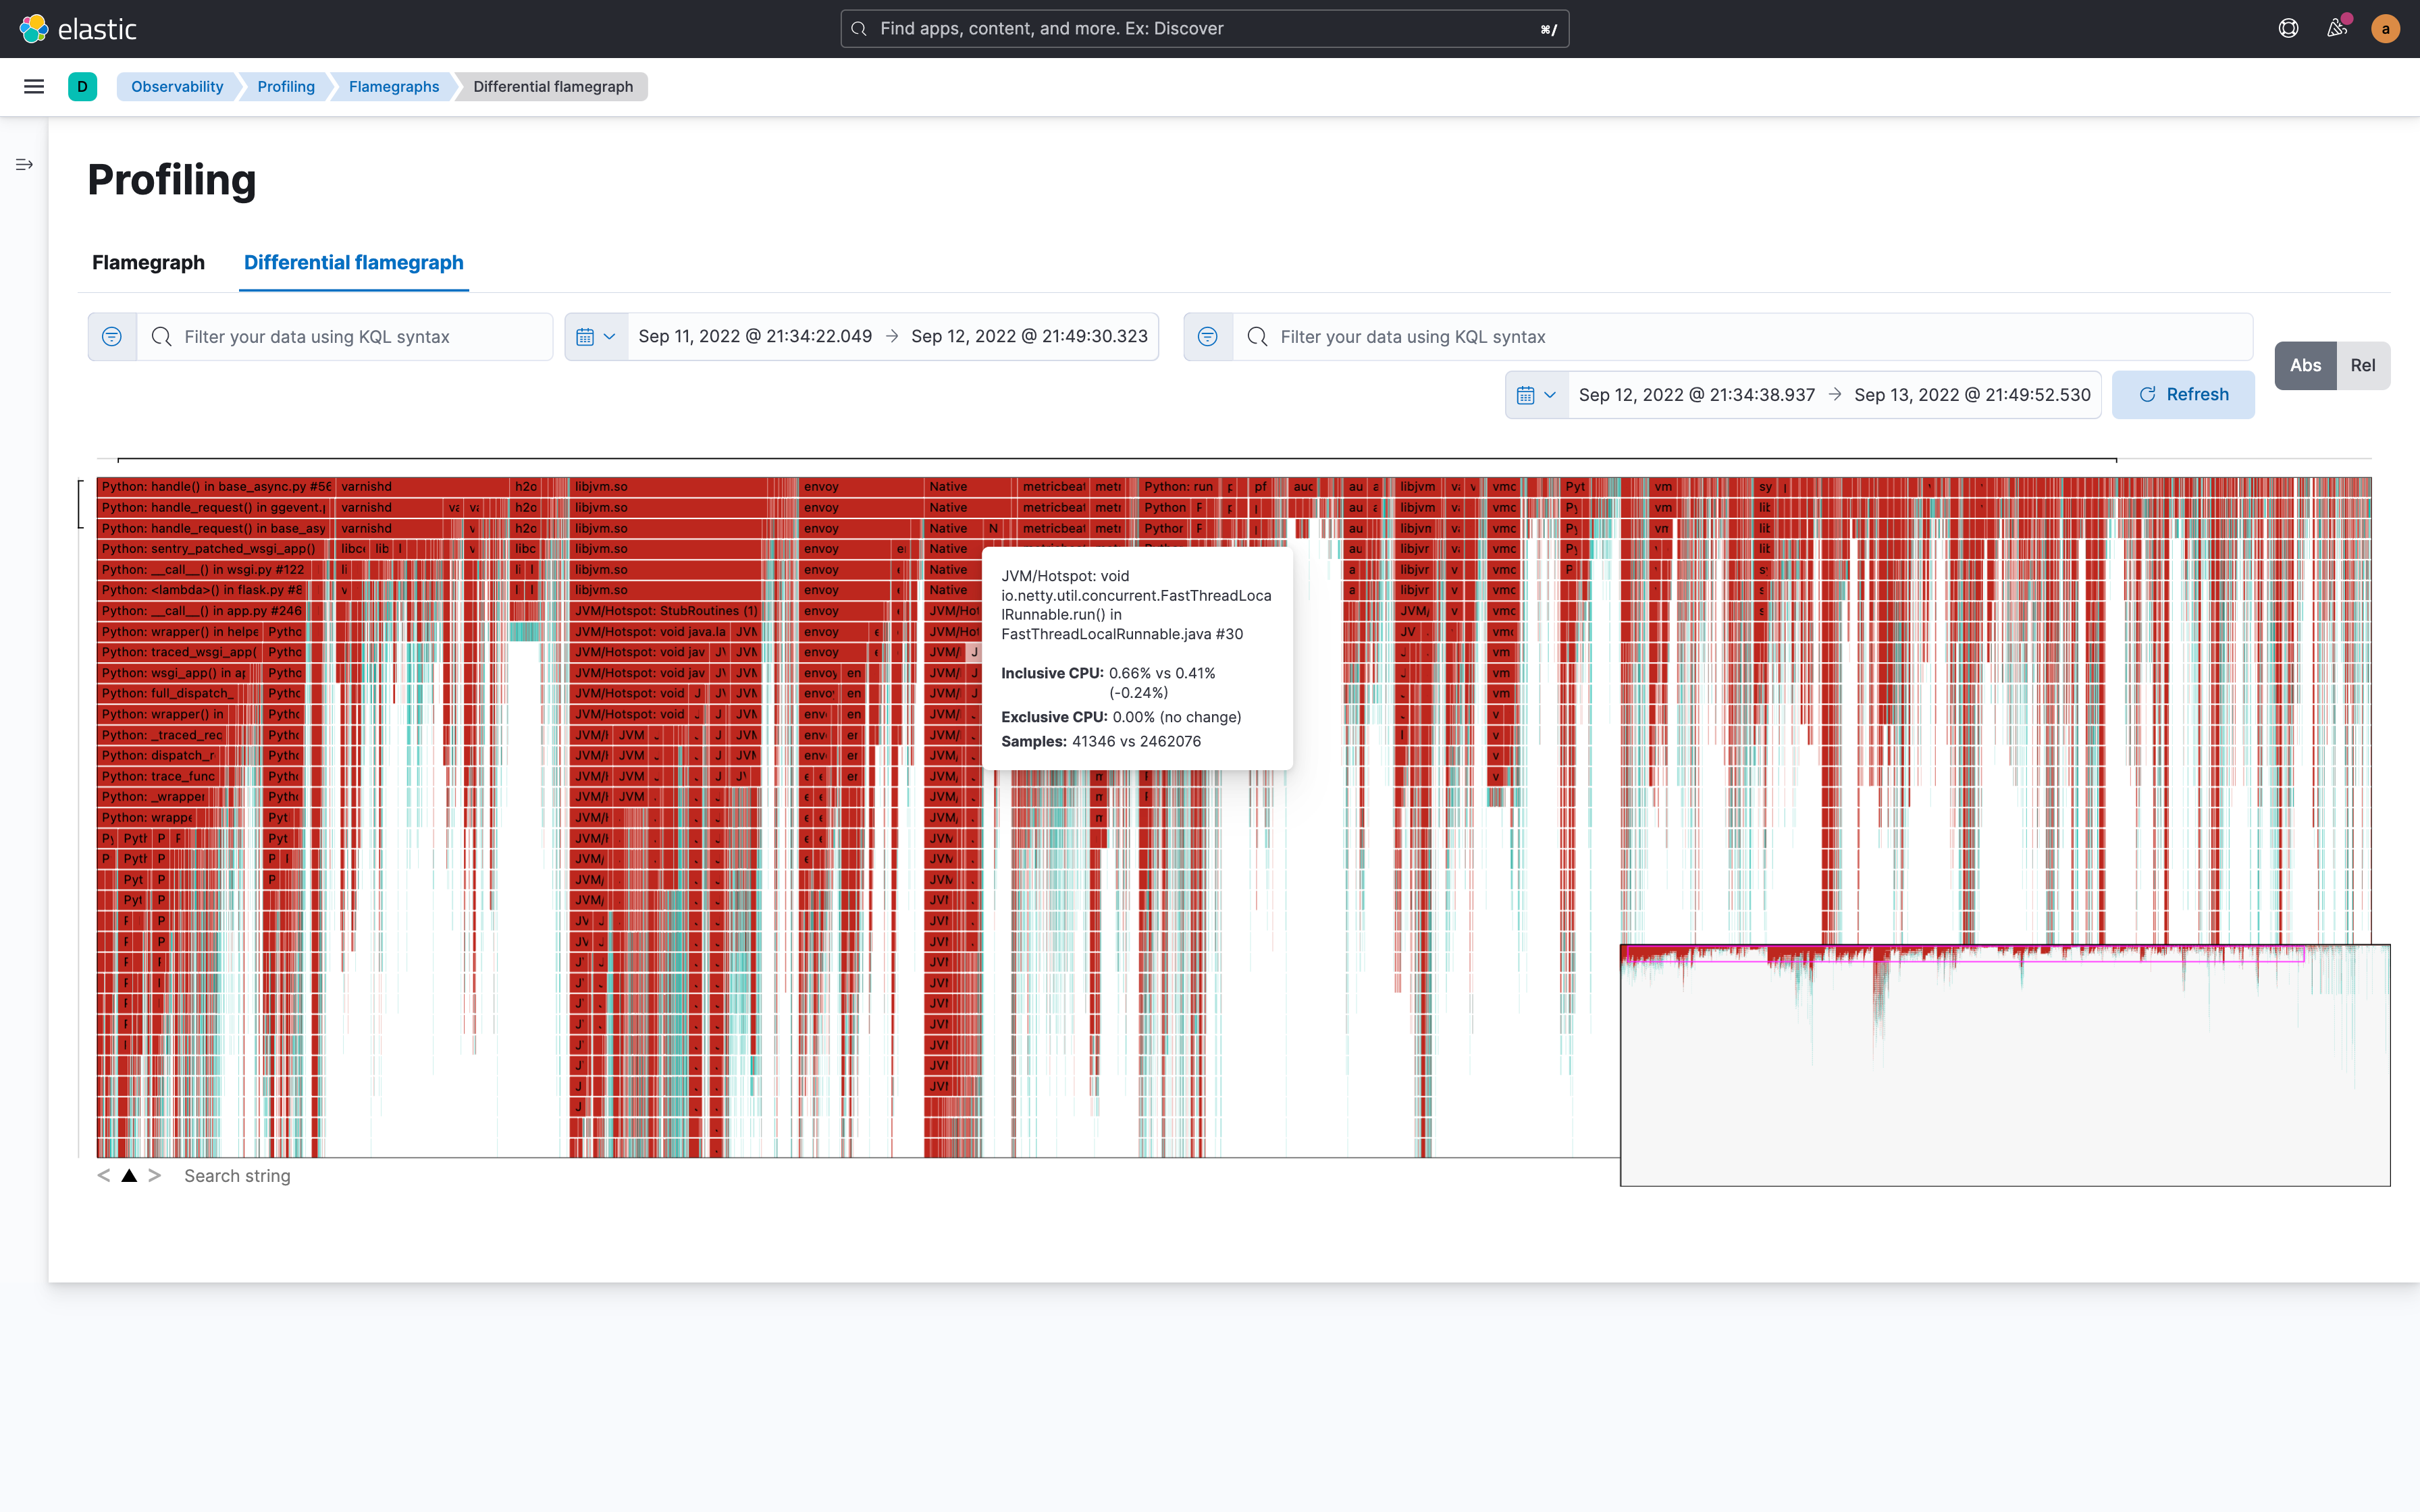
Get unprecedented visibility with frictionless “always-on” Universal Profiling™ based on eBPF
Traditional monitoring tools can deliver a wealth of information — but at a price. Instrumentation overhead and deployment complexity are often limiting factors for modern application teams. As such, teams will frequently opt for instrumenting only part of an application, or only collecting code-level traces when certain rules or sampling conditions are met, in order to avoid application slowdowns. And APM isn’t always enough visibility for resolving issues, especially when it comes to tracking resource consumption in containerized environments.
With its new Universal Profiling™ (currently in private beta), Elastic Observability upgrades your toolkit with a zero-instrumentation approach that delivers an incredible level of depth and visibility into system and application performance. Enabled by cutting edge eBPF-based technology, Universal ProfilingTM continuously builds stack traces that go from the kernel, through user-space native code, all the way into code running in higher level runtimes, providing unprecedented insight into a system’s behavior at all levels. Easily identify your most expensive lines of code and optimize your application’s performance and resource usage.
This approach overcomes the instrumentation limitations of traditional monitoring systems, enabling continuous whole system visibility into the black box for solving performance bottlenecks by delivering:
- High performance profiling of both user-space and kernel-level code, so you can understand what lines of code are consuming CPU resources and identify performance regressions, wasteful computation, and other issues
- Frictionless, non-intrusive deployment that requires no application source code change, recompilation, or instrumentation
- Low overhead profiling, which can run 24/7 with no noticeable impact on the profiled systems
- Responsive and easy to use visualizations such as flamegraphs and call graphs
- Support for almost all popular language runtimes, including native C/C++, Rust, and Go code (even without debug symbols), plus PHP, Python, Java, Node.js, Scala, Ruby, and Perl, as well as common containerization and orchestration platforms, such as Docker, Kubernetes, and Nomad; whether running on ARM or x86 processors
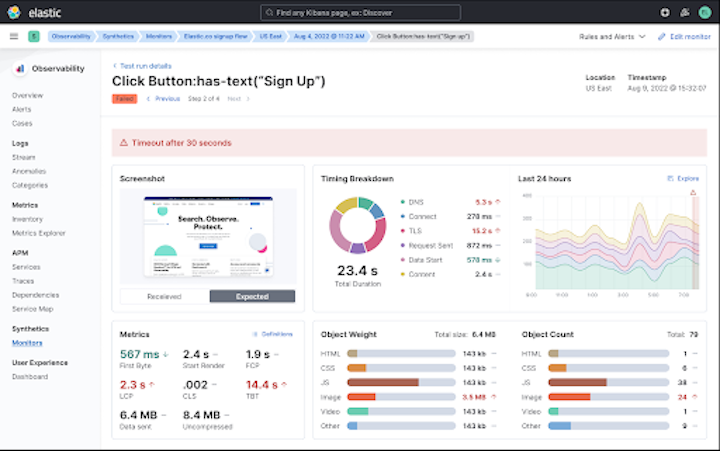
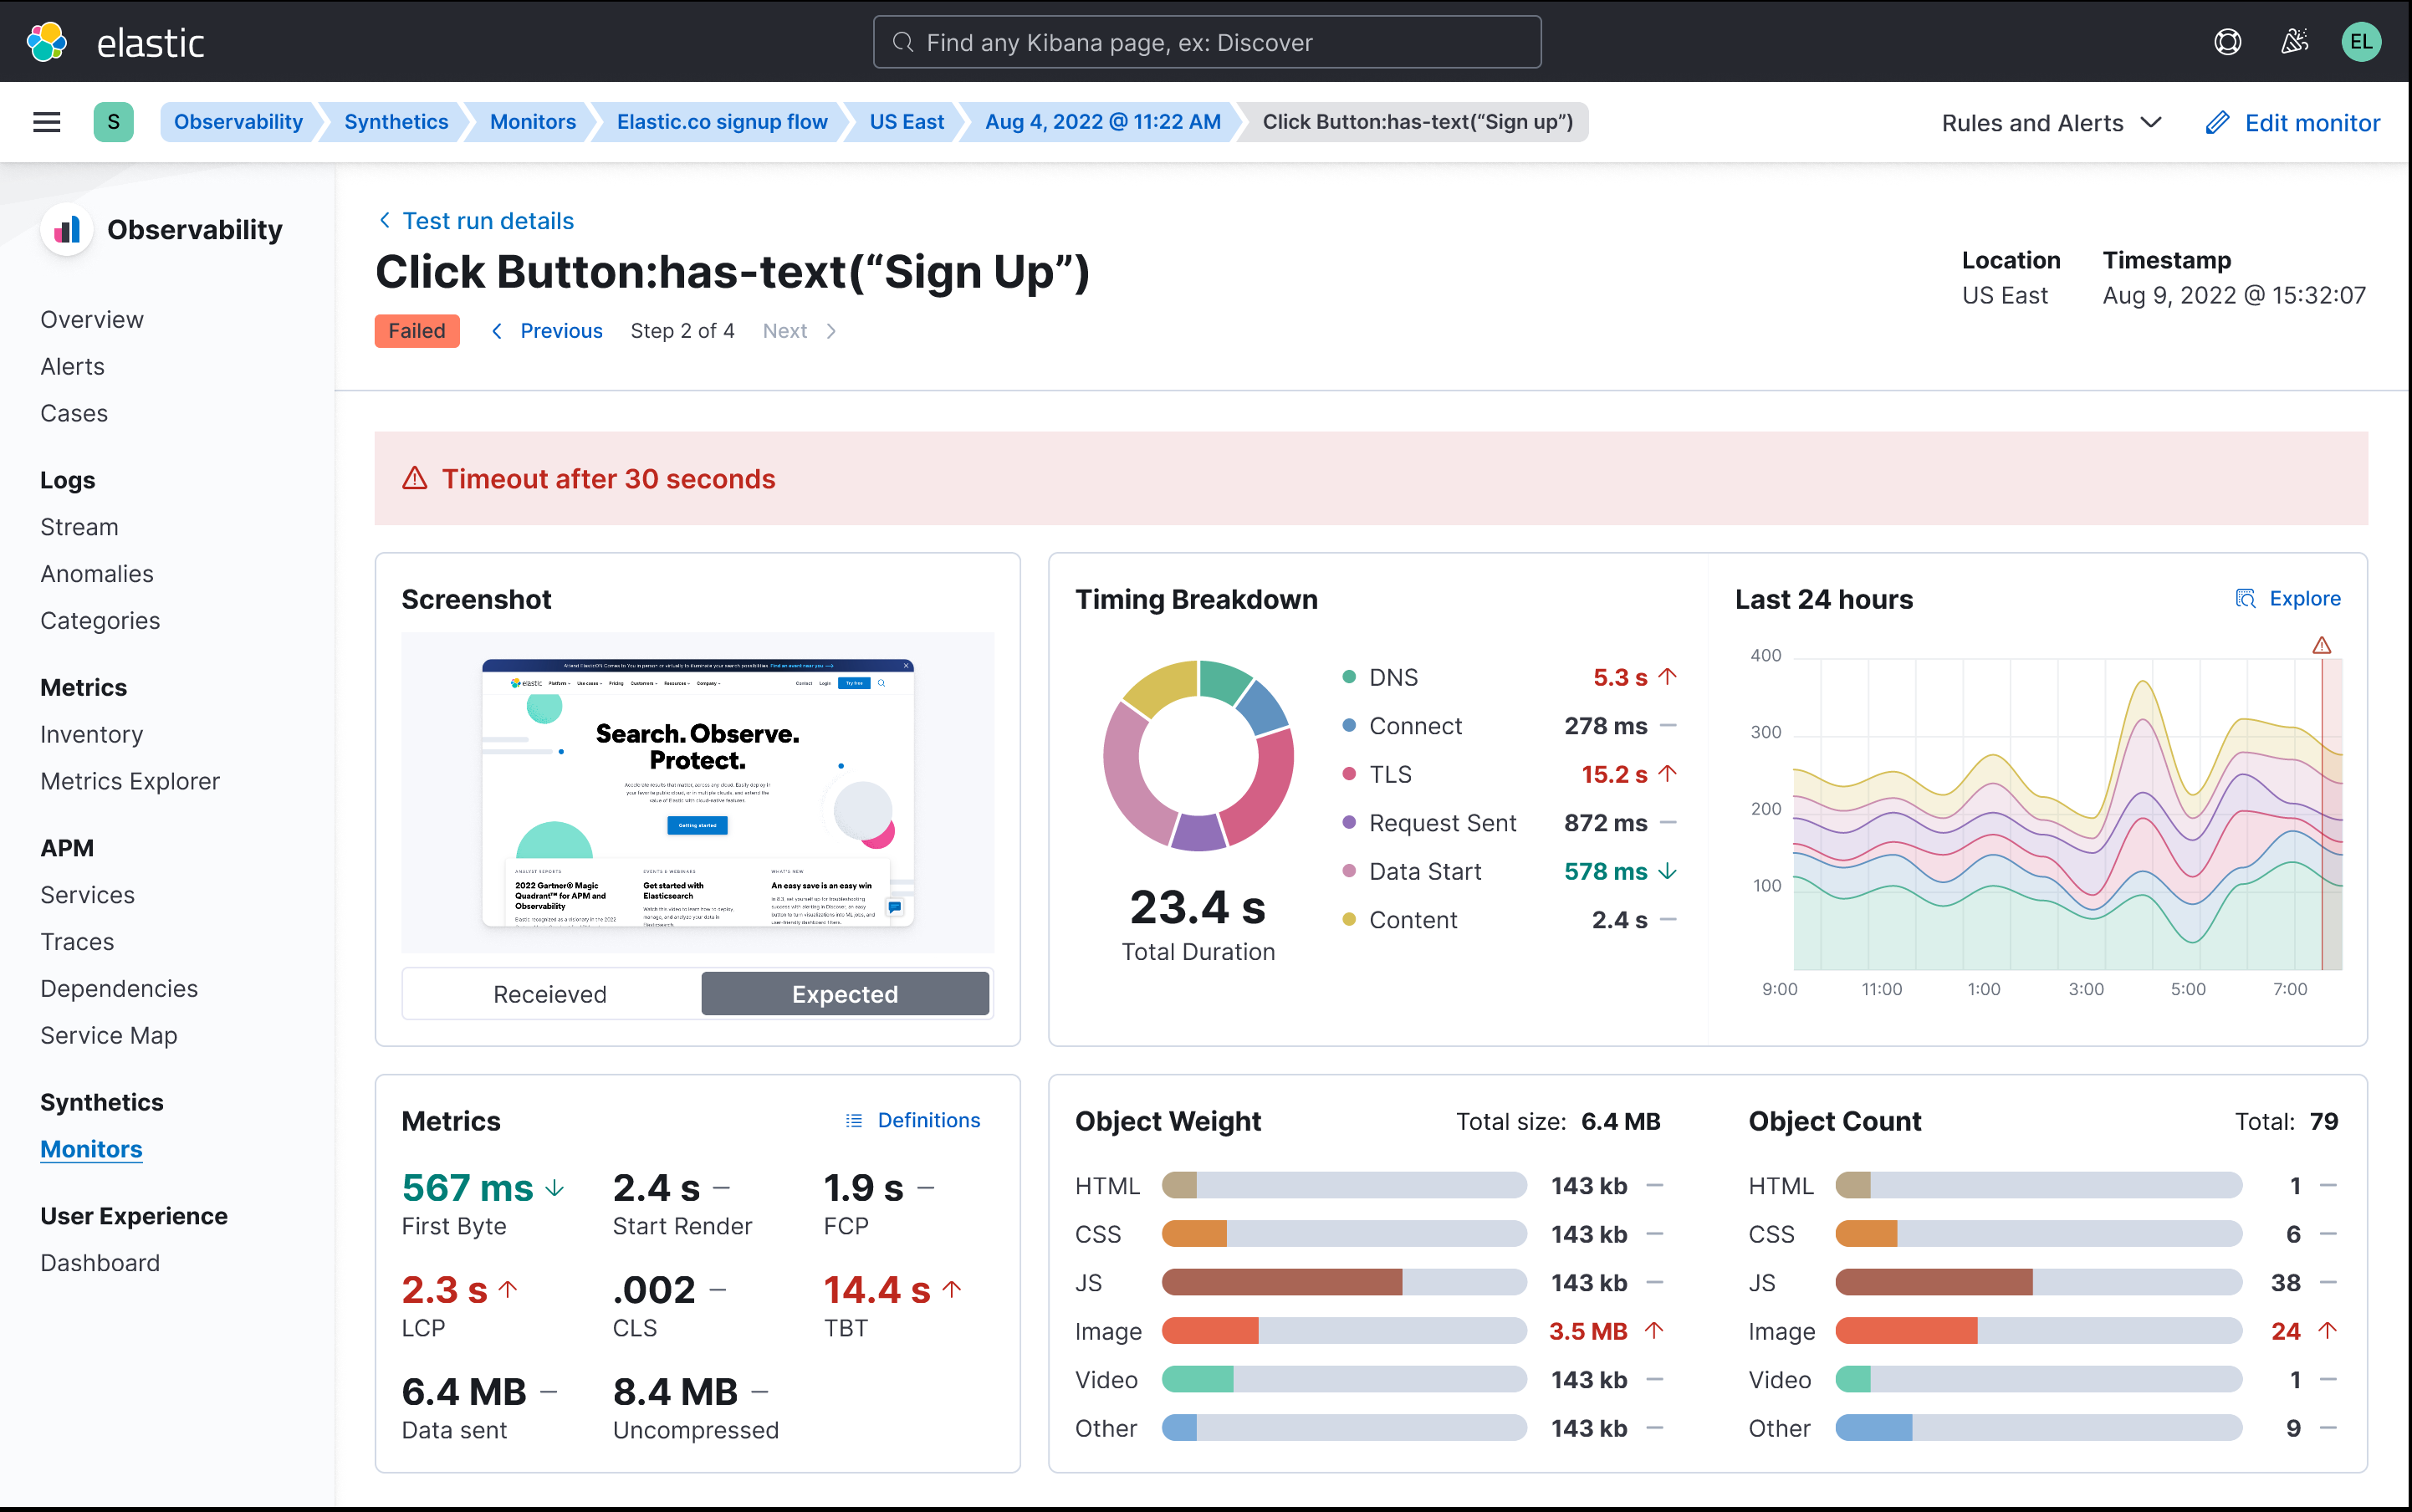
Observing your application through the eyes of a user: A brand new synthetic monitoring experience is in the foreseeable future
Understanding if applications are not simply available but also functioning as expected is critical for any organization. Third-party dependencies and different end-user device types means that infrastructure and application observability alone are not enough to spot and minimize the impact of application anomalies.
To enable the best experience for our customers, Elastic is very excited to announce that we will be bringing front end monitoring into the Elastic Observability solution in the foreseeable future.
- Managed testing infrastructure: No need to worry about managing your own testing infrastructure. Leave that to us. You will be able to schedule your tests to run from a global network of testing agents to get better visibility on regional variances. Beta access to this infrastructure is currently available to try out within the Elastic Uptime product.
- Entirely new UI: Synthetic transaction data is full of rich signals to help SREs and developers spot and troubleshoot problems in production. To support this, we’re building a completely new Synthetics UI. It’s optimized around getting to the answers you need, quickly.
- Fully optimized for developers, the CI/CD pipeline, and GitOps: A synthetic monitor is effectively a functional test running against production. You’re already writing functional tests and now you can avoid duplication of effort by pushing those functional tests into our synthetics solution as monitors when you release to production. Create, edit and delete monitors entirely in code. An additional feature that will make the lives of developers easier is the option to run the synthetics agent locally, which is a step change in usability when creating and debugging monitoring scripts. These scripts can then also be included in your CI/CD pipeline to ensure your tests and application are aligned — and that they’re passing — before pushing to production.
- Point-and-click script recording: Scripting synthetic monitors is a big pain point for everyone we talk to and not everyone has the ability to write them from scratch. With our point-and-click script recorder, even non-technical users can quickly create a user journey through an application and turn that into a synthetic monitor. The recorder also dramatically speeds up the process of creating monitoring scripts for developers by quickly giving them a framework that they can edit locally. The beta is available today.
We’re very excited to tell you more about our solution over the coming months. Stay tuned for more beta previews and news about our launch dates as we bring these exciting new capabilities to market.
Accelerate problem resolution with machine learning and contextual telemetry data to drive smarter operations
Given the explosion of business and telemetry data, especially from cloud-native applications, AIOps has become a critical need for many organizations. The volume, complexity, and constant change within dynamic and distributed multi-cloud environments can be overwhelming. AIOps aims to surface the right areas that need attention with the right amount of information. By adding a layer of intelligence through analytics and automation, AIOps can help lighten the load for application, DevOps, and support teams alike.
Elastic’s cutting-edge AIOps capabilities are based on an open and extensible platform that is able to ingest and store high cardinality and high dimensionality business and telemetry data at scale. Elastic’s industry-leading data store provides speed and efficiency for analytics, with distinctive capabilities such as data tiering and cross-cluster search. A key advantage is delivered by the Elastic Common Schema (ECS) that provides the basis for establishing context and correlation across a diverse array of data sources across metrics, logs, and traces. Elastic’s single platform for Observability and Security further advances collaboration and workflow integrations within and across teams, including for DevSecOps use cases.
Part of Elastic’s AIOps vision is to operationalize machine learning for non–data scientists with easy to use out-of-the-box ML jobs, while also giving customers who are so inclined the ability to create, train, and deploy their own machine learning models.
Built on an open and flexible platform that supports a bring-your-own-data (BYOD) model, Elastic’s machine learning engine is:
- Performant, scalable, and resilient to node failure: ML jobs are highly optimized and can be autoscaled in the cloud
- Easy to use and integrate: Wizard-based workflows allow customers to create both simple (single-metric) or complex (multi-metric) models, and make it easy to use, customize, and integrate machine learning into programmatic workflows
- Data agnostic: The ability to correlate and contextualize across diverse data types, both business and operational, allowing our customers to streamline investigative workflows, and reduce alert noise as well as false positives
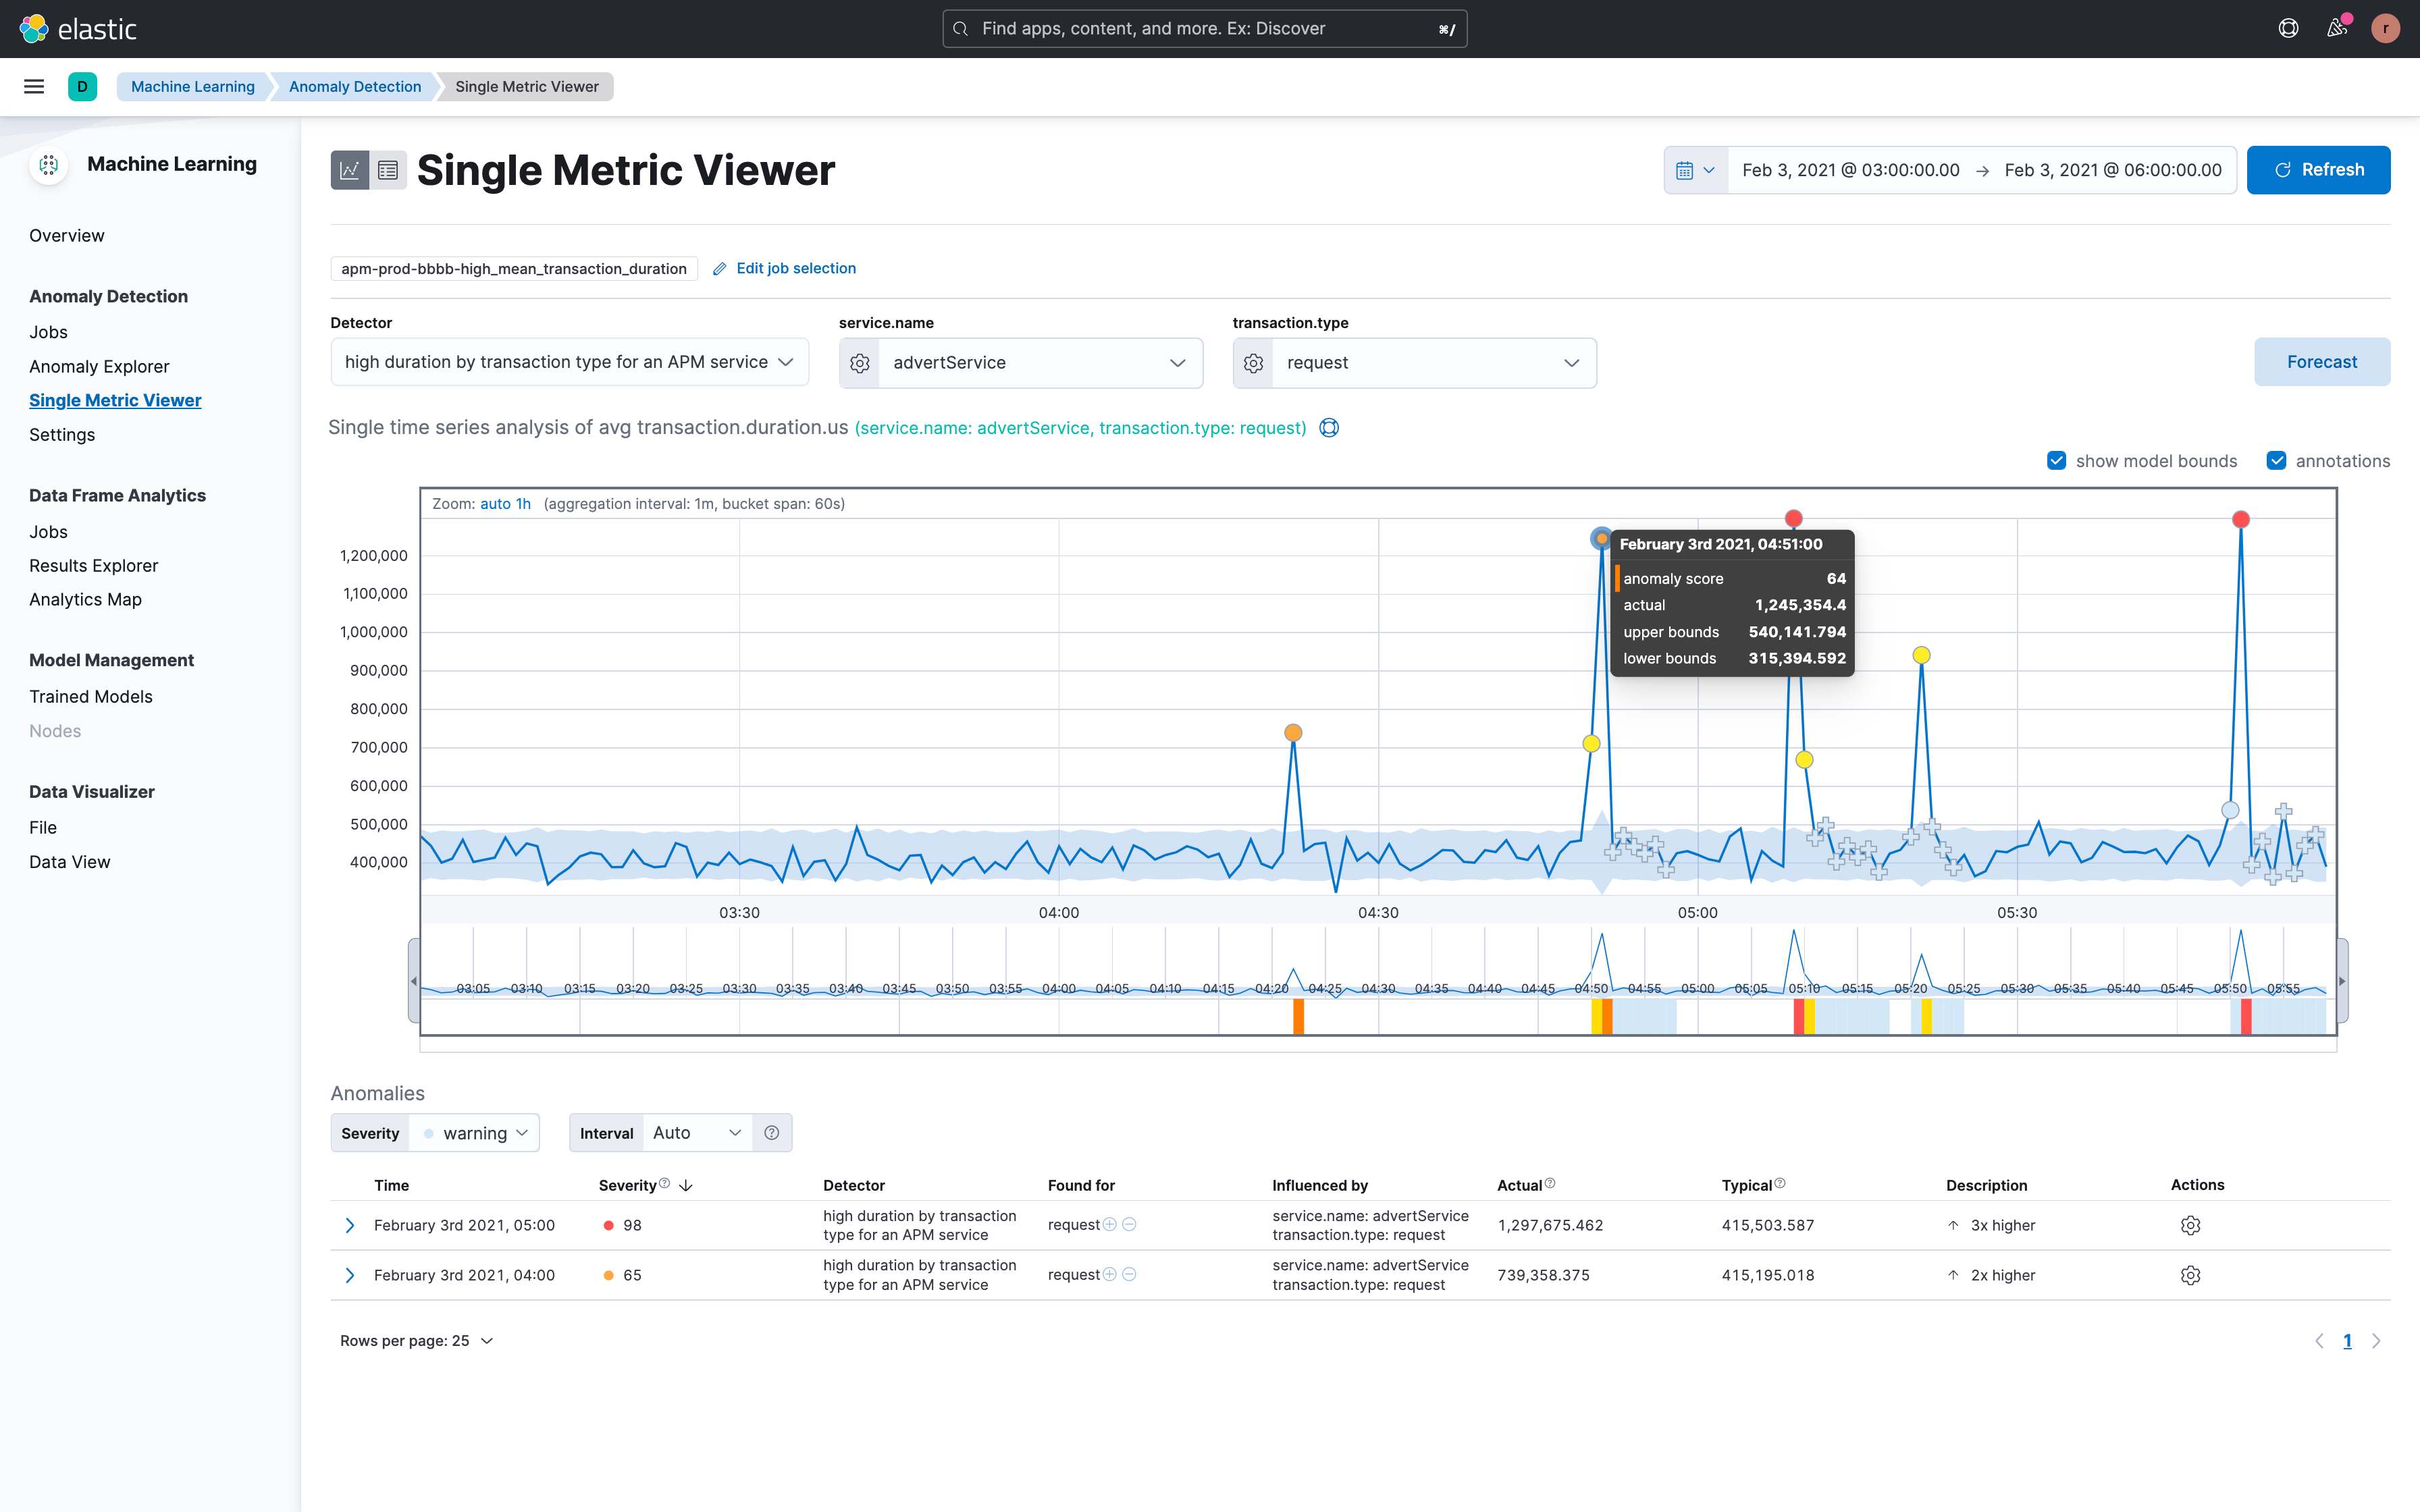
In terms of domain-specific machine learning capabilities, Elastic provides out-of-the box unsupervised models for time series analysis, baselining, and automated anomaly detection for APM (latency, errors, traffic), infrastructure (memory, network), and logging (rate, categorization) use cases; correlation analysis for transaction latency and failures enabling customers to accelerate root cause investigation based on statistical pattern analysis; and the ability to predict future behavior with data forecasting.
In the near future, Elastic plans to advance its AI-enabled root cause analysis capabilities with a number of innovative enhancements. These include improved summarization and context applied to massive amounts of log data to extract meaningful insights, more intelligent alerting, and configuration change analysis capabilities to surface trends, anomalies, and correlations, as well as real-time pattern analysis, and improved alert relevance with richer context, correlation, deduplication, and scoring. Analyzing observability data in context with application topology will provide the basis for groundbreaking “Explain the Change” workflows and identifying probable root causes.
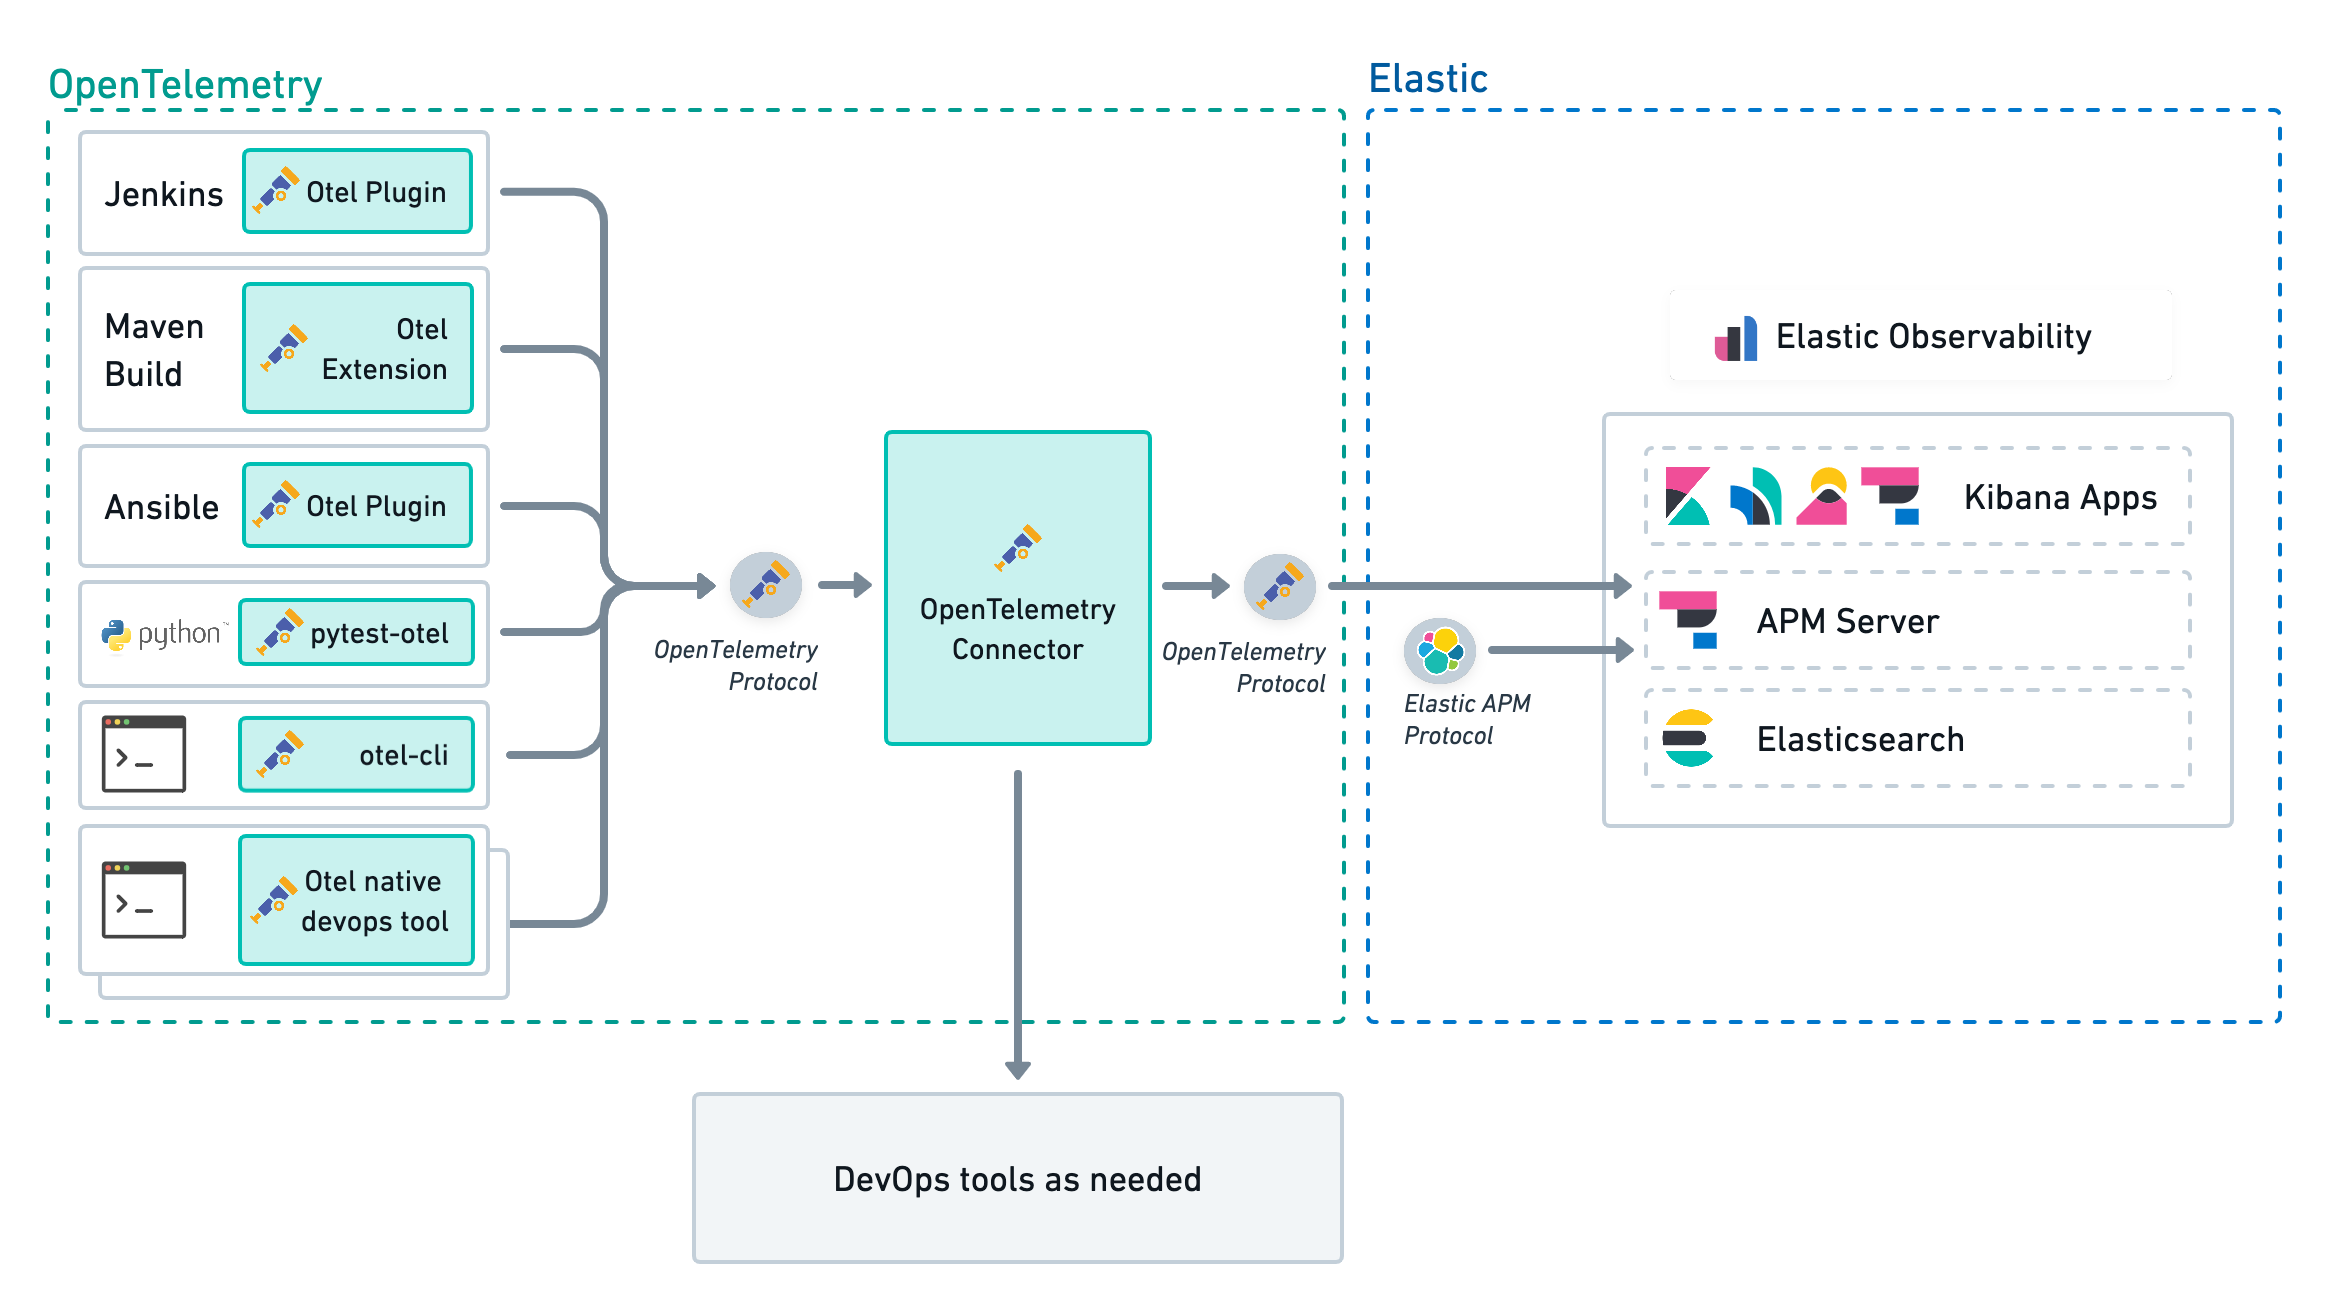
Seamlessly monitor applications with native support for OpenTelemetry and its rich OSS ecosystem
With its commitment to high-quality, ubiquitous, and portable telemetry, OpenTelemetry (OTel) has become foundational for standardizing observability efforts at organizations who wish to future-proof their instrumentation by avoiding vendor lock-in.
As part of Elastic’s commitment to all things free and open, Elastic Observability seamlessly integrates with OpenTelemetry by providing native support for the OpenTelemetry Protocol (OTLP). Open source plugins for CI/CD pipeline observability are also available for visibility into build tools to improve code velocity.
With Elastic Observability, customers can consolidate all of their observability data into Elastic’s open and extensible platform and take advantage of Elastic’s powerful machine learning, mapping, and visualization capabilities for deeper troubleshooting and analysis at scale — from pipeline to production. In addition, standardized data from OpenTelemetry can help machine learning algorithms produce more accurate models with which to make predictions and deliver remediation, especially if those decisions are automated.
With Elastic, customers can:
- Integrate OpenTelemetry data with ease with full native support for all OTLP signals, including distributed traces, metrics, and logs
- Correlate OpenTelemetry signals in context with other observability data
- Build accurate machine learning models based on standardized signals and rich contextual attributes supplied by OpenTelemetry
- Get CI/CD pipeline visibility with Elastic-contributed plugins for Ansible, Jenkins, and Maven
- Future-proof instrumentation with open standards
Try it out
Existing Elastic Cloud customers can access many of these features directly from the Elastic Cloud console. If you’re new to Elastic Cloud, take a look at our Quick Start guides (bite-sized training videos to get you started quickly) or our free fundamentals training courses. You can always get started for free with a free 14-day trial of Elastic Cloud. Or download the self-managed version of the Elastic Stack for free.
The release and timing of any features or functionality described in this post remain at Elastic's sole discretion. Any features or functionality not currently available may not be delivered on time or at all.
Share
- Share on Twitter
Share on Twitter
- Share on LinkedIn
Share on LinkedIn
- Share on Facebook
Share on Facebook
- Share by Email
Share by Email
- Print this page
Print