Introducing the Logstash HTTP input plugin
Logstash has been missing a way to receive data through HTTP requests, but not anymore!
The logstash-input-http plugin is now available for everyone! Also, starting with Logstash 1.5.2, it is included as one of the default plugins that are distributed with the official release.
So what exactly does the logstash-input-http plugin do?
When you configure this plugin in the input section, it will launch a HTTP server and create events from requests sent to this endpoint. This means you can send notification data to Logstash using webhooks, thereby integrating your existing applications with Logstash’s rich plugin ecosystem!
How do I use this plugin?
By default it will bind the webserver to all hosts ("0.0.0.0") and open the TCP port 8080 but it's possible configure these settings:
input {
  http {
    host => "127.0.0.1" # default: 0.0.0.0
    port => 31311 # default: 8080
  }
}
That's all you need!
What about security?
You can configure basic authentication by setting a username and password. All requests done to Logstash will then have to set the right credentials or receive a 401 response. Only correctly authenticated requests will produce an event inside of Logstash. For SSL, it is necessary to specify the path to a Java Keystore that contains the certificate that clients use to validate the server. Here's an example:
input {
   port => 3332
   user => myuser
   password => "$tr0ngP4ssWD!"
   ssl => on
   keystore => "/tmp/mykeystore.jks"
   keystore_password => "keystore_pass"
}
OK, now show me this plugin in action!
Step 1 - starting Logstash with http input:
bin/logstash -e "input { http { } } output { stdout { codec => rubydebug} }"
Step 2 - That's it!
To test it, let's issue two requests:
% curl -XPUT 'http://127.0.0.1:8080/twitter/tweet/1' -d 'hello'
% curl -H "content-type: application/json" -XPUT 'http://127.0.0.1:8080/twitter/tweet/1' -d '{
    "user" : "kimchy",
    "post_date" : "2009-11-15T14:12:12",
    "message" : "trying out Elasticsearch"
}'
Result in Logstash:
{
       "message" => "hello",
      "@version" => "1",
    "@timestamp" => "2015-05-29T14:49:00.392Z",
       "headers" => {
           "content_type" => "application/x-www-form-urlencoded",
         "request_method" => "PUT",
           "request_path" => "/twitter/tweet/1",
            "request_uri" => "/twitter/tweet/1",
           "http_version" => "HTTP/1.1",
        "http_user_agent" => "curl/7.37.1",
              "http_host" => "127.0.0.1:8080",
            "http_accept" => "*/*",
         "content_length" => "5"
    }
}
{
          "user" => "kimchy",
     "post_date" => "2009-11-15T14:12:12",
       "message" => "trying out Elasticsearch",
      "@version" => "1",
    "@timestamp" => "2015-05-29T14:49:04.105Z",
       "headers" => {
           "content_type" => "application/json",
         "request_method" => "PUT",
           "request_path" => "/twitter/tweet/1",
            "request_uri" => "/twitter/tweet/1",
           "http_version" => "HTTP/1.1",
        "http_user_agent" => "curl/7.37.1",
              "http_host" => "127.0.0.1:8080",
            "http_accept" => "*/*",
         "content_length" => "110"
    }
}
You can see that in the second request, since the content-type was application/json, the body was deserialized and expanded to the event root (notice the fields "user", "post_date" and "message").
Show me more concrete examples of how to use it!
Because, real world examples make everything clearer!
Elastic Watcher Integration
In this section, we’ll show you how to integrate Elastic Watcher -- the new Elasticsearch plugin for alerting and notification -- with Logstash. Sending notifications to Logstash via this input provides you a powerful toolset to further transform notifications and use Logstash’s rich collection of outputs.
Imagine that you have indices with Apache logs, and now we want to get a periodic update of how many requests are resulting in a 404 (Not Found) response.
The required steps for this are:
- Installing Watcher
- Creating a new notification on Watcher that every minute reports the number of events that have a 404 response status
- Start Logstash with the HTTP input
- Send data to Elasticsearch and watch updates on Logstash
Here we go!
1. Installing Watcher
cd elasticsearch-1.5.2
bin/plugin -i elasticsearch/watcher/latest
bin/plugin -i elasticsearch/license/latest
bin/elasticsearch # restart the server
2. Creating a watch
The Watcher plugin for elasticsearch provides an API to create and manipulate scheduled tasks, or "watches". A Watch will query the data in the elasticsearch cluster according to its schedule, look for certain scenarios (like the presence of an error event) and execute actions. Examples of actions are sending an email, writing a document to an index, calling an outside HTTP endpoint, and more..
For this test, I created a simple watch that:
- every minute
- counts number of HTTP requests that resulted in a 404
- posts result to http://localhost:8080
This is the resulting JSON document I need to send to Watcher:
{
  "trigger" : {
    "schedule" : { "cron" : "0 0/1 * * * ?" }
  },
  "input" : {
    "search" : {
      "request" : {
        "indices" : [
          "logstash*"
          ],
        "body" : {
          "query" : {
            "term": { "response": 404 }
          }
        }
      }
    }
  },
  "actions" : {
    "my_webhook" : {
      "webhook" : {
        "auth" : {
          "basic" : {
            "username" : "guest",
            "password" : "guest"
          }
        },
        "method" : "POST",
        "host" : "127.0.0.1",
        "port" : 8080,
        "path": "/{{ctx.watch_id}}",
        "body" : "{{ctx.payload.hits.total}}"
      }
    }
  }
}
To install this watch you need to create it in Elasticsearch by executing a PUT request:
curl -XPUT 'http://localhost:9200/_watcher/watch/my-watch' -d @create_webhook.json
3. Logstash setup
wget http://download.elastic.co/logstash/logstash/logstash-1.5.2.tar.gz
tar -zxf logstash-1.5.2.tar.gz
cd logstash-1.5.2
bin/logstash -e "input { http { } } output { stdout { codec => rubydebug} }"
4. Results
After launching an ingestion process in another terminal, Logstash starts receiving 1 notification per minute in the form of a HTTP POST:
% bin/logstash -e "input { http { } } output { stdout { codec => rubydebug} }"
Logstash startup completed
{
       "message" => "330",
      "@version" => "1",
    "@timestamp" => "2015-06-02T12:53:00.037Z",
       "headers" => {
               "content_type" => "application/x-www-form-urlencoded",
             "request_method" => "POST",
               "request_path" => "/my-watch",
                "request_uri" => "/my-watch?",
               "http_version" => "HTTP/1.1",
         "http_authorization" => "Basic Z3Vlc3Q6Z3Vlc3Q=",
        "http_accept_charset" => "UTF-8",
         "http_cache_control" => "no-cache",
                "http_pragma" => "no-cache",
            "http_user_agent" => "Java/1.8.0_20",
                  "http_host" => "127.0.0.1:8080",
                "http_accept" => "text/html, image/gif, image/jpeg, *; q=.2, */*; q=.2",
            "http_connection" => "keep-alive",
             "content_length" => "12"
    }
}
{
       "message" => "3103",
      "@version" => "1",
    "@timestamp" => "2015-06-02T12:54:00.030Z",
       "headers" => {
               "content_type" => "application/x-www-form-urlencoded",
             "request_method" => "POST",
               "request_path" => "/my-watch",
                "request_uri" => "/my-watch?",
               "http_version" => "HTTP/1.1",
         "http_authorization" => "Basic Z3Vlc3Q6Z3Vlc3Q=",
        "http_accept_charset" => "UTF-8",
         "http_cache_control" => "no-cache",
                "http_pragma" => "no-cache",
            "http_user_agent" => "Java/1.8.0_20",
                  "http_host" => "127.0.0.1:8080",
                "http_accept" => "text/html, image/gif, image/jpeg, *; q=.2, */*; q=.2",
            "http_connection" => "keep-alive",
             "content_length" => "13"
    }
}
{
       "message" => "6071",
      "@version" => "1",
    "@timestamp" => "2015-06-02T12:55:00.031Z",
       "headers" => {
               "content_type" => "application/x-www-form-urlencoded",
             "request_method" => "POST",
               "request_path" => "/my-watch",
                "request_uri" => "/my-watch?",
               "http_version" => "HTTP/1.1",
         "http_authorization" => "Basic Z3Vlc3Q6Z3Vlc3Q=",
        "http_accept_charset" => "UTF-8",
         "http_cache_control" => "no-cache",
                "http_pragma" => "no-cache",
            "http_user_agent" => "Java/1.8.0_20",
                  "http_host" => "127.0.0.1:8080",
                "http_accept" => "text/html, image/gif, image/jpeg, *; q=.2, */*; q=.2",
            "http_connection" => "keep-alive",
             "content_length" => "13"
    }
}
A more complex example
Now that we know how to trigger notification events from Watcher, we can leverage the plugin ecosystem in Logstash to escalate notifications depending in a certain criteria. This following config will:
- continuously update the number of 404 requests in statsd
- if the count reaches 10000 then send a message to HipChat, or
- if reaches 40000, notify PagerDuty.
input {
  http { }
}
filter {
  if [headers][request_path] == "/my-watch" {
    mutate { convert => ["message", "integer" ] }
  }
}
output {
  if [headers][request_path] == "/my-watch" {
    if [message] > 40000 { # way too many, notify pagerduty
      pagerduty {
        description => "%{host} - Apache: Very high number of 404"
        details => {
          "timestamp" => "%{@timestamp}"
          "message" => "%{message}"
        }
        service_key => "apikeyforlogstashservice"
        incident_key => "logstash/apacheservice"
      }
    } else if [message] > 10000 {    # unusual amount, notify devs in hipchat
      hipchat {
         from => "logstash"
         room_id => "dev"
         token => "[api key]"
         format => "Very high number of 404 requests: %{message}"
      }
    }
    # always update count of 404 in statsd
    statsd { gauge => [ "http.status.404", "%{message}" ] }
  }
}
That's it! Next is an example using GitHub instead of Watcher as the source of notifications.
Receiving updates from GitHub
GitHub allows you to receive commit notifications, so let's receive those in Logstash through the HTTP input plugin. The steps I needed to accomplish this were:
- Creating a VM with Logstash and launching an instance with the HTTP input plugin
- Setting up the GitHub webhook on a repository that will post notifications to the VM
- Doing a commit on the repository to see the flow in action!
1. Logstash setup
I created a VM on Amazon with TCP port 9200 open:
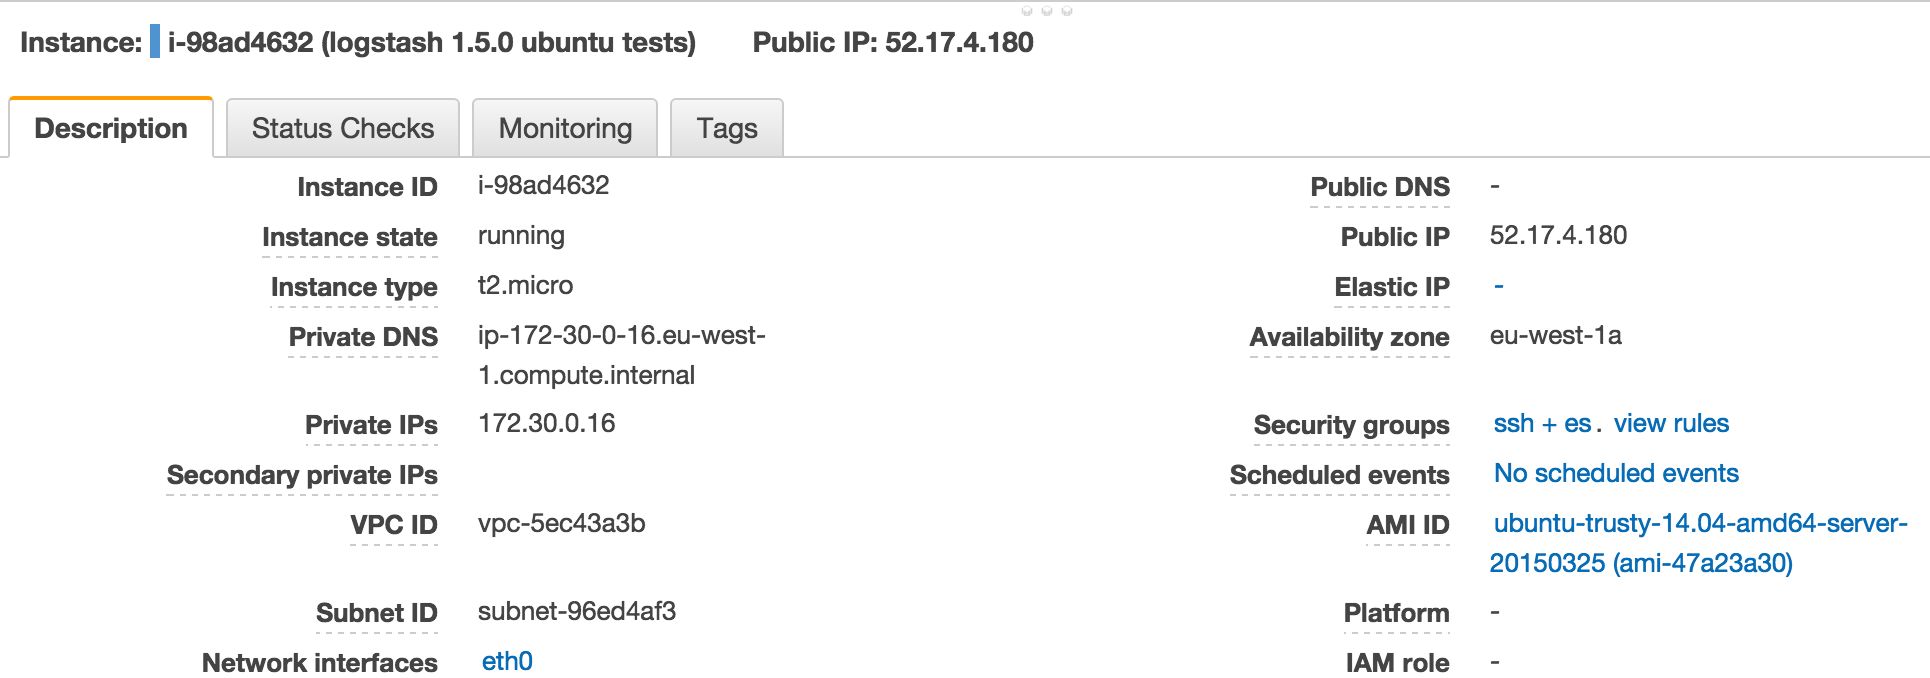
Then setup and start logstash:
wget http://download.elastic.co/logstash/logstash/logstash-1.5.2.tar.gz
tar -zxf logstash-1.5.2.tar.gz
cd logstash-1.5.2
bin/logstash -e "input { http { port => 9200 } } output { stdout { codec => rubydebug} }"
Why a VM? I needed Logstash to be accessible from the internet, and exposing a port on my home network router was complicated..
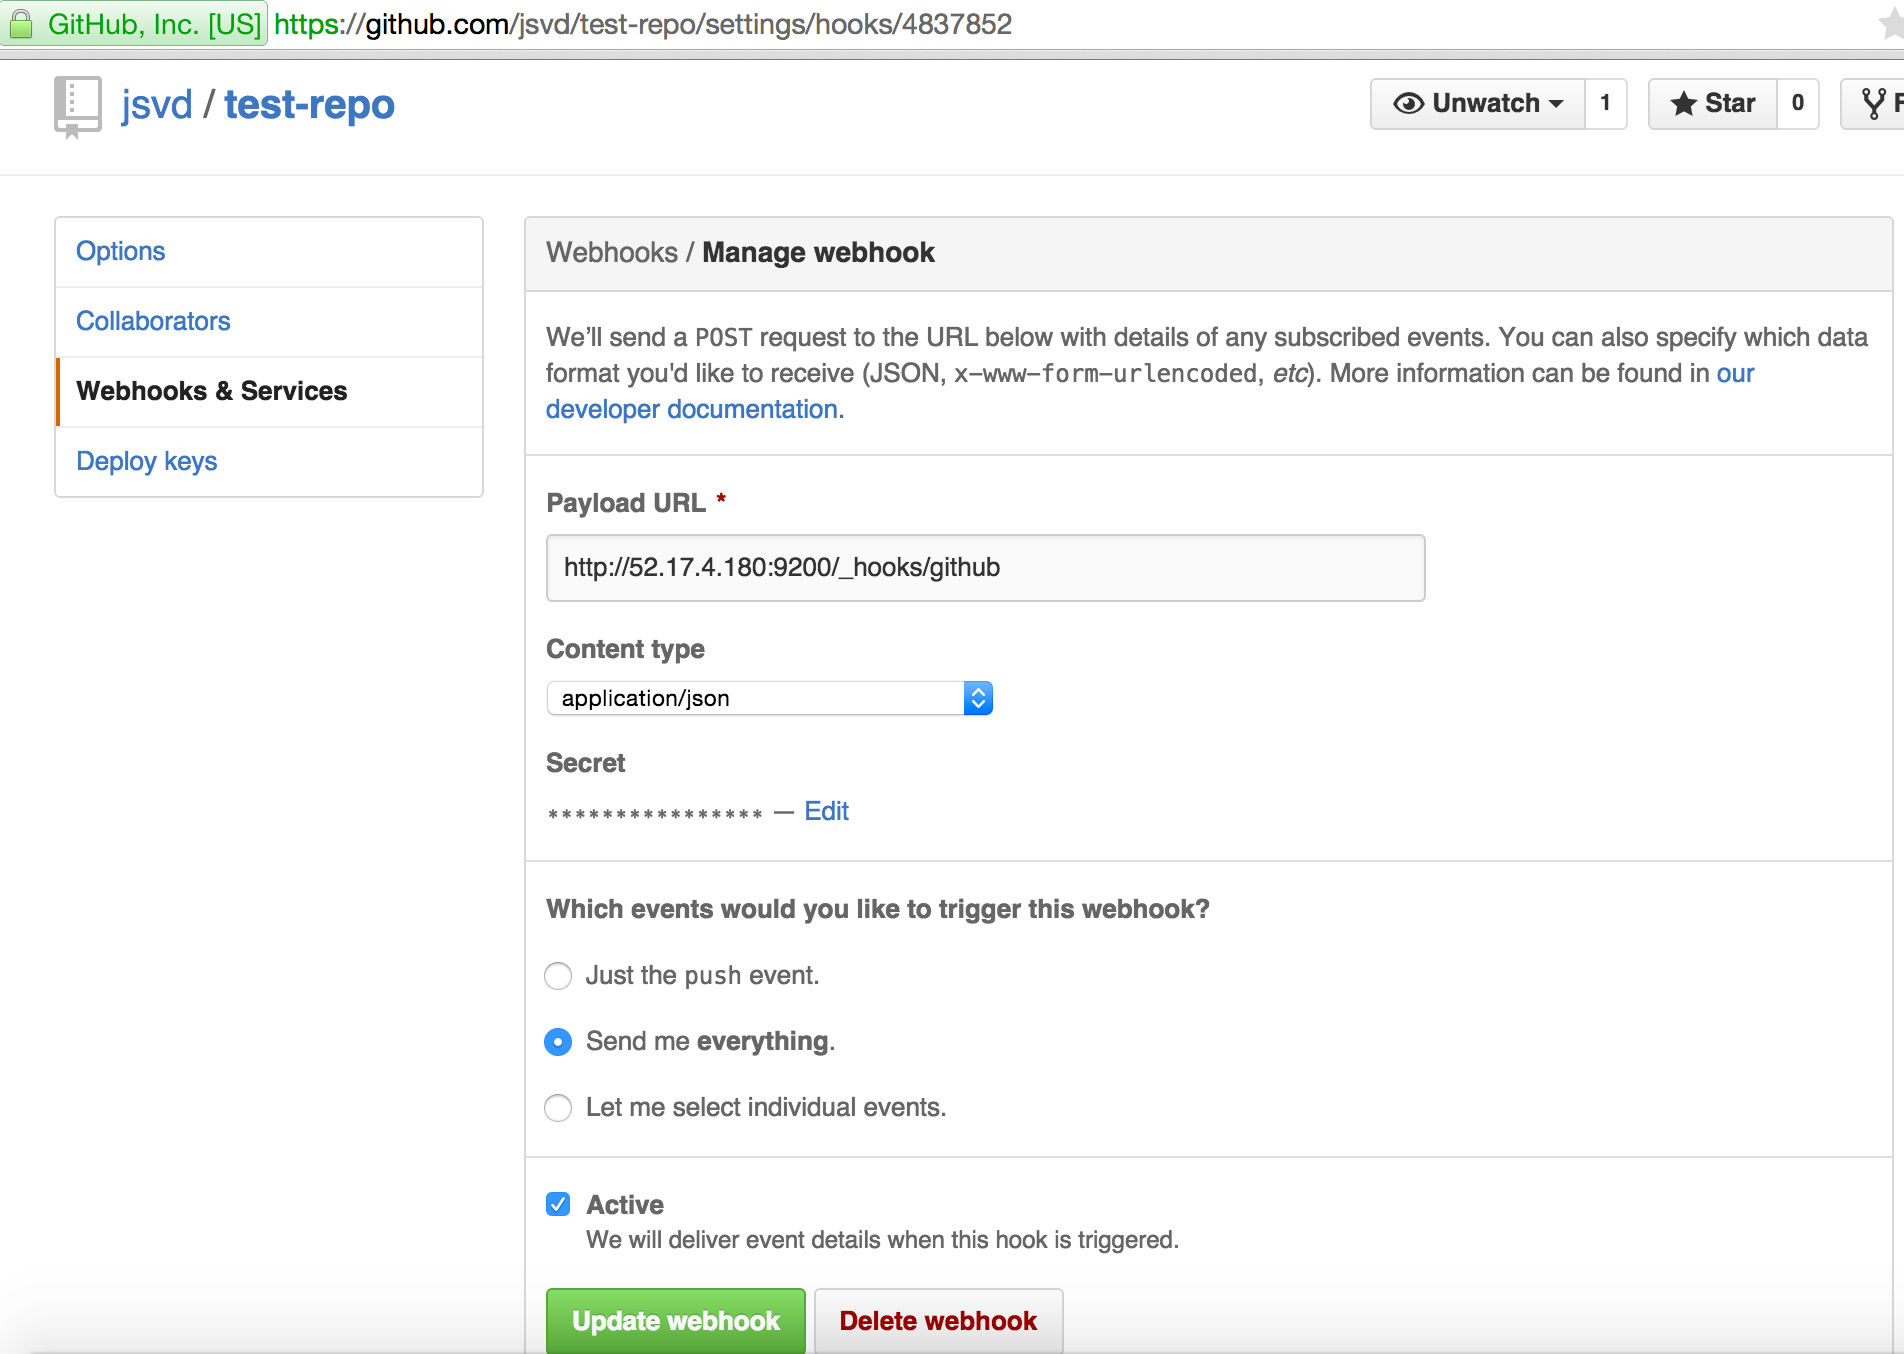
2. Github webhook setup
I created a GitHub repo under my account called test-repo. There I set up a webhook and pointed it at the VM:
3. Generating events
Let's generate 1 commit so GitHub will notify Logstash:
git clone https://github.com/jsvd/test-repo
cd test-repo
echo 1 >> a
git commit -a -m "new commit"
git push
4. Result
On the VM, Logstash received (output shortened for readability, full output here):
$ bin/logstash -e "input { http { port => 9200 } } output { stdout { codec => rubydebug} }"
{
            "ref" => "refs/heads/master",
         "before" => "22dc008b4a9a612ff3fc55b02fabd551a582e271",
          "after" => "9046cd06b307dec789248a72c9f36630decc037a",
        "created" => false,
        "deleted" => false,
         "forced" => false,
       "base_ref" => nil,
        "compare" => "https://github.com/jsvd/test-repo/compare/22dc008b4a9a...9046cd06b307",
        "commits" => [
        [0] {
                   "id" => "9046cd06b307dec789248a72c9f36630decc037a",
             "distinct" => true,
              "message" => "new commit",
            "timestamp" => "2015-06-02T14:58:14+01:00",
                  "url" => "https://github.com/jsvd/test-repo/commit/9046cd06b307dec789248a72c9f36630decc037a",
               "author" => {
                    "name" => "Joao Duarte",
                   "email" => "XXXXXXXXXXXX",
                "username" => "jsvd"
            },
            "committer" => {
                    "name" => "Joao Duarte",
                   "email" => "XXXXXXXXXXXX",
                "username" => "jsvd"
            }
        }
    ],
    "head_commit" => {
               "id" => "9046cd06b307dec789248a72c9f36630decc037a",
         "distinct" => true,
          "message" => "new commit",
        "timestamp" => "2015-06-02T14:58:14+01:00",
              "url" => "https://github.com/jsvd/test-repo/commit/9046cd06b307dec789248a72c9f36630decc037a",
           "author" => {
                "name" => "Joao Duarte",
               "email" => "XXXXXXXXXXXX",
            "username" => "jsvd"
        },
        "committer" => {
                "name" => "Joao Duarte",
               "email" => "XXXXXXXXXXXX",
            "username" => "jsvd"
        }
    }
}
Conclusion
This input plugin opens up an incredible amount of possible scenarios since a lot of applications use webhooks and know how to export data using HTTP requests.
I'm already thinking of a ton of ideas where I can leverage this plugin, how are you going to use it?