Easier data onboarding with Elastic Agent and Ingest Manager
Editor's Note: Elastic Agent and Fleet are now generally available (GA)! Read our latest blog post to learn more.
Today, we are happy to announce a major improvement that will make it easier to send data into the Elastic Stack. First, we are launching an experimental release of our Elastic Agent, which is a single, unified agent that makes installation and management easier.
Second, we are launching Ingest Manager, a new app in Kibana that lets you quickly add integrations for popular services and platforms in a few clicks. It will also help you centrally manage an entire fleet of Elastic Agents.
This experimental release will showcase our vision for the future and allow you to try out our new solution. There is no migration path for future releases so you must test in a dedicated cluster.
The challenges of ingesting data at scale
A critical factor when choosing a monitoring solution is how easily you can ingest data from your applications and platforms. Time spent setting up and managing solutions adds to your total cost of ownership.
Beats are the current solution for shipping data to the Elastic Stack and they make many things easier over generic solutions like syslog. However, when users get started for the first time, they must install modules on the command line, edit long YAML files, copy in a password, or configure and use the keystore. We want to make getting started as simple as running a single command.
As users' adoption of the Elastic Stack grows, they discover that we currently have a total of seven Beats in addition to APM agents, APM server, endpoint security, and more. Installing this many binaries is complex, particularly in enterprise environments where each binary involves installation via configuration management solutions, progressive deployments, change management, and audit requirements.
Another challenge is the process of adding integrations for new data sources. Today, users must edit YAML files and upload them to all their servers. They often use tools like Ansible or Chef to push out configurations. Unfortunately, this makes adding a new data source a complex process that often requires third-party tools and coordinating across teams. This is even more complex when dealing with hundreds of thousands of agents spread across multiple networks and data centers
Introducing Elastic Agent and Ingest Manager
Elastic Agent is a single, unified way to add monitoring for logs, metrics, and other types of data to each host. You no longer need to install multiple Beats and other agents. This will make it easier and faster to deploy across your infrastructure. Additionally, Elastic Agent has a single, unified configuration. Thus, there is no need to edit multiple configuration files for Filebeat, Metricbeat, and others. This will make it easier to add integrations for new data sources.
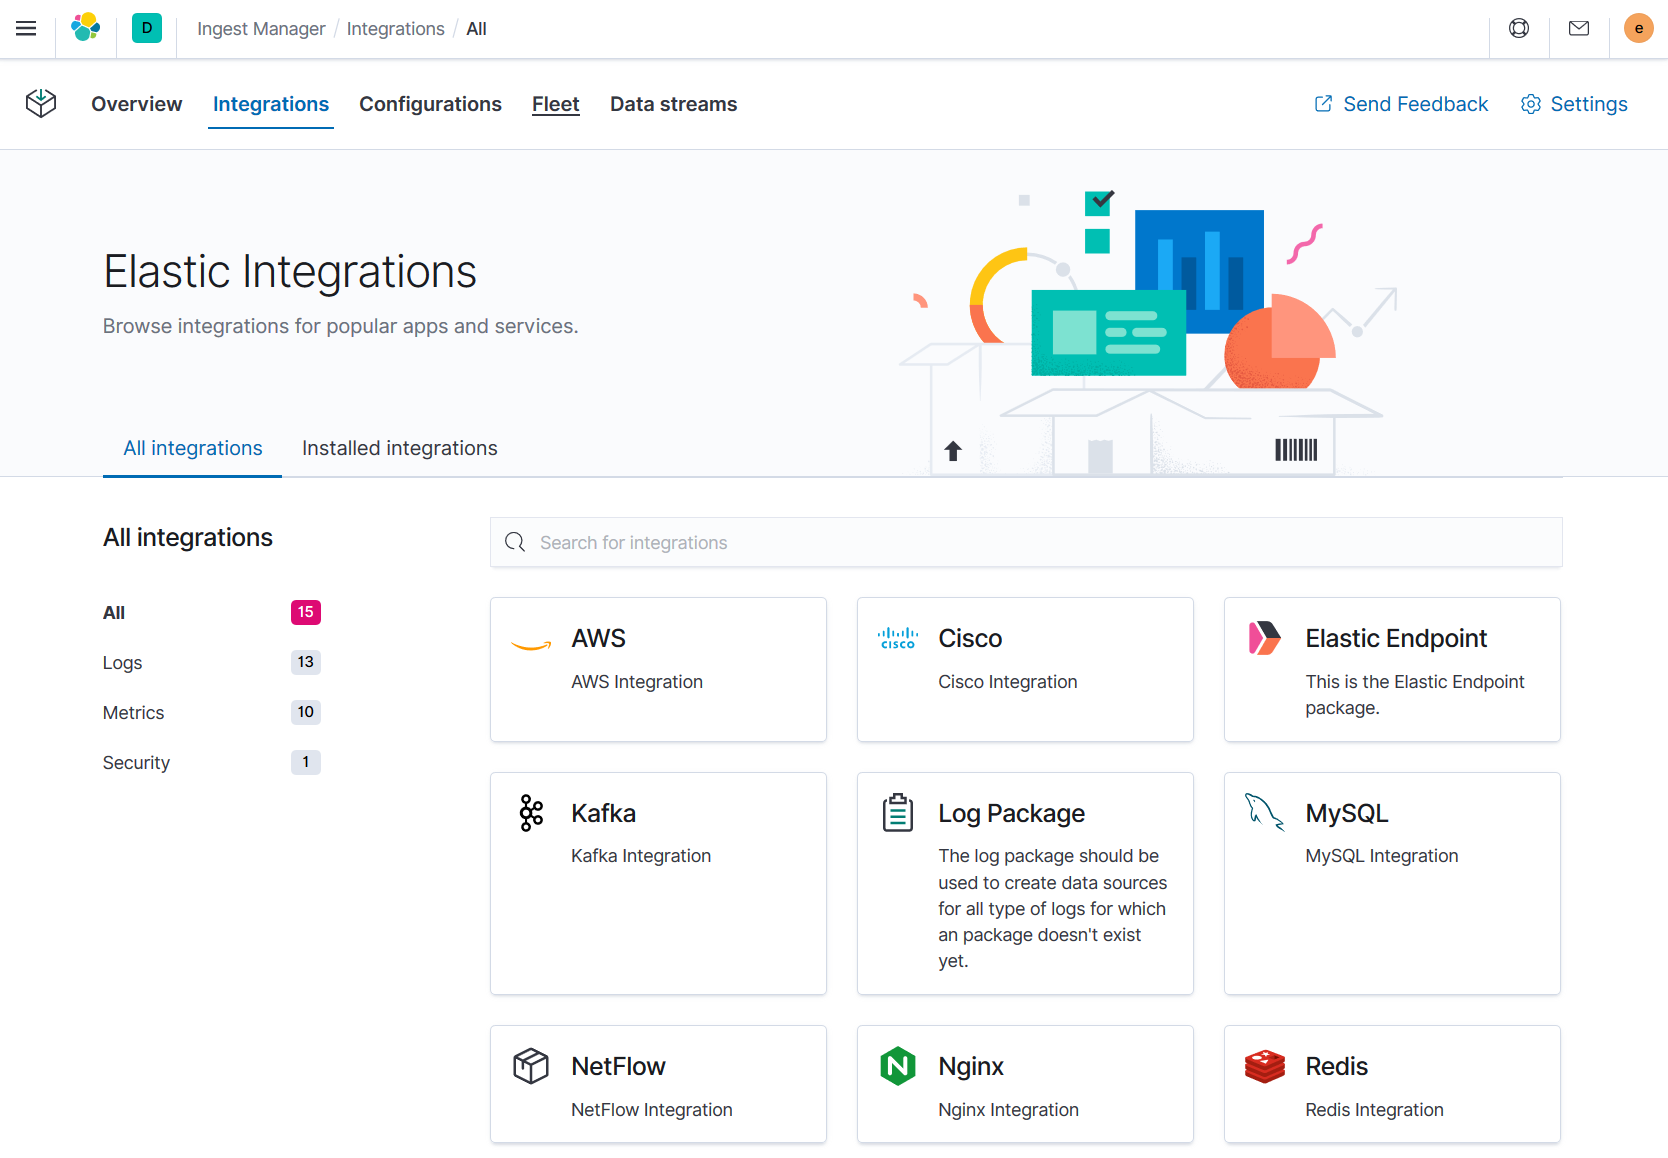
Ingest Manager provides a web-based Kibana UI to add and manage integrations for popular services and platforms. This release has support for nine integrations, and we plan to add support for our 100+ Beats modules over the next few releases. Our integrations not only provide an easy way to add new sources of data, but they also ship with out-of-the-box assets like dashboards, visualizations, and pipelines to extract structured fields out of logs. You don’t need to spend a lot of effort configuring the system because it’s done for you automatically for common services. This makes it easier to get insights within seconds.
Easier configuration
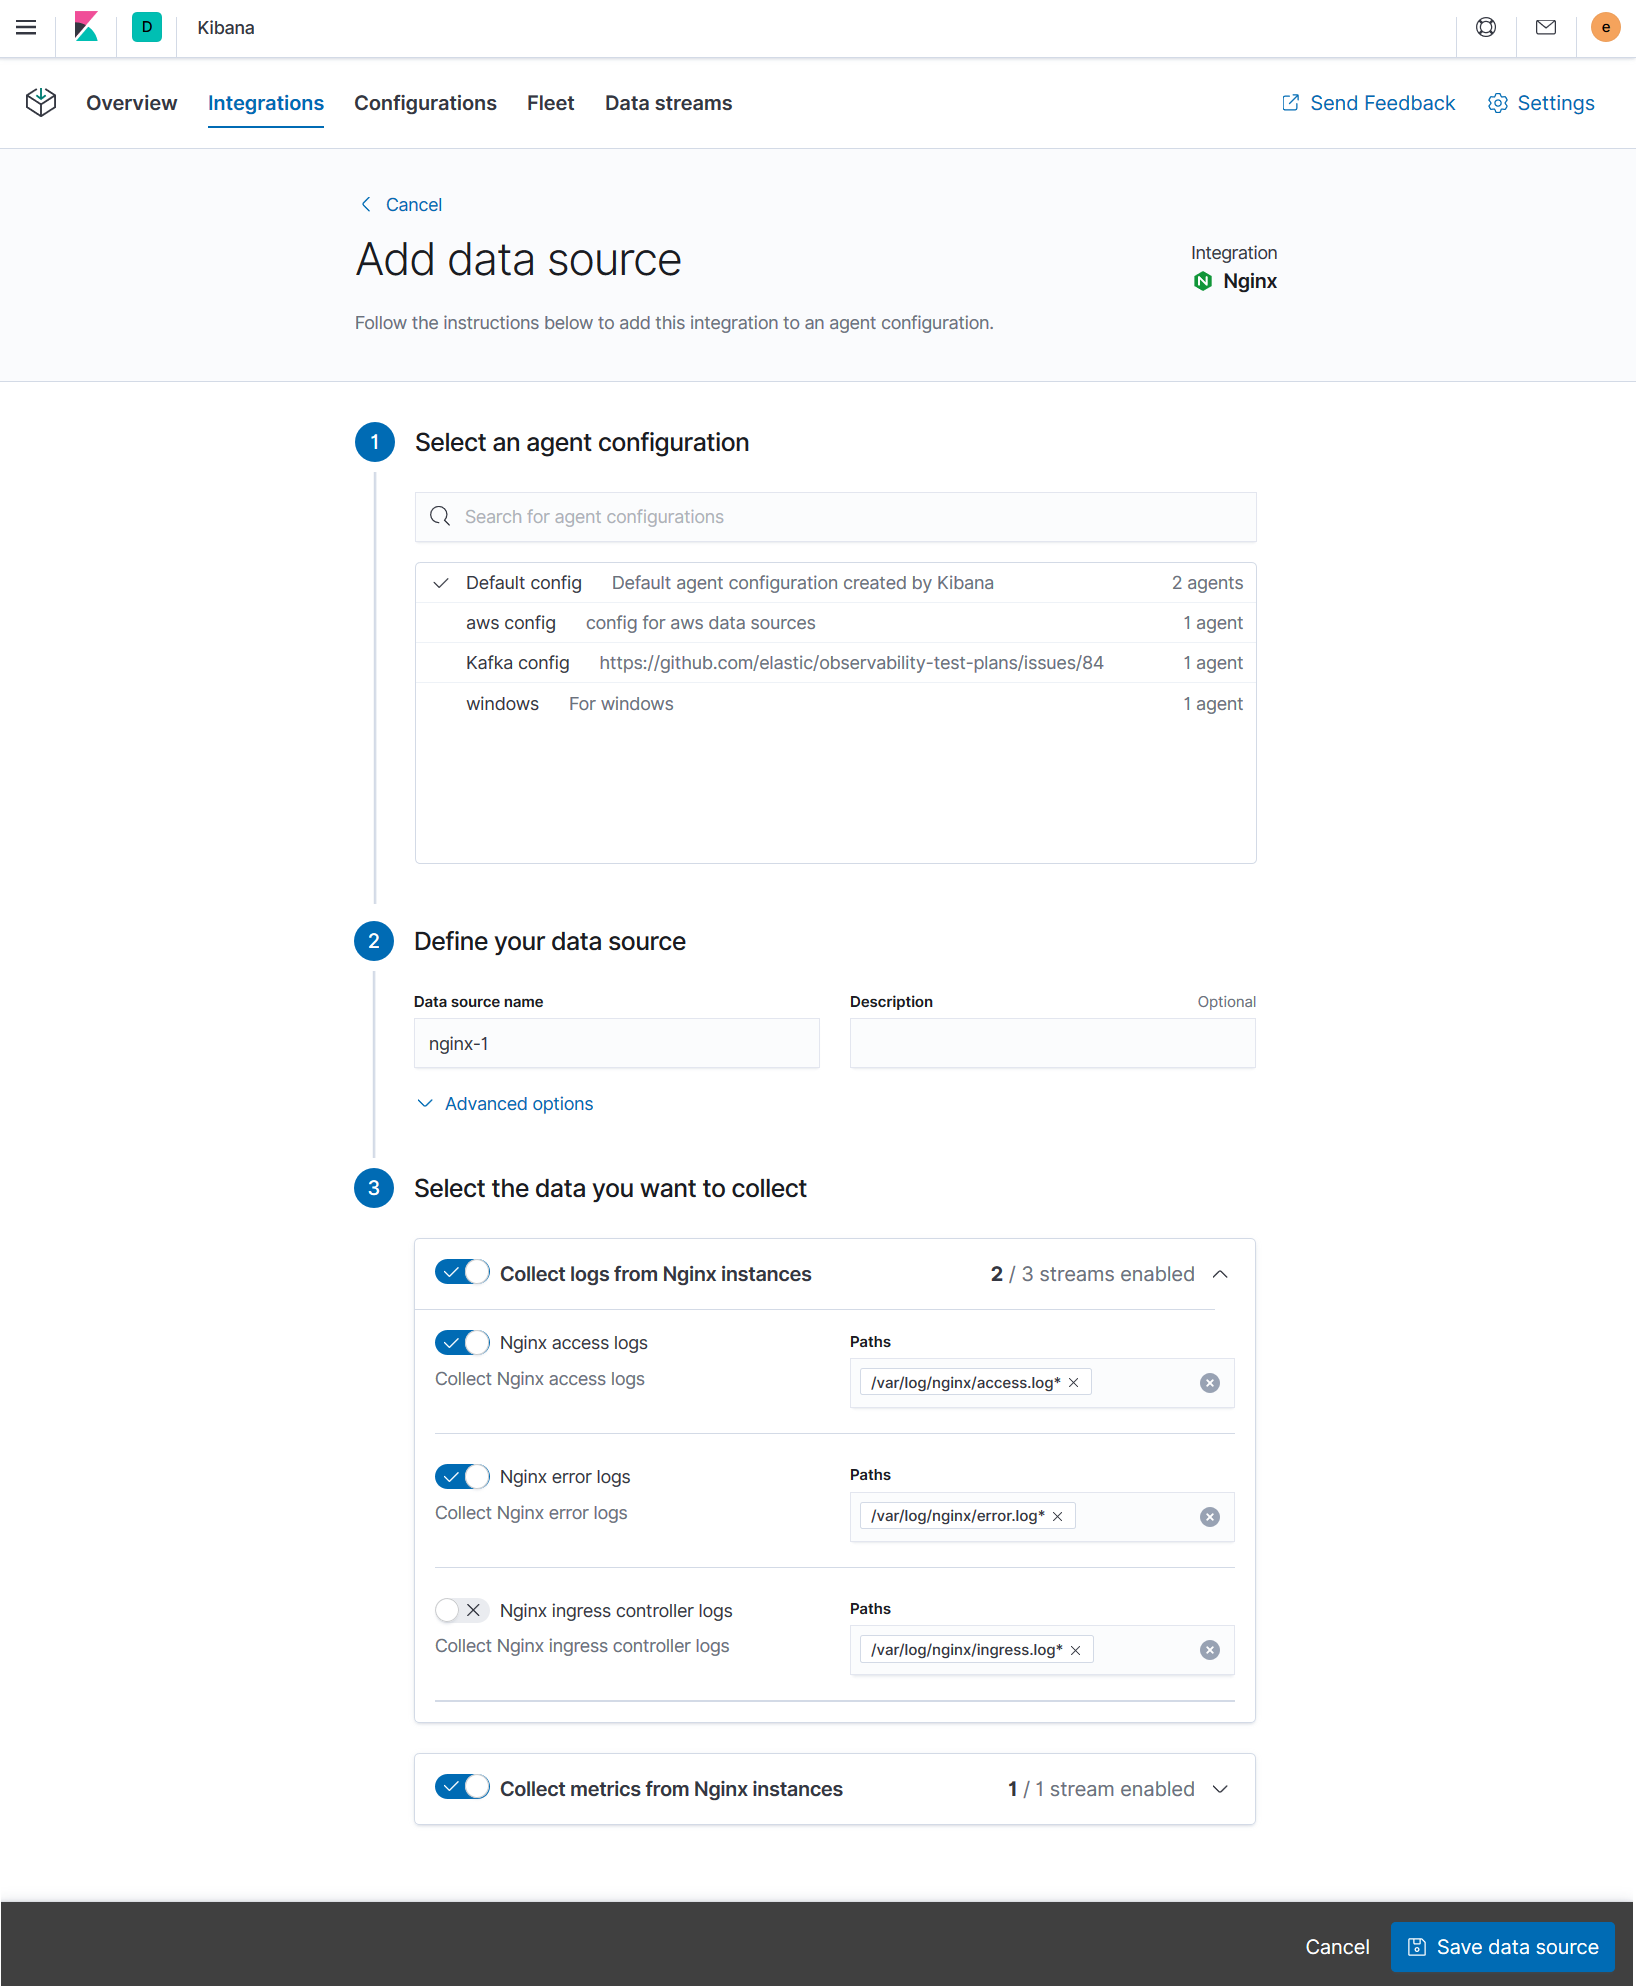
Configuring integrations is now easier thanks to our configuration editor UI. Instead of editing long YAML files with many irrelevant settings, we now provide a convenient, web-based UI that is more concise and offers guidance and validation.
In the screenshot above, users are invited to select an Elastic Agent configuration with the default already selected. The Elastic Agent configuration can be applied to multiple Elastic Agents. This makes it even easier to manage configuration at scale.
Next, users define their data source by supplying a name and description. They can then configure the path to their access and error logs. When the user is done, they may save the data source. This will add NGINX monitoring to all agents enrolled into the default agent configuration. The next time these agents check in, they will receive the update. Having those configurations automatically deployed is way more convenient than having to do it yourself using SSH, Ansible playbooks, etc.
Advanced users sometimes prefer YAML files and APIs. Ingest Manager has an API-first design and anything you can do in the UI you can also do using the API. This makes it easy to automate and integrate with other systems.
Centrally manage your Fleet
You can see the state of all your Elastic Agents on the Fleet page. Here you can see which agents are online, which have errors, and the last time they checked in. You can also see the version of the agent binary and configuration.
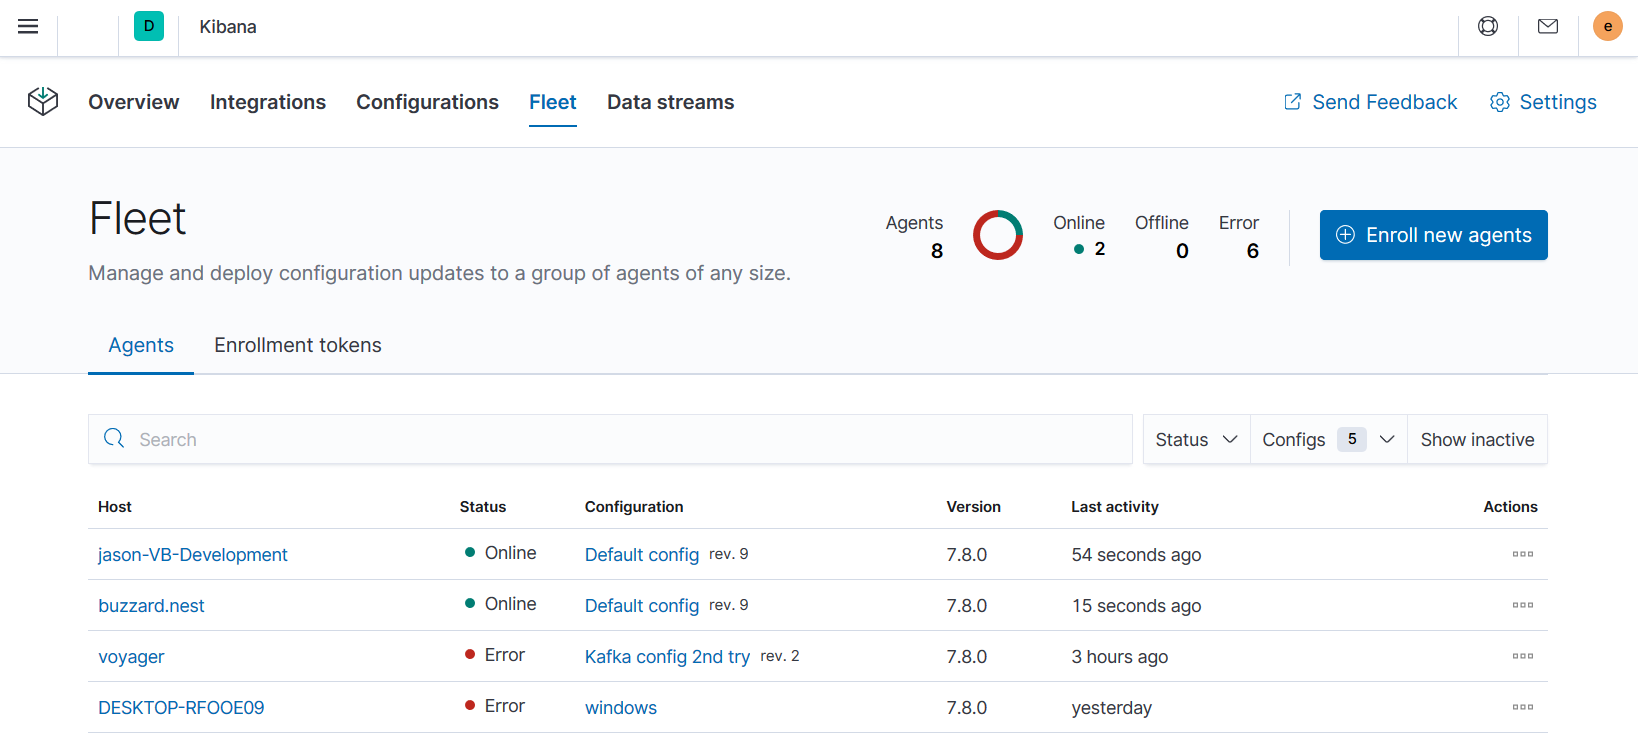
Fleet serves as the communication channel back to the Elastic Agents. Agents check in for the latest updates on a regular basis. You can have any number of agents enrolled into each agent configuration, which allows you to scale up to thousands of hosts. When you make a change to an agent configuration, all the agents receive the update during their next check in. You no longer have to distribute configuration updates yourself using SSH, Ansible playbooks, or other configuration methods.
Data streams make index management easier
The data collected by Elastic Agents is stored in indices that are more granular than you’d get by default with Filebeat. The advantages are that it gives users more visibility into the sources of data volume, and control over lifecycle management policies and index permissions. We call these new indices “data streams” and we will have more improvements on this concept in future releases.
In the screenshot below, you can see we’ve broken out the data streams (or indices) by data set, type, and namespace. The data set is defined by the integration and describes the fields and other settings for each index. For example, you might have one data set for process metrics with a field describing whether the process is running or not. Another data set for disk I/O metrics will have a field describing the number of bytes read. This solves the issue of having indices with hundreds or thousands of fields because we only need to store a small number of fields in each index. This makes them more compact with faster autocomplete, and as an added bonus the Discover page will only show relevant fields.
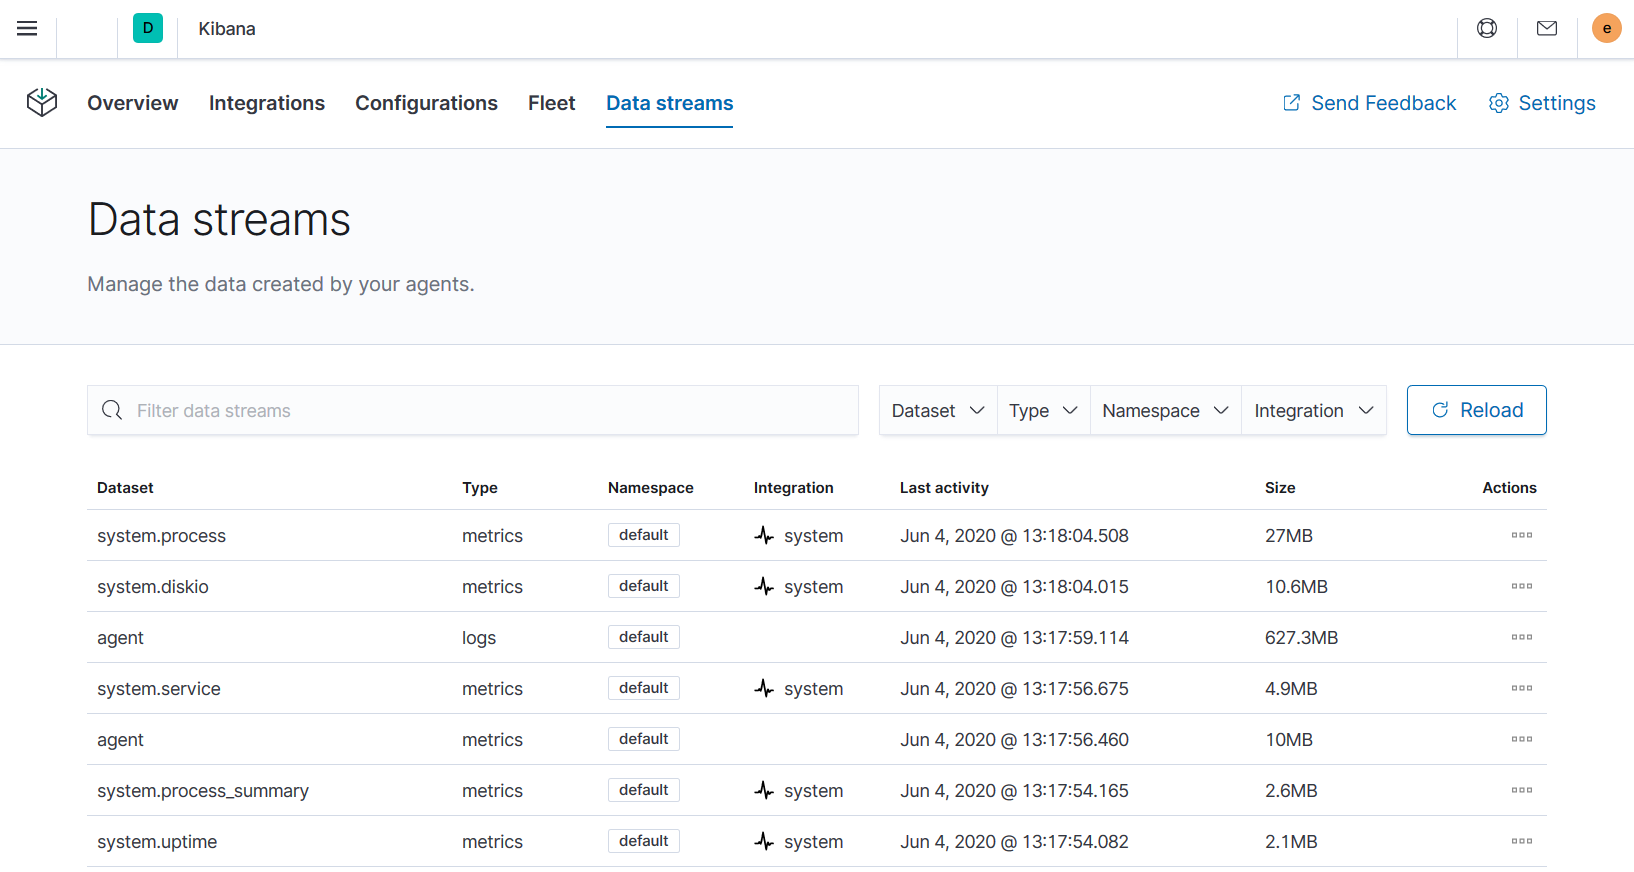
Namespaces are user-defined strings that allow you group data any way you like. For example, you might group your data by environment (prod, QA) or by team name. This makes it easier to search the data from a given source using index patterns, or to give users permissions to data by assigning an index pattern to user roles. Many of our customers already organize their indices this way, and now we are providing this best practice as a default out of the box.
The future of Beats and Beats Central Management
Beats are not going away and users can continue using them alongside Elastic Agent. In fact, the Elastic Agent runs Beats under the covers. Elastic Agent is a lightweight interface on top that allows for easier deployment and central management.
Beats Central Management is a beta version product that we released a few years ago for central management. As we learned more about our customers' use cases, we decided to redesign the system as our new Ingest Manager. Beats Central Management is deprecated and still works, but we do not officially support it.
Ingest Manager will replace Beats Central Management and make it easier to manage many agents at scale. This is an experimental release so we encourage you to wait until Ingest Manager is generally available (GA) before you use it in production.
Limitations of this release
This is an experimental release and there is no migration path for future releases, so you must test in a dedicated cluster. In a future release, we plan to add support for a new way of managing rolling indices that will make the experience easier for users. However, any data stored in this release will not be migrated in our next release and you must wipe any data and settings changed in Kibana and Elasticsearch to avoid future conflicts. We recommend using a dedicated test cluster or deployment that can be deleted when you are done.
Ingest Manager is currently only available to users with the superuser role. This role is necessary to create indices, install integration assets, and update agent configurations. In order to use Fleet, the Elastic Agents must have a direct network connection to Kibana. It’s also possible to run the Elastic Agents in standalone mode in cases where a network connection is not available or not needed.
Furthermore, this release only includes support for nine integrations with more coming in future releases:
- System logs and metrics
- Custom logs
- AWS
- Nginx
- Redis
- Mysql
- Kafka
- Cisco devices
- Netflow logs
You can read more about the limitations of this release in our documentation. Experimental releases are not officially supported, but we encourage you to report issues in our discuss forum.
Try it out
You can try out the new Elastic Agent and Ingest Manager yourself. You may download Elastic Agent from our downloads page. The easiest way to get started is to create a new cloud deployment for testing. Since this is an experimental release, it should only be used in a dedicated test environment that can be deleted when you are done.
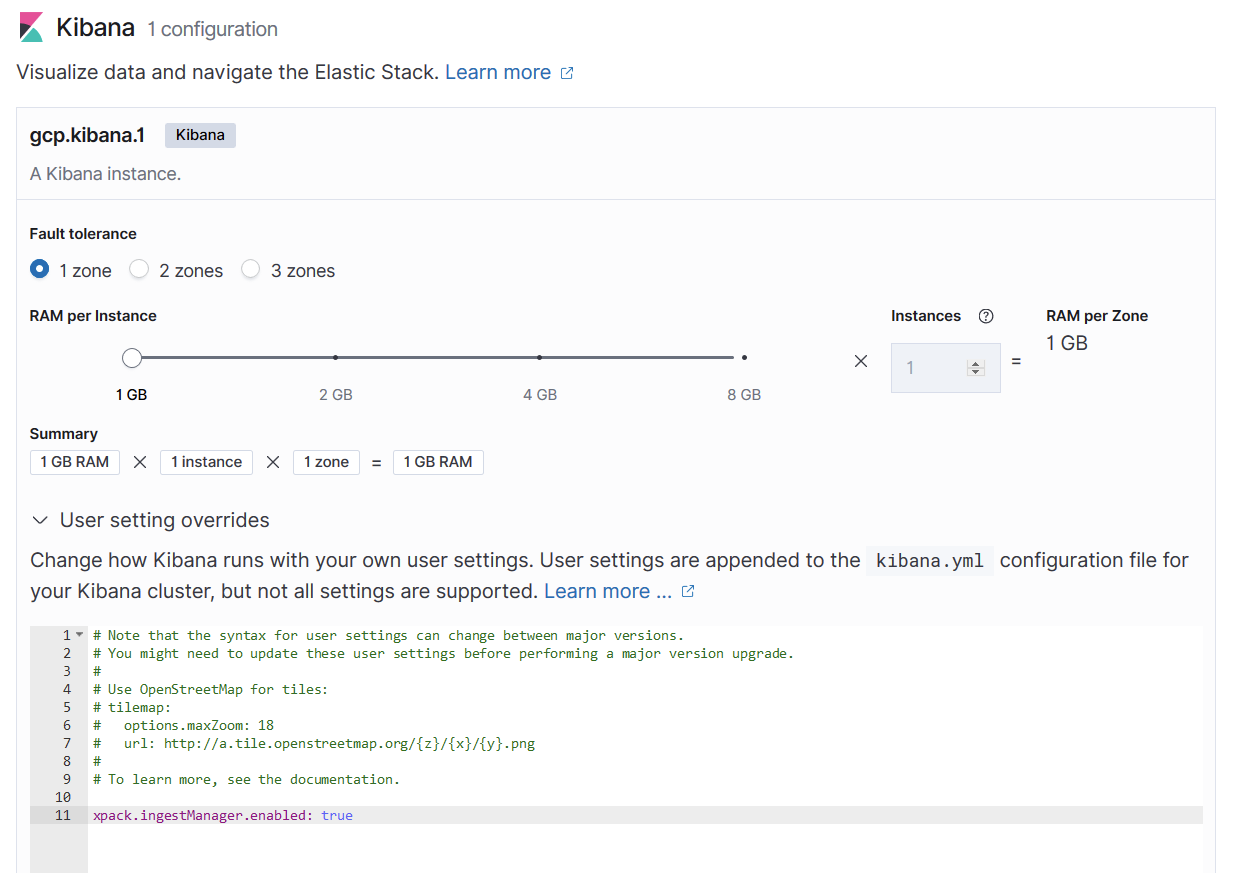
Next, you must enable Ingest Manger by turning on a flag. This step is only temporary for the current release and Ingest Manager will be enabled by default in future releases. On the create deployment page, enter the flag below as a user settings override to enable Ingest Manager.
xpack.ingestManager.enabled: true
It can be difficult to find the user settings overrides, so see the screenshot below. It’s at the bottom of the Kibana configuration box.
On-prem clusters require a few extra steps like enabling security, so please see our documentation on how to enable Ingest Manager in this situation.
The first time you open this app, it will ask you to enable Fleet for central management. On the Overview page, click the button to “Enroll a new agent.” When the flyout opens, follow the instructions to enroll and run the Elastic Agent. Learn more in our Ingest Manager documentation.
We are making the current release of Elastic Agent and Ingest Manager free and open. We would like to encourage collaboration with the community so you can find the code on GitHub for Elastic Agent and Ingest Manager.
More coming soon!
This is just the first release of an exciting new product. We hope it shows the vision of how we’re making ingestion easier with the Elastic Stack. It will get even better with each release and we’re excited to have the community with us on this journey. Please feel free to share your thoughts in our forums.