Elastic Observability 8.4: Smarter alert management, new K8s dashboards, and more

 Share on Twitter
Share on Twitter

 Share on LinkedIn
Share on LinkedIn

 Share on Facebook
Share on Facebook

 Share by Email
Share by Email

 Print this page
Print
Elastic Observability 8.4 introduces smarter alert and incident management, improved Kubernetes visibility, and simplified APM instrumentation for OpenTelemetry and AWS cloud services. These enhancements further accelerate root cause analysis and streamlined data onboarding in complex, cloud-native environments.
These new features allow customers to:
- Easily access and triage all observability incidents and alerts from a consolidated view
- Get cluster-level visibility into essential Kubernetes components with new ready-to-use customizable dashboards
- Auto-instrument calls to native AWS services, including Amazon S3, SNS, SQS, and DynamoDB
Accelerate problem resolution with smarter alert management for AIOps
Modern applications rely on a host of systems, services, and platforms in order to deliver business-critical functionality. AIOps-driven alert and incident management is crucial for proactively detecting, triaging, investigating, and resolving anomalies in these complex environments. Without the ability to automate anomaly detection and proactively alert on when something is wrong, IT teams would be at the mercy of manually scouring countless monitoring dashboards trying to visually gauge if everything looks normal.
Problems can occur on any layer — infrastructure, application, or user experience — and can be detected through any data type — logs, technical and business metrics, traces, or synthetic tests. Site Reliability Engineers (SREs) who are tasked with keeping all systems up and running need to be able to provide detailed specifications for alerting rules on any data type or layer, comprehensively review all the alerts in a single view in order to evaluate their importance and prioritize investigations, and easily navigate the available data to establish causal links.
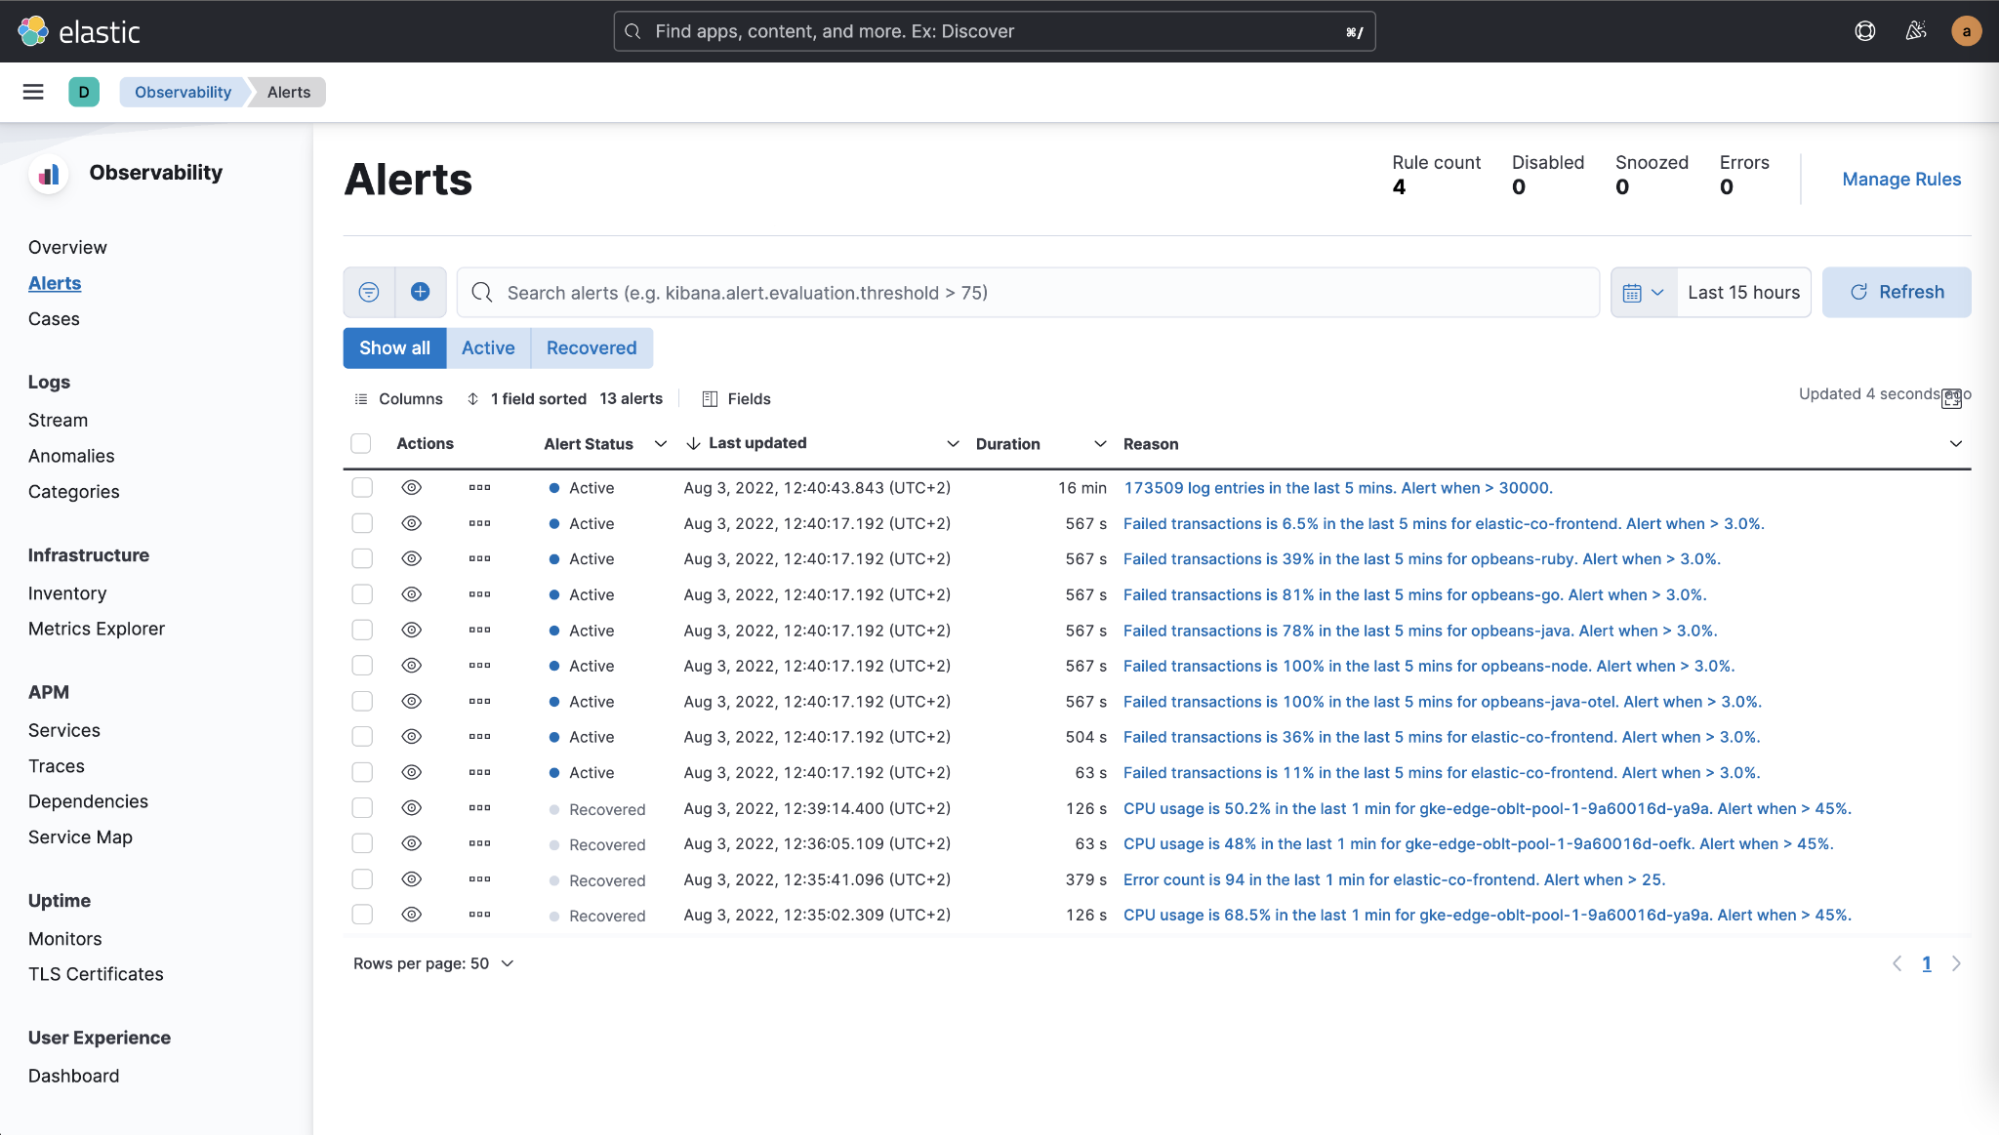
With Elastic Observability 8.4, SREs have a dedicated control plane for alert and incident management and collaboration from which to:
- Easily access and manage all observability rules and alerts from within the Observability UI
- Group related alerts and relevant data into Cases for further investigation
- Leverage comprehensive filter and search options to surface alerts of interest
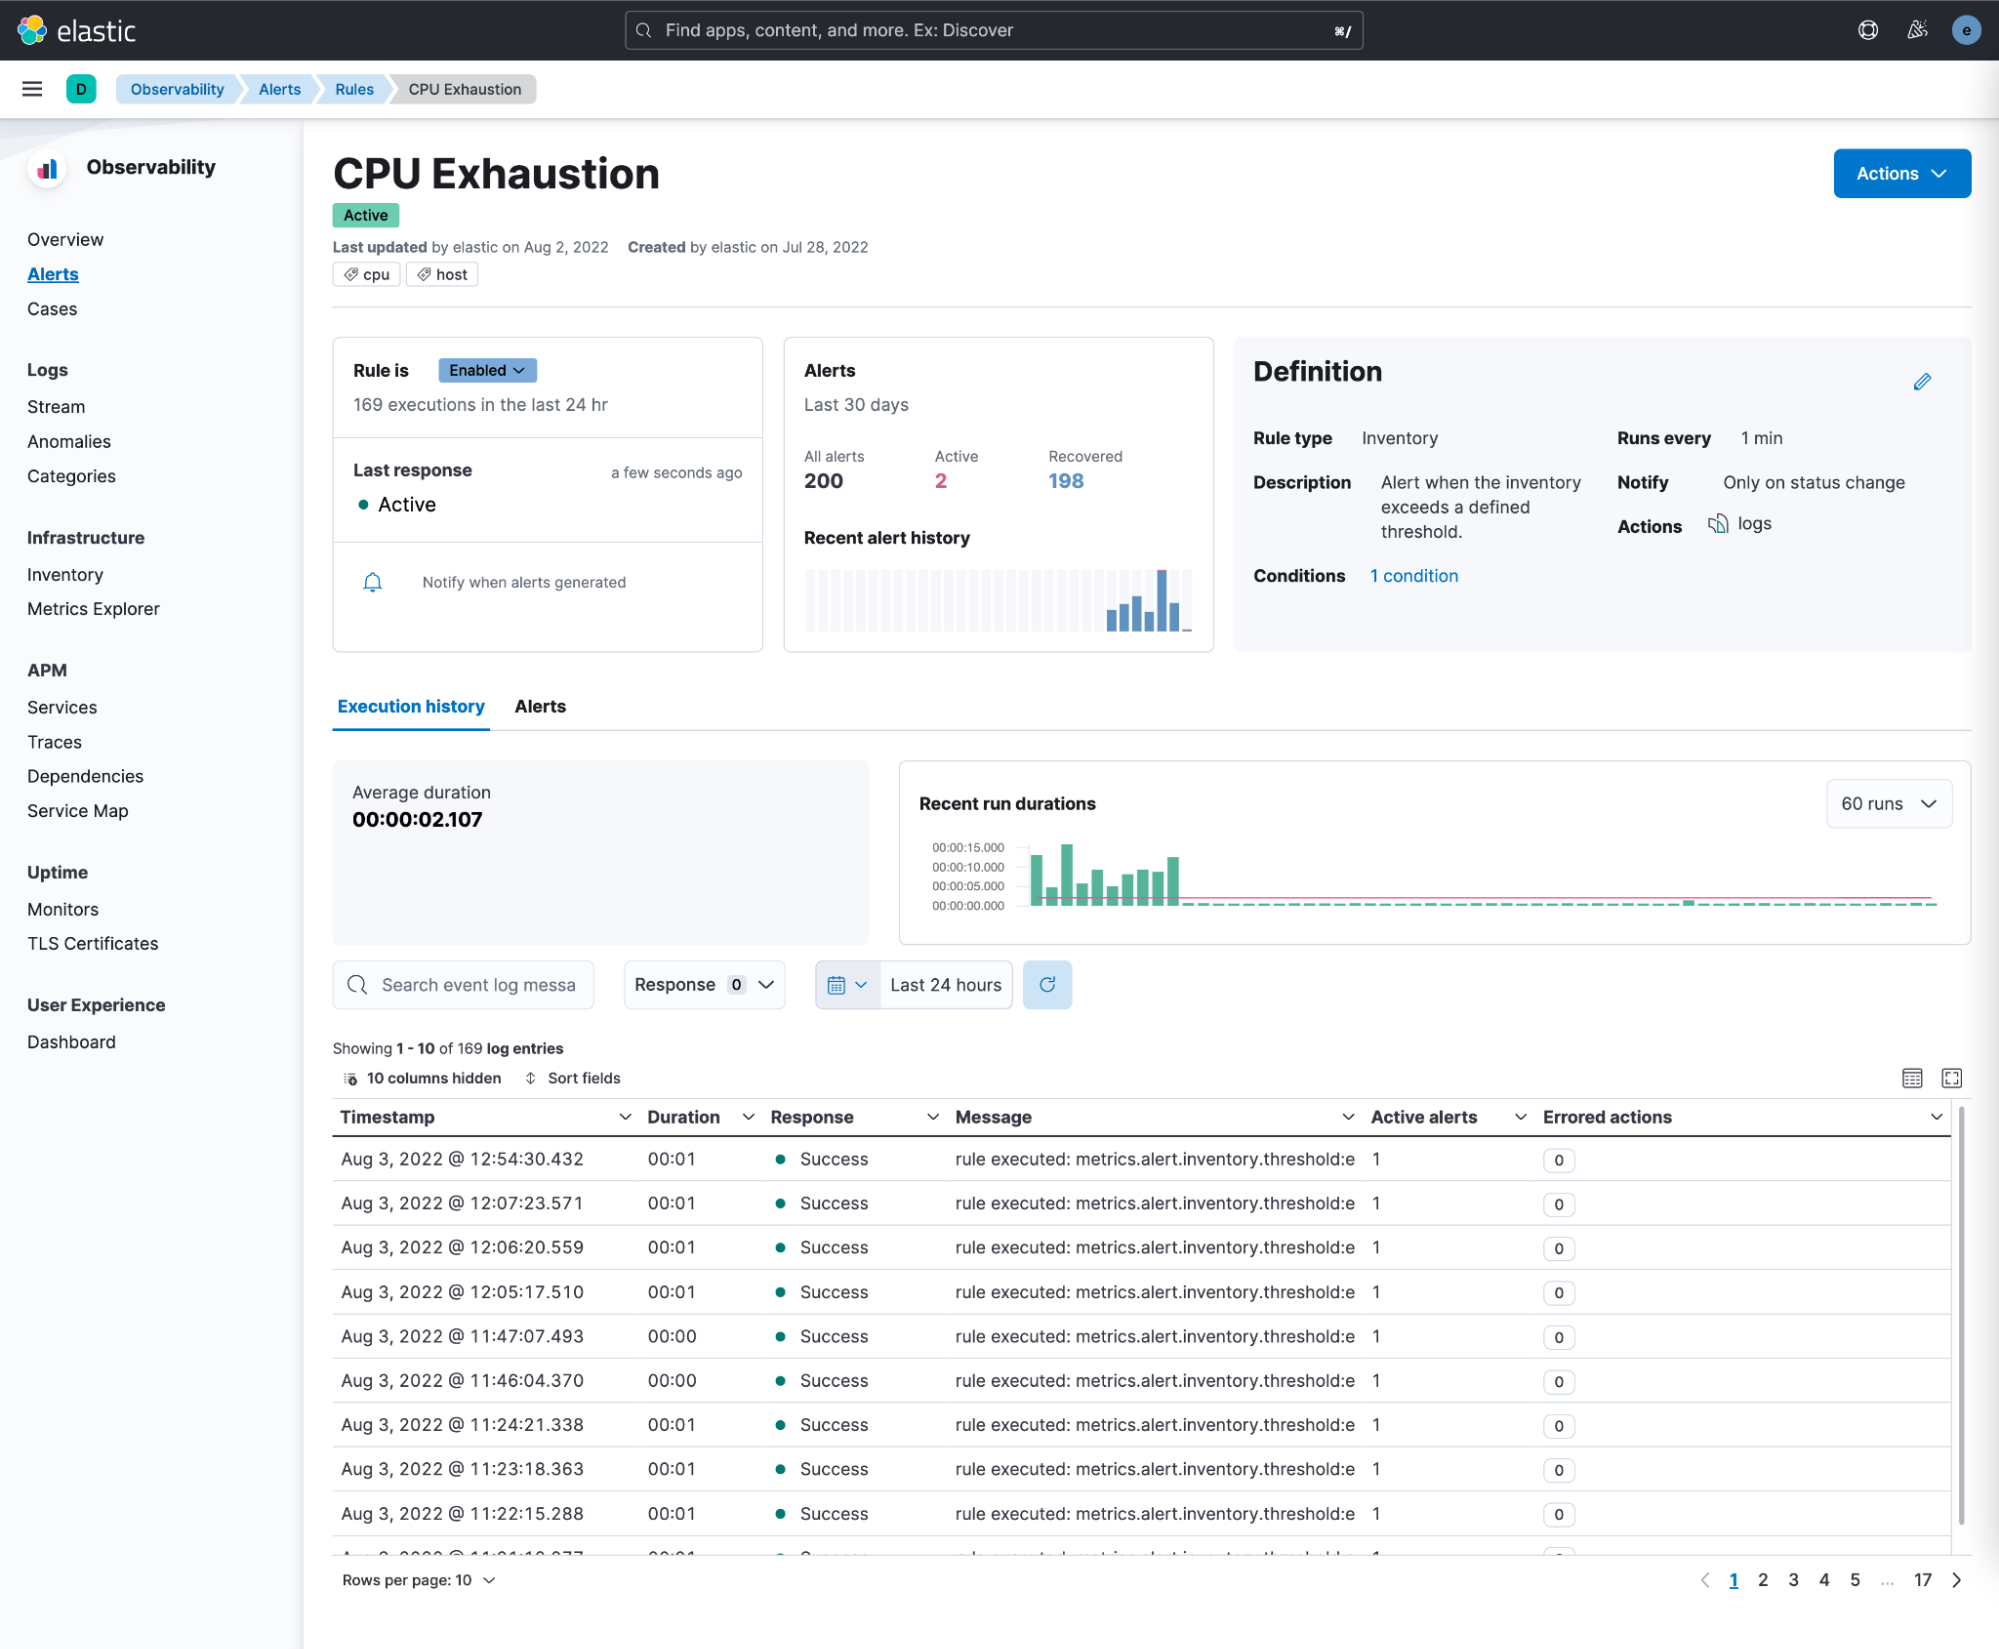
- Get granular control over alerting rules with more extensive rule execution details
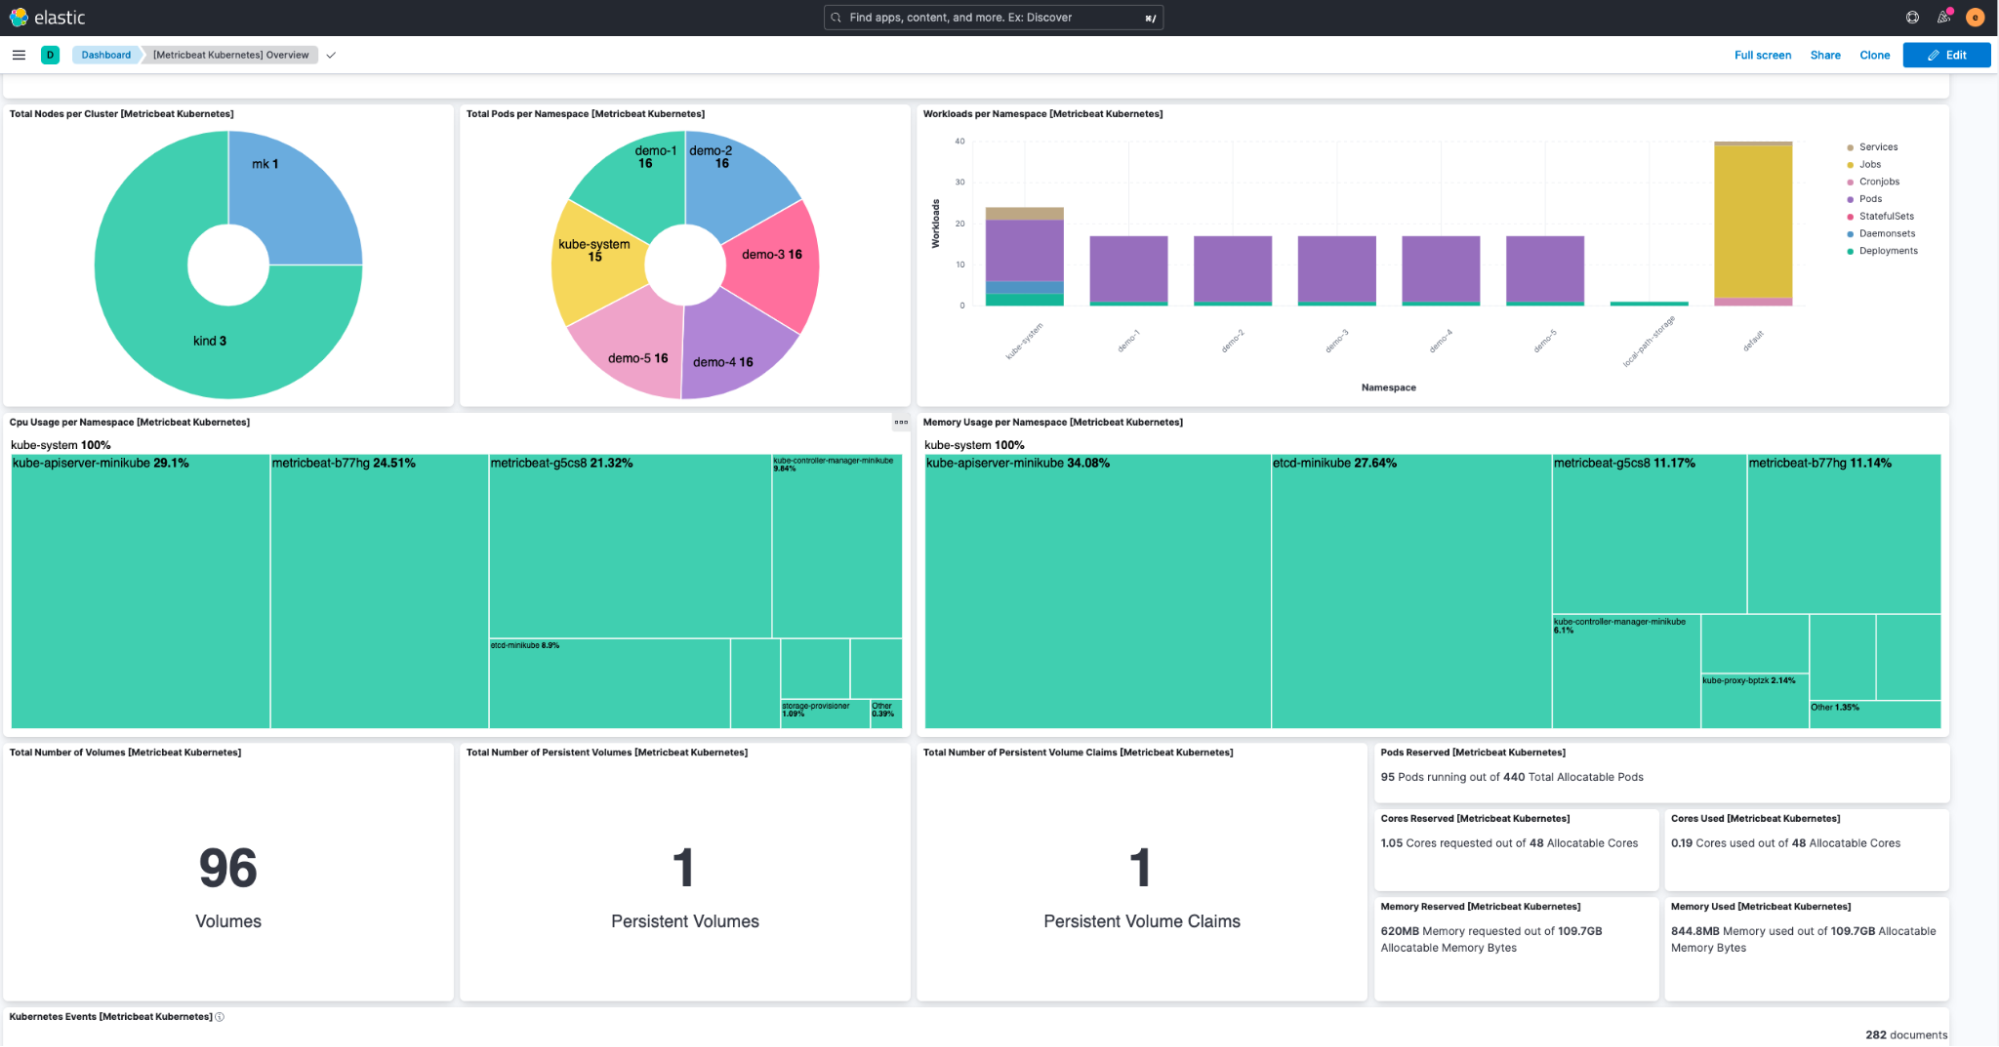
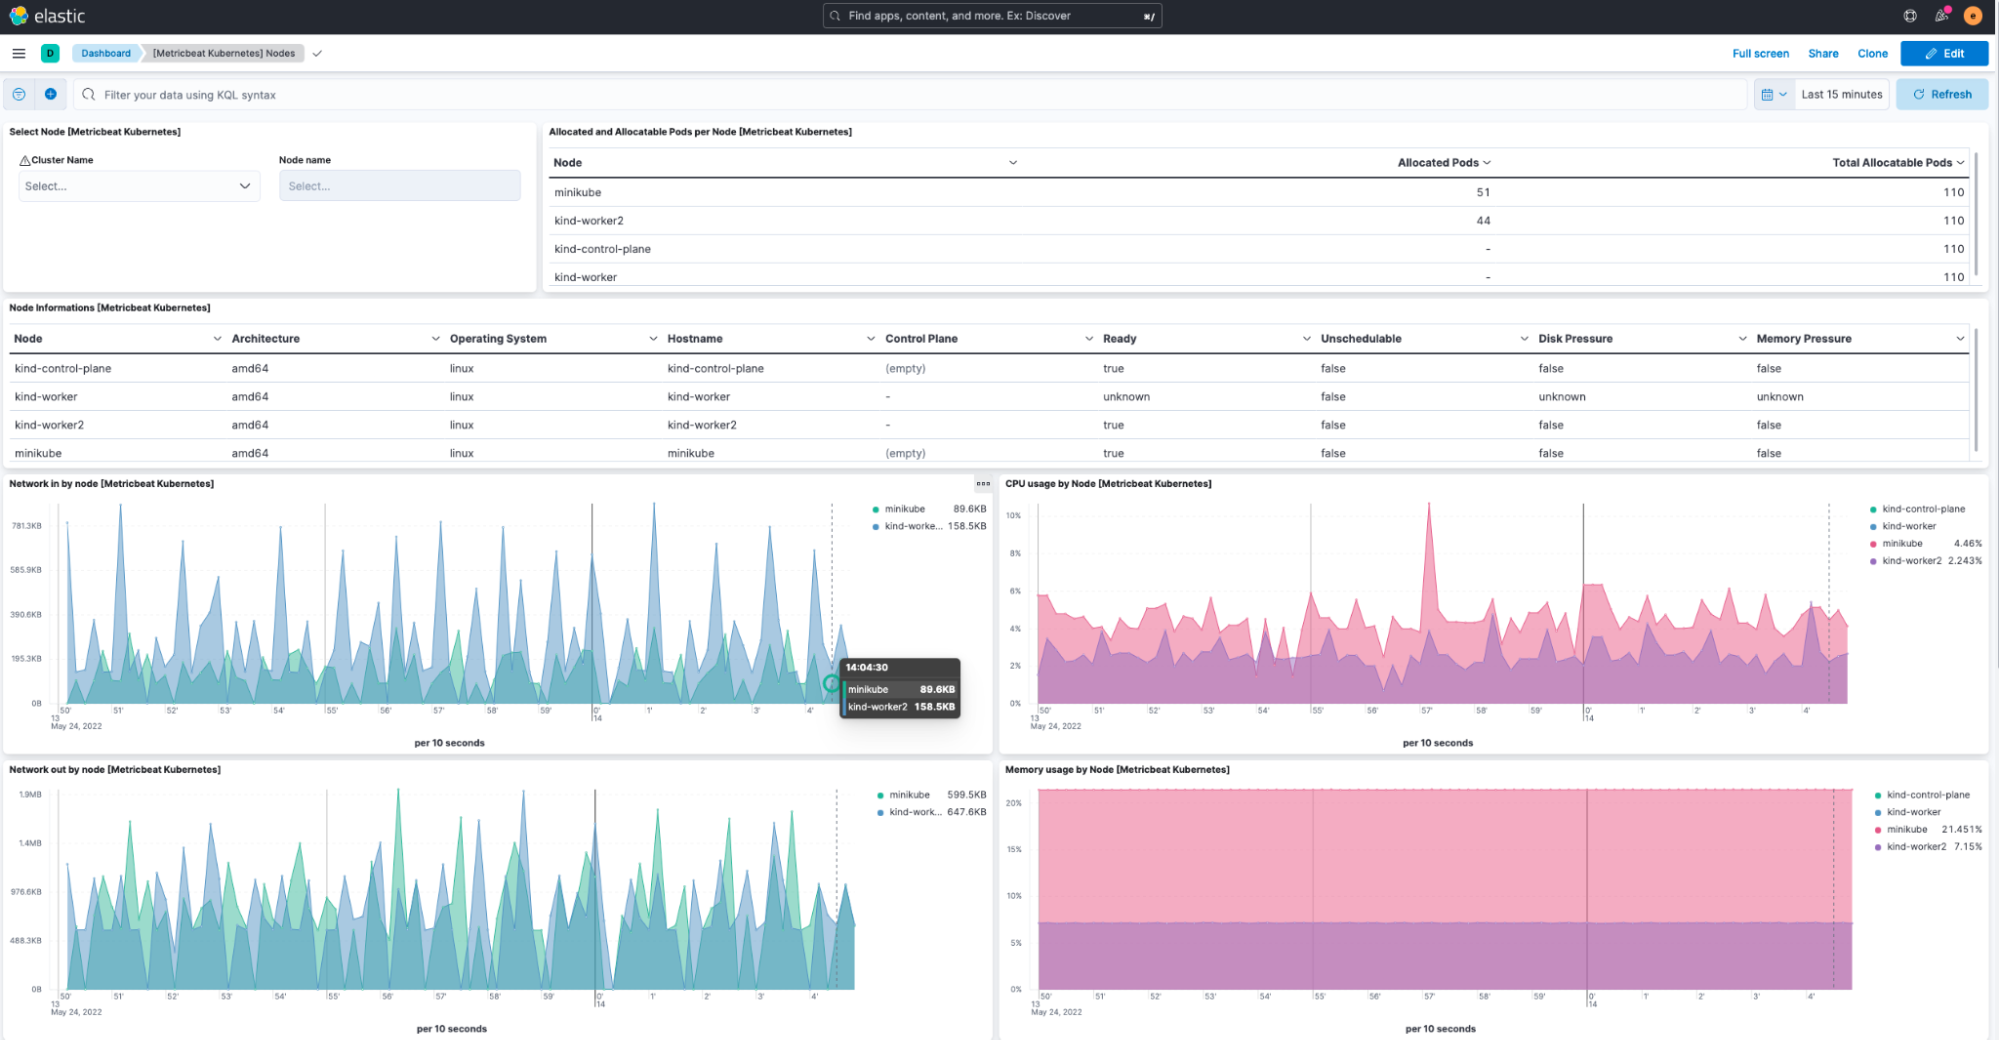
Improved visibility for Kubernetes with ready-to-use dashboards
With Elastic Observability 8.4, ITOps and SRE teams can leverage Elastic out-of-the-box Kubernetes dashboards for cluster-level visibility into essential Kubernetes components (nodes, pods, deployments, etc.). Notable features include:
- Highly customizable dashboards – users can use Kibana Lens to update or remove panels, or create new panels using the smart suggestion capability
- Improved navigation between related Kubernetes components and dashboards with Kibana’s drill-down capability
Enhanced APM observability, including simplified instrumentation for AWS Cloud and OpenTelemetry
With Elastic Observability 8.4, Elastic APM agents can add auto-instrumentation for calls to native AWS services, including Amazon S3, SNS, SQS, and DynamoDB, further simplifying out-of-the-box observability for cloud-based applications. These calls are immediately populated in the APM user interface and can be correlated with other observability data for root cause analysis.
Elastic has also simplified data onboarding for OpenTelemetry-instrumented applications. With this enhancement, SDE and DevOps teams can more quickly and easily instrument these applications by following a few basic steps with copy-and-paste configuration and easy-to-follow documentation.
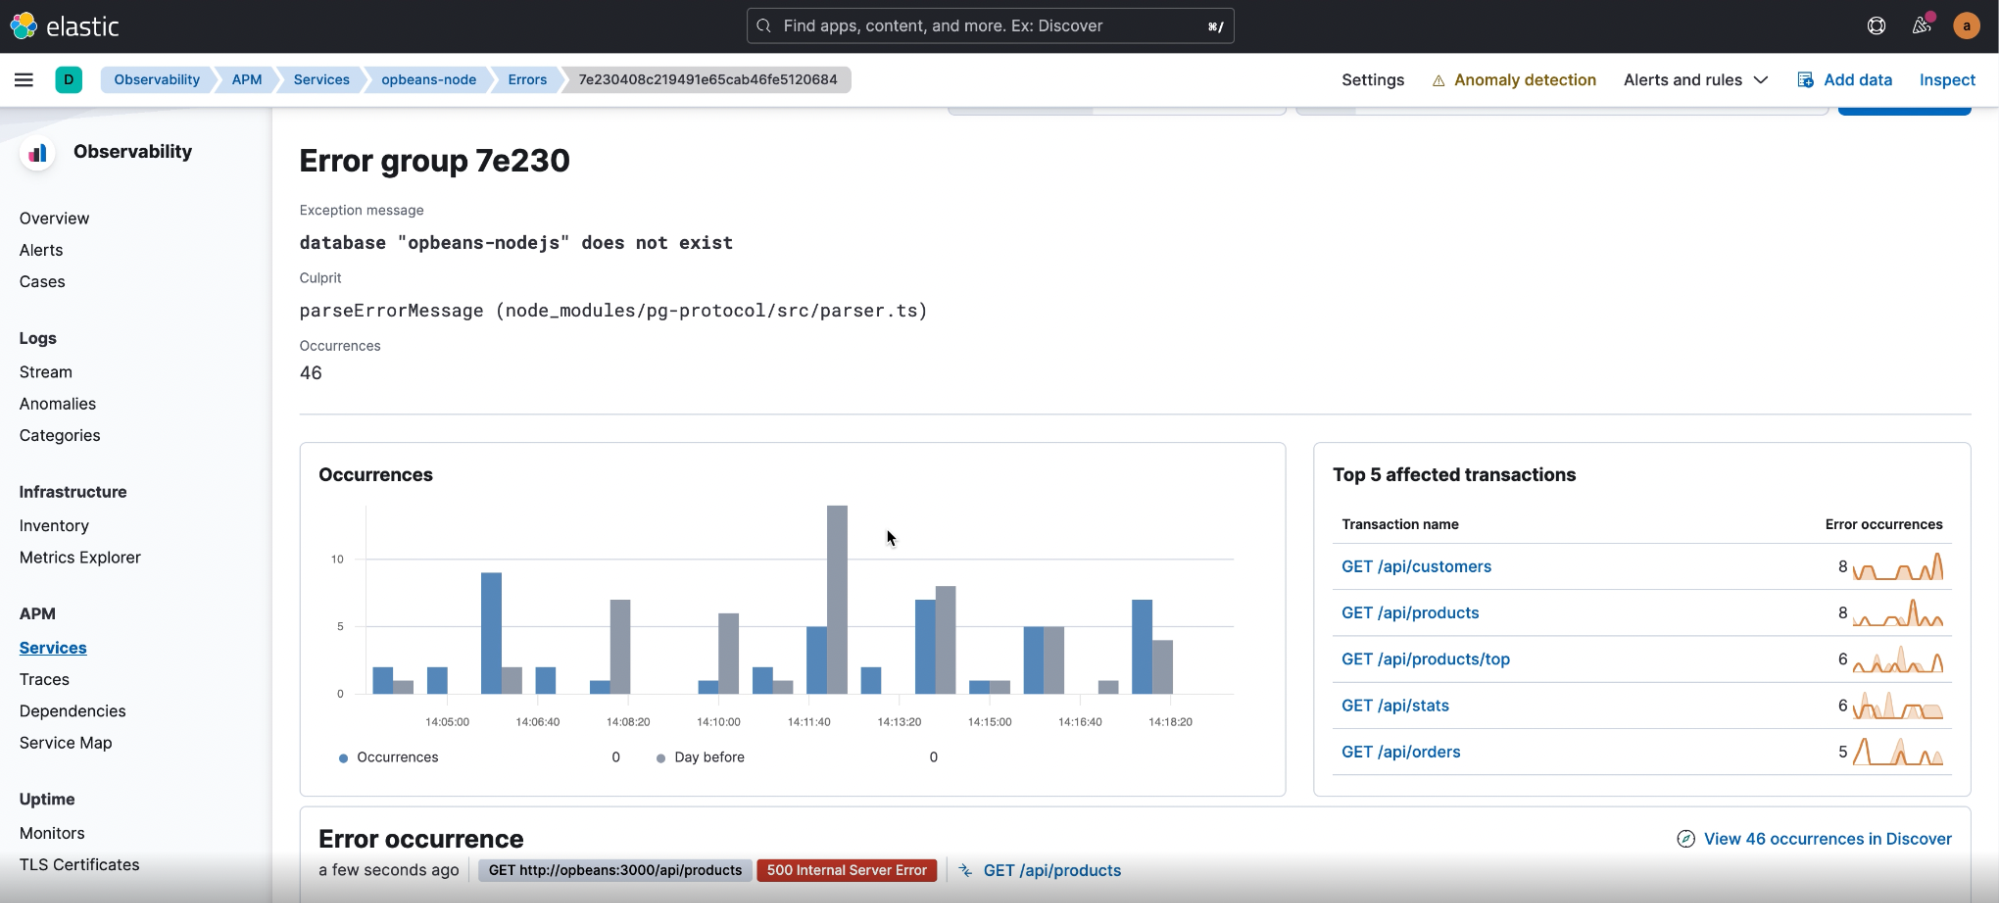
Finally, APM error screens (as shown above) have been populated with additional transaction details to make them more informative and actionable for root cause analysis workflows. This makes it easier to troubleshoot application errors and better understand their impact on application services, and vice versa.
Try it out
Existing Elastic Cloud customers can access many of these features directly from the Elastic Cloud console. If you’re new to Elastic Cloud, take a look at our Quick Start guides (bite-sized training videos to get you started quickly) or our free fundamentals training courses. You can always get started for free with a free 14-day trial of Elastic Cloud. Or download the self-managed version of the Elastic Stack for free.
Read about these capabilities and more in the Elastic Observability 8.4 release notes, and other Elastic Stack highlights in the Elastic 8.4 announcement post.
Share
- Share on Twitter
Share on Twitter
- Share on LinkedIn
Share on LinkedIn
- Share on Facebook
Share on Facebook
- Share by Email
Share by Email
- Print this page
Print