Elastic Logs 7.7 released with PCF support, MQTT support, and more
We are pleased to announce the release of Elastic Logs 7.7.0 — available on the Elasticsearch Service, or when you download the Elastic Stack. This release introduces support for PCF observability, new date/time picker in the Logs app, support for MQTT protocol input in Filebeat, and an enhancement to log categorization
Observability for Pivotal Cloud Foundry (PCF) operators and application developers
We are announcing beta release for PCF observability in this release. For PCF monitoring, we are releasing Metricbeat module and PCF application and relevant component logs are available to consume via Filebeat input.
PCF operator observability
Monitoring PCF is no joke — it's a complicated, distributed black box that just works! Except when it doesn't. When something goes wrong it is an operational nightmare to figure out the root cause. Thankfully, the PCF healthwatch team built super-metrics to measure uptime and performance KPIs for PCF developer experience, and PCF KPIs which can help PCF operators maintain PCF SLAs with the help of dashboards, shown below.
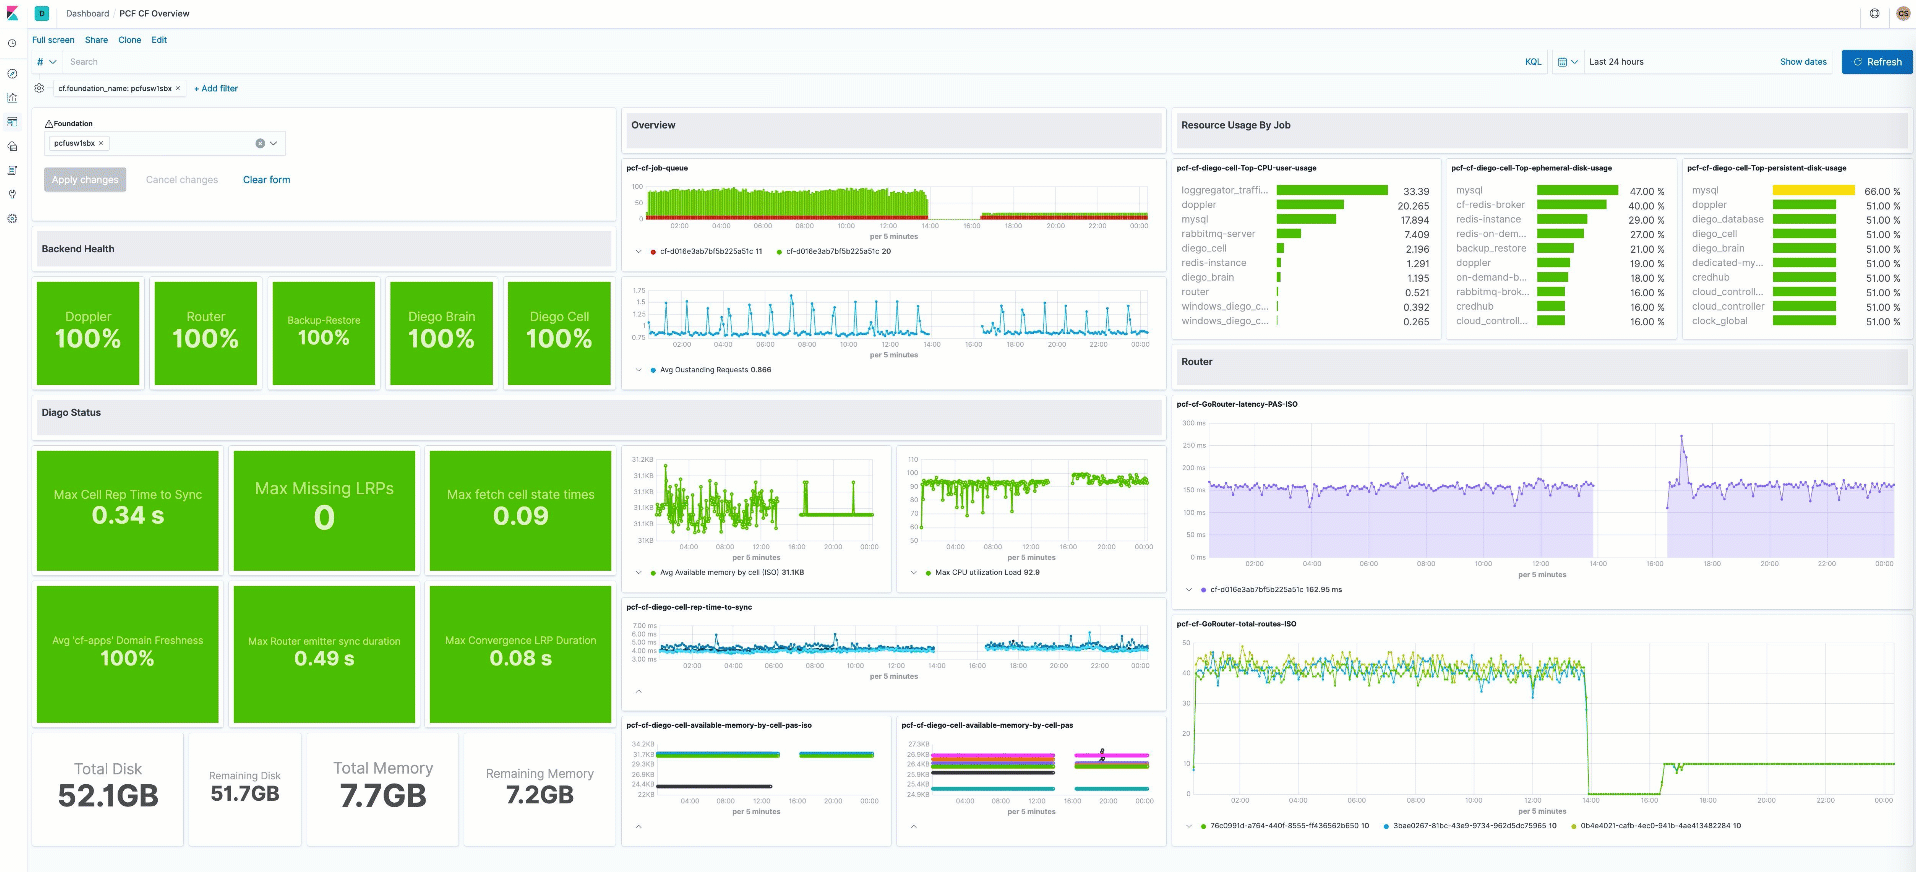
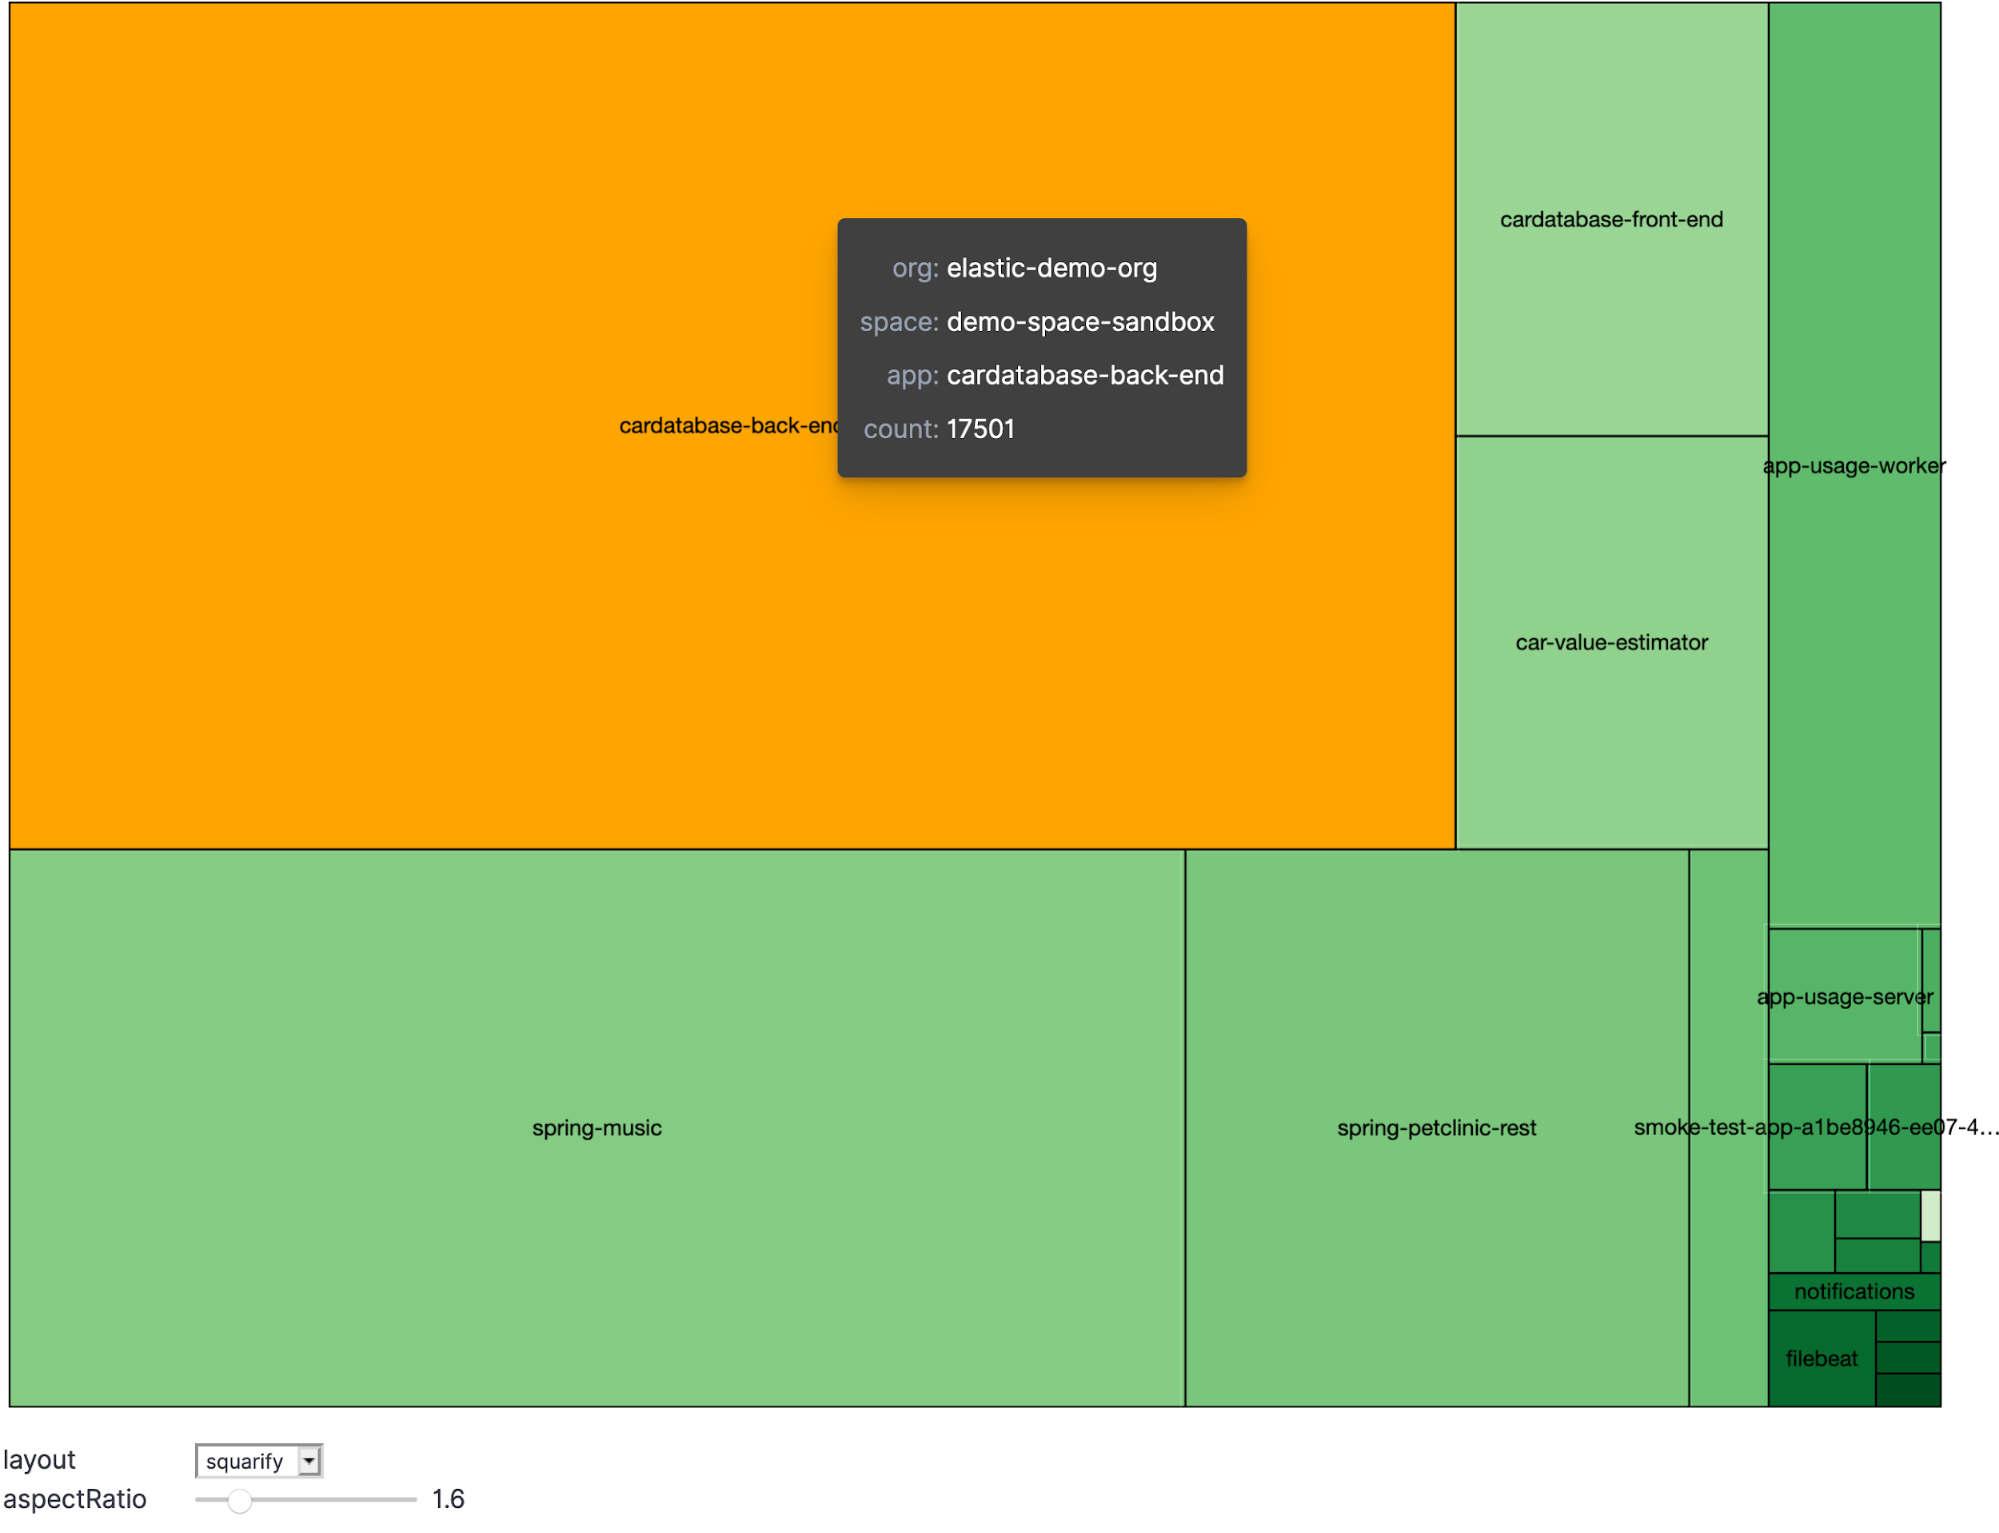
Another common problem that many PCF operators struggle with is identifying noisy apps that put a sudden load on the PCF logging system which can be surfaced with dashboards like this:
PCF developer observability
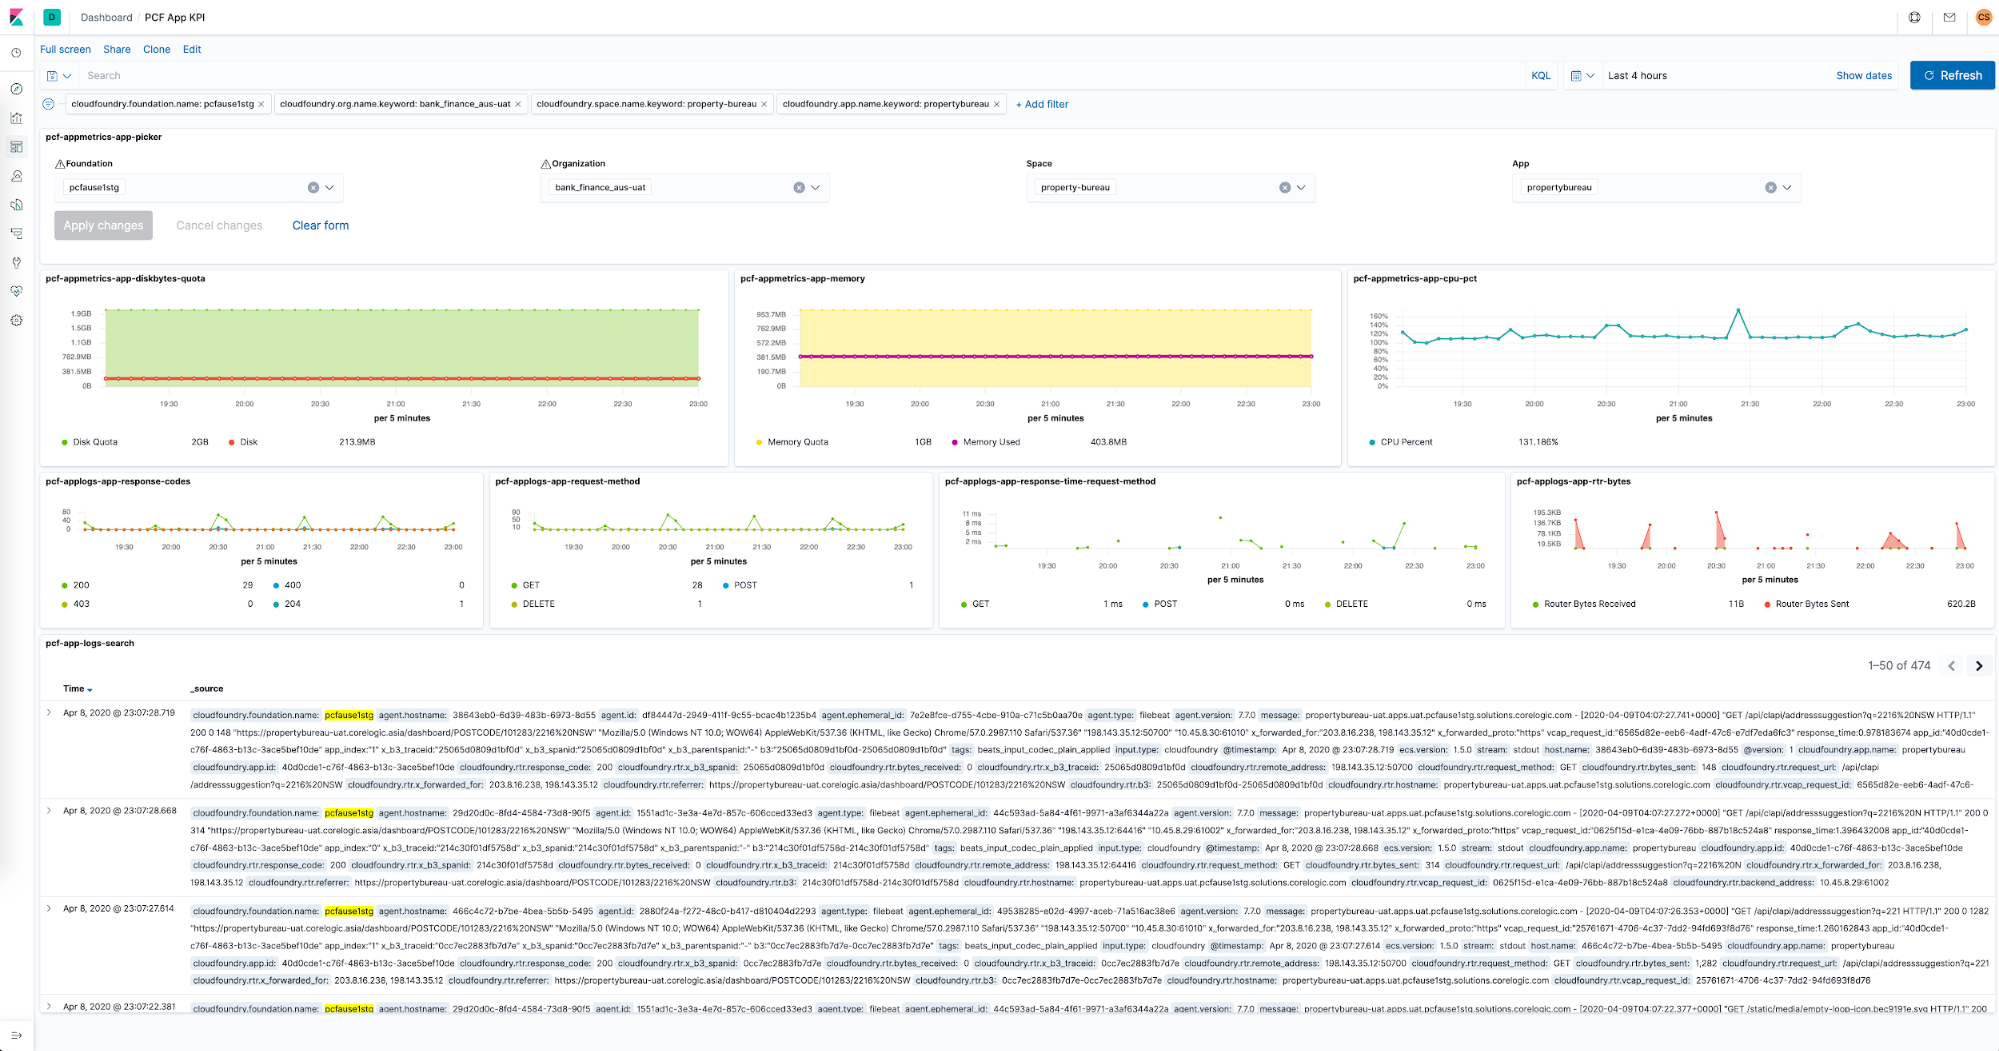
I had the privilege to build PCF Metrics at Pivotal which integrated app logs, metrics, and traces in a contextual view that became a very attractive app dev observability product for pivotal customers. With this release, PCF app developers will have a similar observability experience as shown in the dashboard below. Contextual view of application logs and metrics, with a simple time toggle at top.
Easy to maintain and scale deployment model
A perpetual problem with building and maintaining product integrations with PCF is the painful tile lifecycle management. In addition, observing and scaling these integrations in the event of of a sudden firehose burst of events was non-trivial. That’s why our integration is developed as a PCF app that is easy to install, configure, upgrade, and scale, right at home in the PCF ecosystem.
Logs app improvements
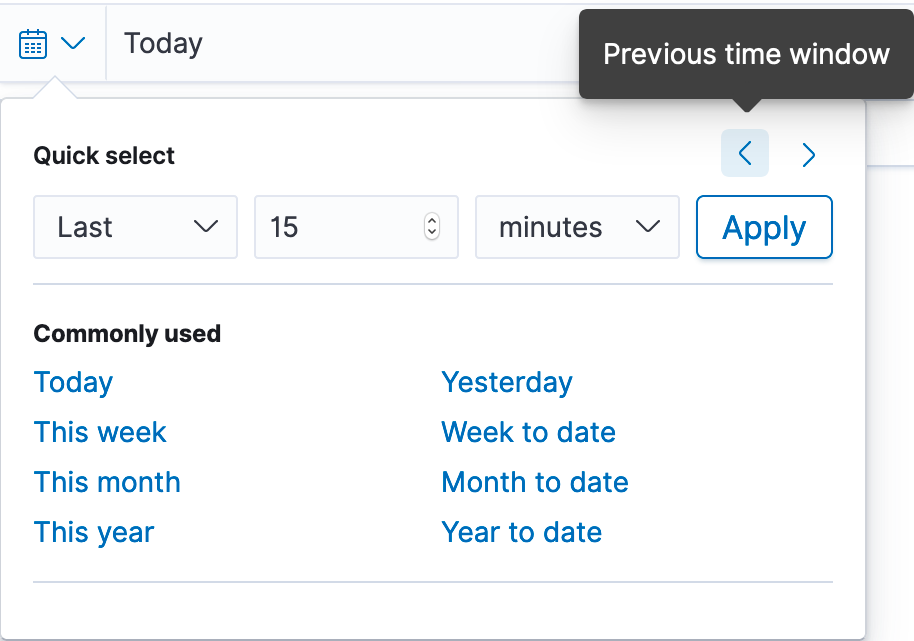
Improved date and time selection control
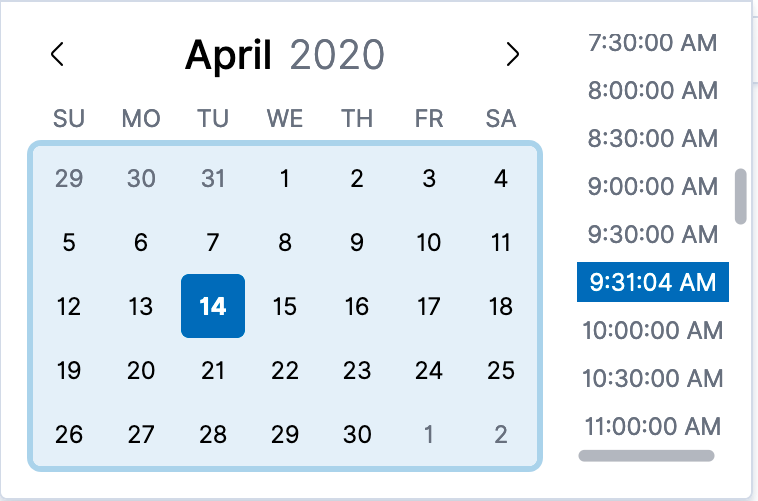
The new and improved date and time picker is tuned to how users think about navigating to different timeframes in their troubleshooting process. Straightforward time selection using minutes, days, and weeks as units, and shuffling between next and previous time windows, as opposed to selecting calendar dates the way you do in travel booking portals. This will help you reduce the cognitive load so that you focus on doing what matters — reduce the mean time to detect (MTTD) and mean time to repair (MTTR) and thus maintain the application and infrastructure SLAs that your customers expect.
Before
After
Log categorization and contextual examples
In the last release, we released log categorization as an effective way to reduce the human effort required to analyze logs by reducing the amount of logs to a handful of representative categories, surfacing the anomalous to the top. We have enhanced the categorization to include sample log lines for each category, allowing you to inspect them, just like any other log line, while allowing you to dive deeper into the machine learning UI for further investigation.
Support for IoT messaging framework MQTT
We are announcing general availability for retrieving logs from devices that support the MQTT protocol.
Use the MQTT input to read data transmitted using lightweight messaging protocol for small and mobile devices optimized for high-latency or unreliable networks. The input connects to the MQTT broker, subscribes to selected topics, and parses data into common message lines. It can be combined with other settings like line filtering, multiline, and JSON decoding, allowing you to inspect your MQTT data right alongside your logs, metrics, and application traces from your applications and your entire ecosystem.
What’s coming next
The most exciting feature that we want to ship next is alerting in the Logs app. Please find more details here.
See it in action!
You can access the latest version of the Elastic Logs app on the Elasticsearch Service on Elastic Cloud by creating a new cluster, or upgrading an existing cluster the day of release, or you can download the Elastic Stack.