What’s new in Kibana 7.13: With great power comes great data exploration
Kibana 7.13 is now available, bringing new capabilities that give you more flexibility in ad hoc analysis and faster speed in workflows, so you can focus on exploring your data and acting on insights. Highlights include:
- Creating, editing, and removing runtime fields in Discover, Kibana Lens, and index patterns via the Kibana runtime fields editor
- The general availability of Elastic Maps Server and supervised machine learning
- Starting with Kibana Lens as the recommended visualization for ad hoc analysis
See how far you can go in your data exploration with the power of these features (and more) by signing up for a free trial of Elasticsearch Service on Elastic Cloud. You can also download the latest versions of Kibana and the Elastic Stack.
For a quick list of the new 7.13 features, take a look at our What’s New in Kibana documentation guide. Looking for the full list of bug fixes and other changes? Check out our Kibana 7.13 release notes.
Tackle your data needs as you go
Ever had a great question you wanted to delve into but didn’t have the data you needed to explore? Whether you were analyzing system logs and found a batch that was incorrectly formatted or you were looking through data that would have been more helpful in a different unit of measure, you can now take action in Kibana to get the data you need.
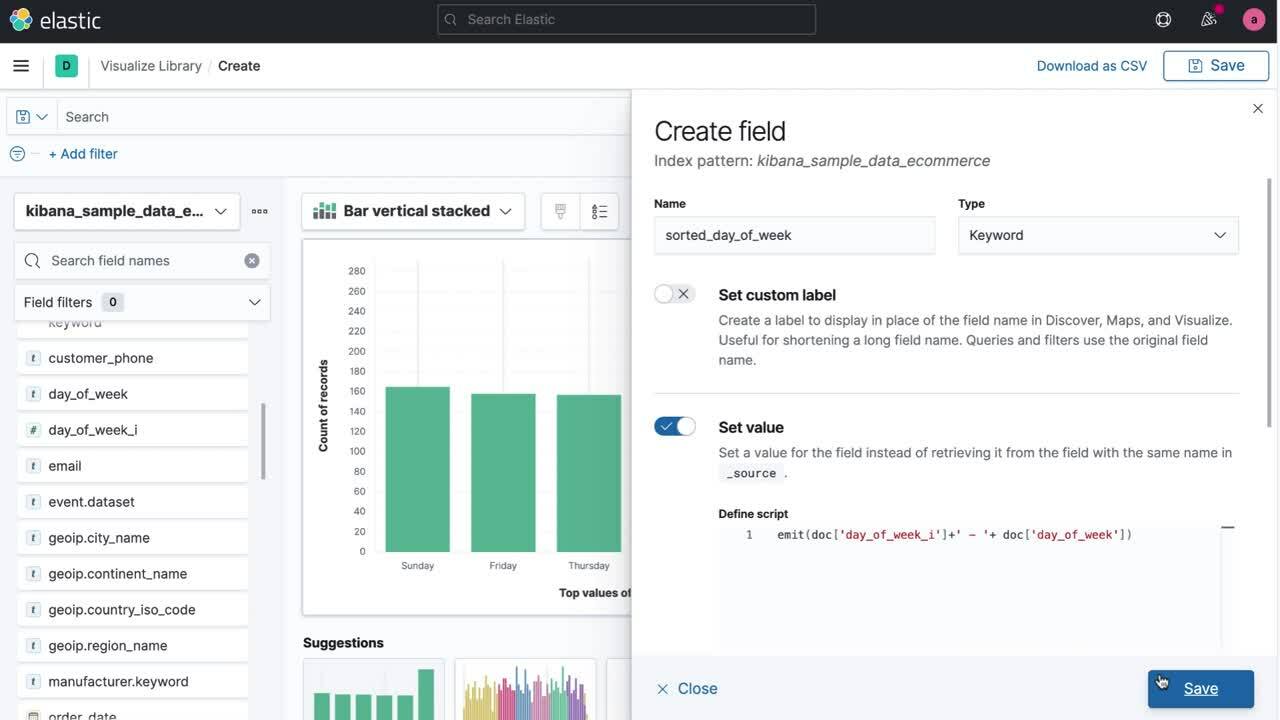
The ability to create, edit, and remove custom fields within your workflows with schema on read in Kibana opens up the kind of data exploration you can do on your own and reduces the time and effort needed to transform your data to gain insights quickly.
Runtime fields, Elastic’s implementation of schema on read, came to Kibana in 7.12 and allowed you to see the fields administrators added in Elasticsearch. Now, with 7.13, you can create your own fields in a Kibana index pattern by using the Kibana runtime fields editor, accessible in Discover, Kibana Lens, and Stack Management.
Create or modify a field from where you are working, transform your data, and use your new field on the spot — there’s no need to re-index the data. The fields you create are specific to the index pattern you are working with, so you don’t have to worry about affecting data in Elasticsearch. Runtime fields let you onboard new data more quickly into Elastic and adapt on the fly to changing requirements while still leveraging the speed of schema on write when you are ready to optimize for performance.
This is just the beginning of data exploration powered by the flexibility of runtime fields in Kibana. Learn more about using the runtime fields editor in Kibana documentation and give it a try.
Examine your densest data from a new perspective
As your data and analysis needs grow, Kibana and its capabilities grow with you to transform data into insights and action. From pivot functionality for table visualizations to the general availability of supervised machine learning, 7.13 helps you look at data in a new (and better) way.
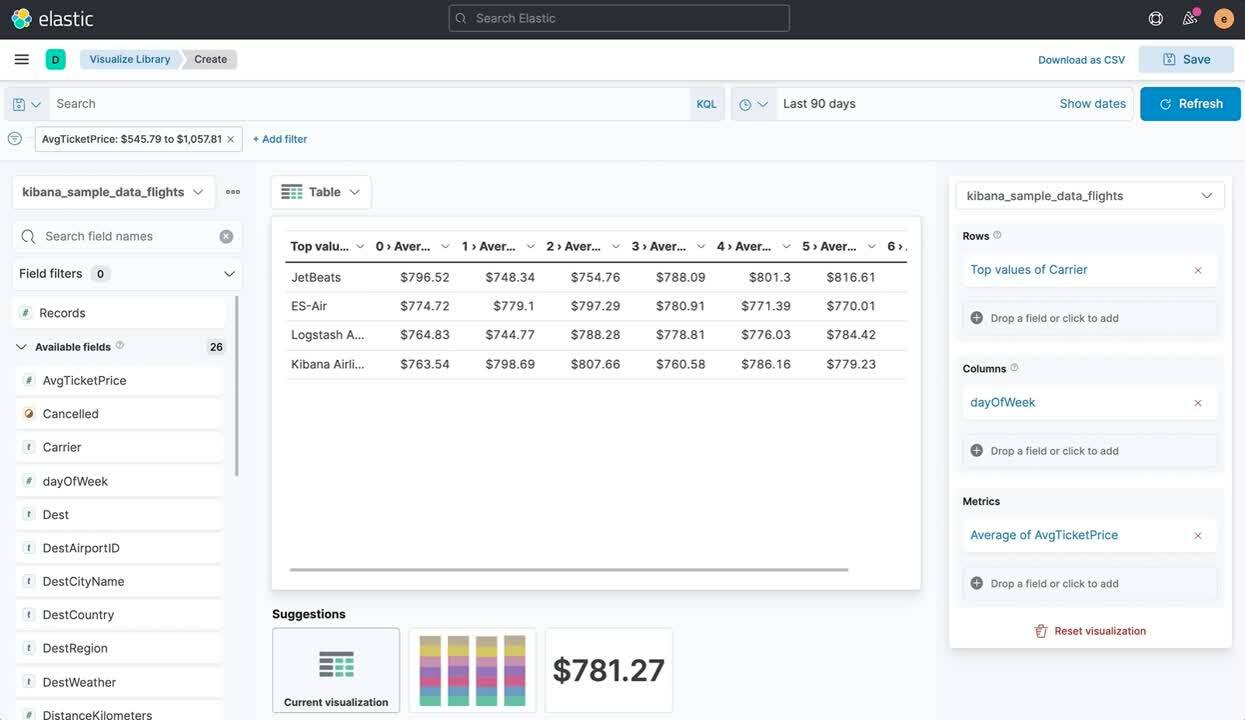
You asked for it, and we are glad to deliver: 7.13 lets you pivot your tables in Kibana Lens. Building on the table visualization, pivot settings let you apply familiar Excel-like functions to your petabytes of data like pivoting key fields to columns and plotting your values horizontally. Kibana Lens continues to unlock new ways to visualize your data differently so you can generate more insights.
The Elastic Maps Server is generally available in 7.13. The Elastic Maps Server offers an offline version of the Elastic Maps Service, giving you the benefit of using all the geodata analytics of Elastic Maps on your own infrastructure, especially if you work in a secure, air-gapped environment. Updates in 7.13 give you more control over the level of detail in the basemaps and provide more download options for basemap data. The Elastic Maps Server enables you to spend more time analyzing and using your geodata versus orchestrating your own maps server or managing yet another system. Try out the Elastic Maps Server using your Elastic Enterprise subscription.
Data frame analytics and inference for supervised machine learning are generally available in 7.13. We’ve evolved these features so you can use data models for investigating more complex questions. For use cases that stretch from detecting fraudulent activity from payment data to using observability data to identify potential security issues, you can train outlier detection, regression, and classification models, then use those models to infer against incoming data to expand the insights and predictions you can generate. Learn more about supervised machine learning.

Move through workflows faster
More data to explore requires more time to ask questions — so do more with the time you have to create, manage, and share your dashboards, visualizations, maps, and more in Kibana 7.13.
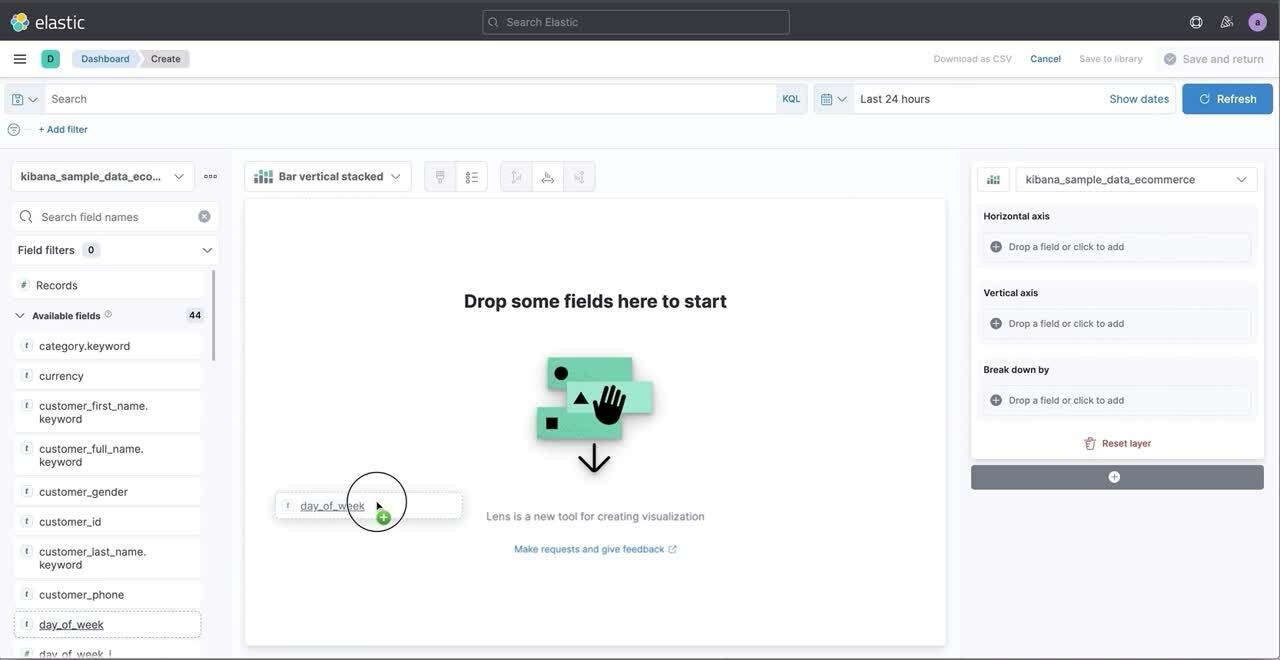
Whether you’re exploring new data through visualizations or building out an existing dashboard, all paths for ad hoc analysis lead to Kibana Lens, our recommended drag-and-drop visualization tool that makes it easy to change your mind as you explore. Kibana Lens, generally available since 7.10, is now front and center for all your visualization needs. Why start from scratch when Kibana Lens can help get your visualization started by analyzing your data and offering recommendations? Not only does Kibana Lens help you save time when you start, it also helps you pivot from one visualization type to the next to probe from different angles, helping you stay fast, flexible, and curious.
If you’re a fan of our other Elastic visualization tools, you can still easily access other editors from Dashboard or the Visualization Library.
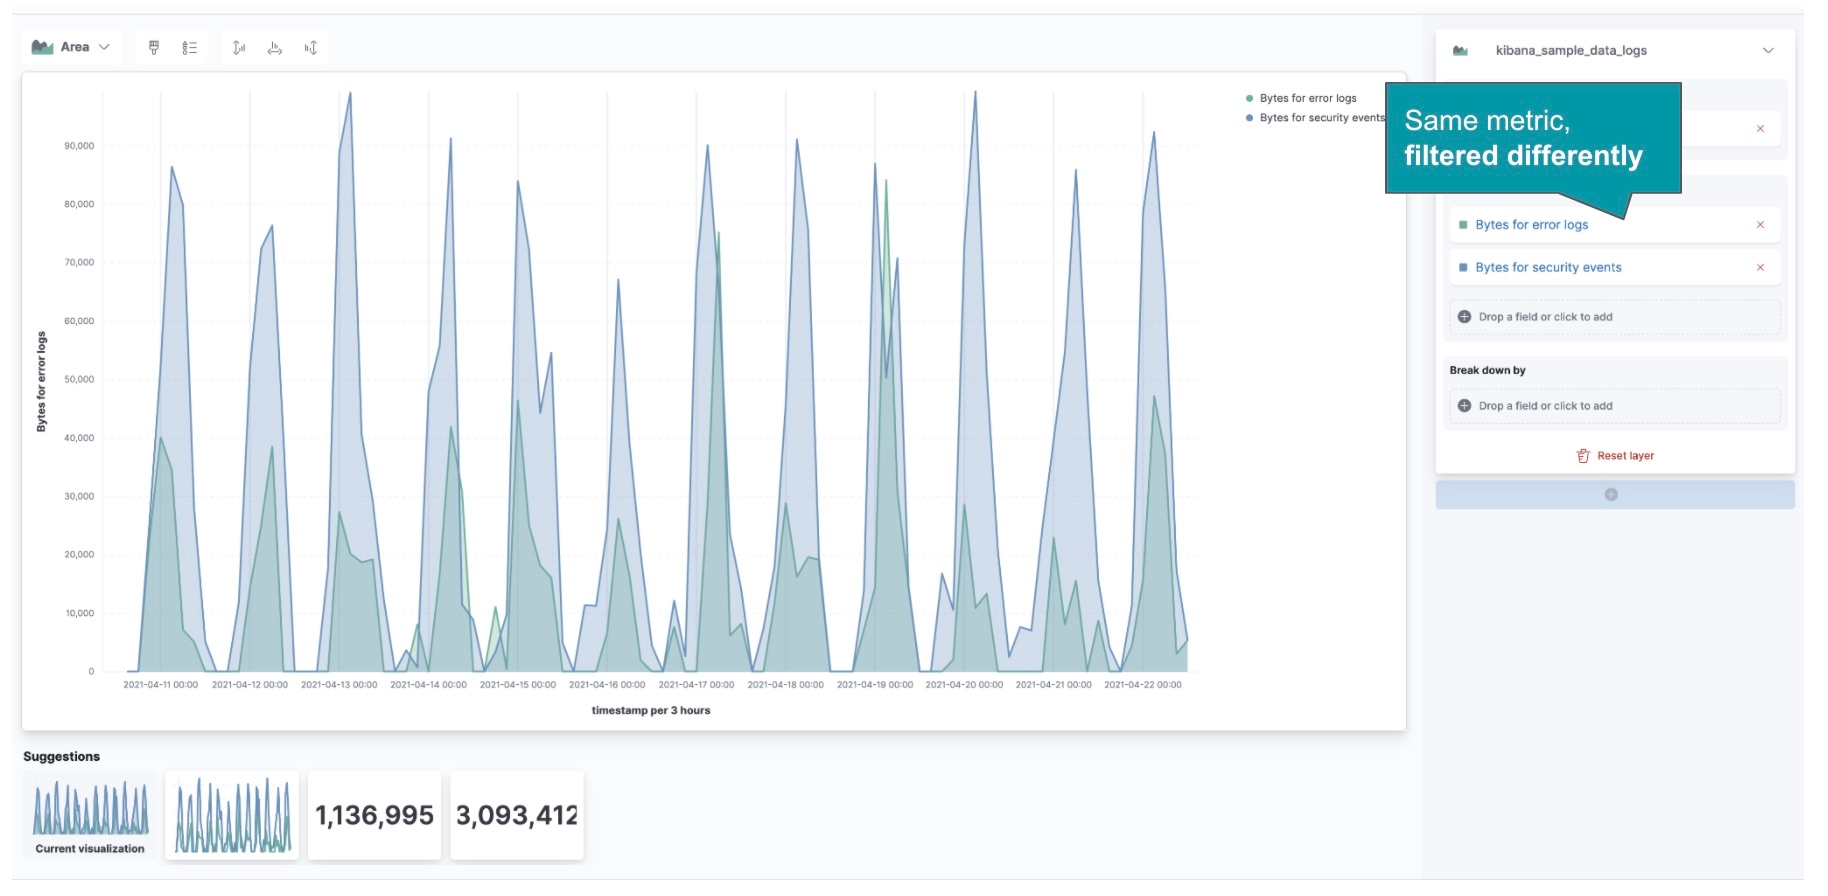
Kibana Lens also rolls out filters for each metric, giving you the ability to filter specific metrics with additional criteria using KQL to specify data for various chart types. You can now apply filters to each metric, adding even more capabilities to make powerful comparisons from your data.
Once you’ve created your visualization via Kibana Lens and need to add it as a new panel in existing dashboards, you will have the ability to copy existing drilldowns, custom analytical navigation paths for viewers between dashboards and other applications, from other visualizations on the same dashboard to save time.
In Elastic Maps, it is now easier to see the most recent or relevant geographic data using the Top hits per entity layer card. The UI for top hits has been promoted to save you additional clicks while building out your map.
With these features and more, Elastic boosts your ability to create more space and time by optimizing workflows and embedding recommendations to let you focus on the other important stuff – your data.
More power for admins, too
If you know your way around Stack Management, you also need time, speed, and flexibility to manage the platform that empowers you and others to do more with your data.
Searching through alerting data to spot trends and identify issues? You now have a native integration for ingesting alerting data into an Elasticsearch index via the new experimental preconfigured Elasticsearch index connector. You are able to more easily explore and dive deeper into the alerting data that your team collects in this index and use this to better understand alerts collected over time.
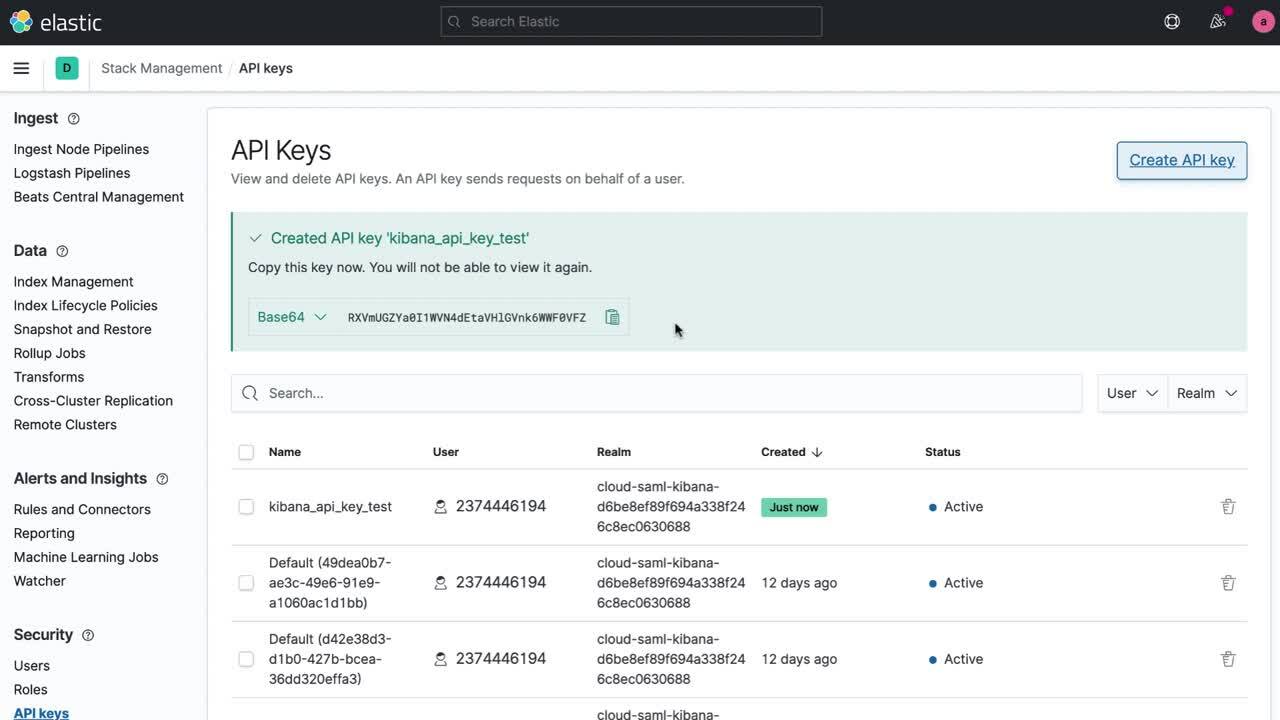
Managing API key requests and maintenance? With 7.13, you can create and remove API keys from the UI — no need to make API calls to create and remove keys anymore. The new actions available in the API Keys UI helps to streamline and simplify API key management across the team and provides valuable information for you right from Kibana.
Governing different Kibana spaces for groups or teams of users? Custom banners for the Kibana header helps you and your team visually differentiate Kibana Spaces for different groups of users. This makes the experience for groups more customized and personalized for their work, team, and organization. You can customize messages, with full support for Markdown, in Advanced Settings under Stack Management.
See the power of Kibana 7.13 today
Experience the newest Kibana features with a free trial of Elasticsearch Service on Elastic Cloud or install the latest version of the Elastic Stack.
Have a question or just want to connect with us? You can always find us on Twitter (@elastic) or in the Kibana forum and in the Kibana GitHub repo.
Related blogs:
- Elastic 7.13 released
- Elasticsearch 7.13 released
- What's New in Elastic Enterprise Search 7.13
- What's New in Elastic Observability 7.13
- What's New in Elastic Security 7.13
- What's New in Elastic Cloud 7.13
The release and timing of any features or functionality described in this document remain at Elastic’s sole discretion. Any features or functionality not currently available may not be delivered on time or at all.