Make dashboards interactive
editMake dashboards interactive
editAdd interactive capabilities to your dashboard, such as controls that allow you to apply dashboard-level filters, and drilldowns that allow you to navigate to other dashboards and external websites.
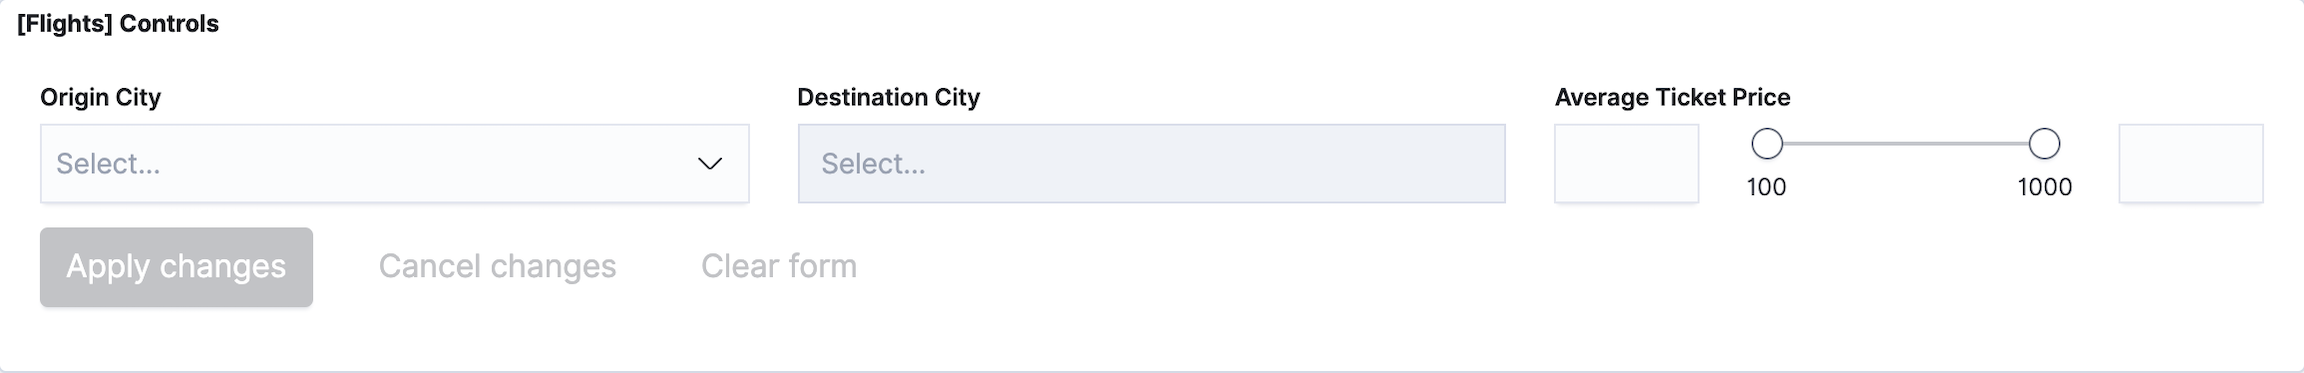
Controls panels allow you to apply dashboard-level filters based on values from a list, or a range of values.
Kibana supports two types of Controls:
- Options list — Filters content based on one or more specified options. The dropdown menu is dynamically populated with the results of a terms aggregation. For example, use the options list on the sample flight dashboard when you want to filter the data by origin city and destination city.
-
Range slider — Filters data within a specified range of numbers. The minimum and maximum values are dynamically populated with the results of a min and max aggregation. For example, use the range slider when you want to filter the sample flight dashboard by a specific average ticket price.
Panels have built-in interactive capabilities that apply filters to the dashboard data. For example, when you drag a time range or click a pie slice, a filter for the time range or pie slice is applied. Drilldowns let you customize the interactive behavior while keeping the context of the interaction.
Kibana supports two types of drilldowns:
- Dashboard — Navigates you from one dashboard to another dashboard. For example, when can create a drilldown for a Lens panel that navigates you from a summary dashboard to a dashboard with a filter for a specific host name.
- URL — Navigates you from a dashboard to an external website. For example, a website with the specific host name as a parameter.
Third-party developers can create drilldowns. To learn how to code drilldowns, refer to this example plugin.
Add Controls panels
editAdd interactive dashboard-level filter panels to your dashboard.
- On the dashboard, click All types, then select Controls.
-
Click Options, then configure the following options:
- Update Kibana filters on each change — When selected, all interactive inputs create filters that refresh the dashboard. When unselected, Kibana filters are created only when you click Apply changes.
- Use time filter — When selected, the aggregations that generate the options list and time range are connected to the time filter.
- Pin filters for all applications — When selected, all filters created by interacting with the inputs are automatically pinned.
- Click Update
Create dashboard drilldowns
editDashboard drilldowns enable you to open a dashboard from another dashboard, taking the time range, filters, and other parameters with you so the context remains the same. Dashboard drilldowns help you to continue your analysis from a new perspective.
For example, if you have a dashboard that shows the logs and metrics for multiple data centers, you can create a drilldown that navigates from the dashboard that shows multiple data centers, to a dashboard that shows a single data center or server.
The panels you create using the following editors support dashboard drilldowns:
- Lens
- Maps
- TSVB
- Vega
- Aggregation-based area chart, data table, heat map, horitizontal bar chart, line chart, pie chart, tag cloud, and vertical bar chart
- Timelion
Create and set up the dashboards you want to connect
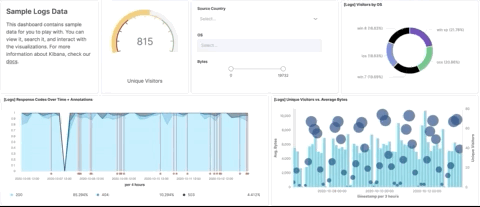
editUse the Sample web logs data to create a dashboard and add panels, then set a search and filter on the [Logs] Web traffic dashboard.
- Add the Sample web logs data.
-
Create a new dashboard, click Add from Library, then add the following panels:
- [Logs] Heatmap
- [Logs] Host, Visits, and Bytes Table
- [Logs] Total Requests and Bytes
- [Logs] Visitors by OS
- Set the time filter to Last 30 days.
-
Save the dashboard. In the Title field, enter
Host Overview. - Open the [Logs] Web traffic dashboard.
-
Create a data table.
- In the toolbar, click Edit.
- Click Create visualization.
- From the Chart type dropdown, select Table.
-
From the Available fields list, drag and drop the following fields onto the visualization builder:
- agent.keyword
- bytes
- geo.src
- ip
- In the editor, remove Count of records, then click Save and return.
-
On the [Logs] Web traffic dashboard, set a search and filter.
Search:
extension.keyword: ("gz" or "css" or "deb")
Filter:geo.src: CN
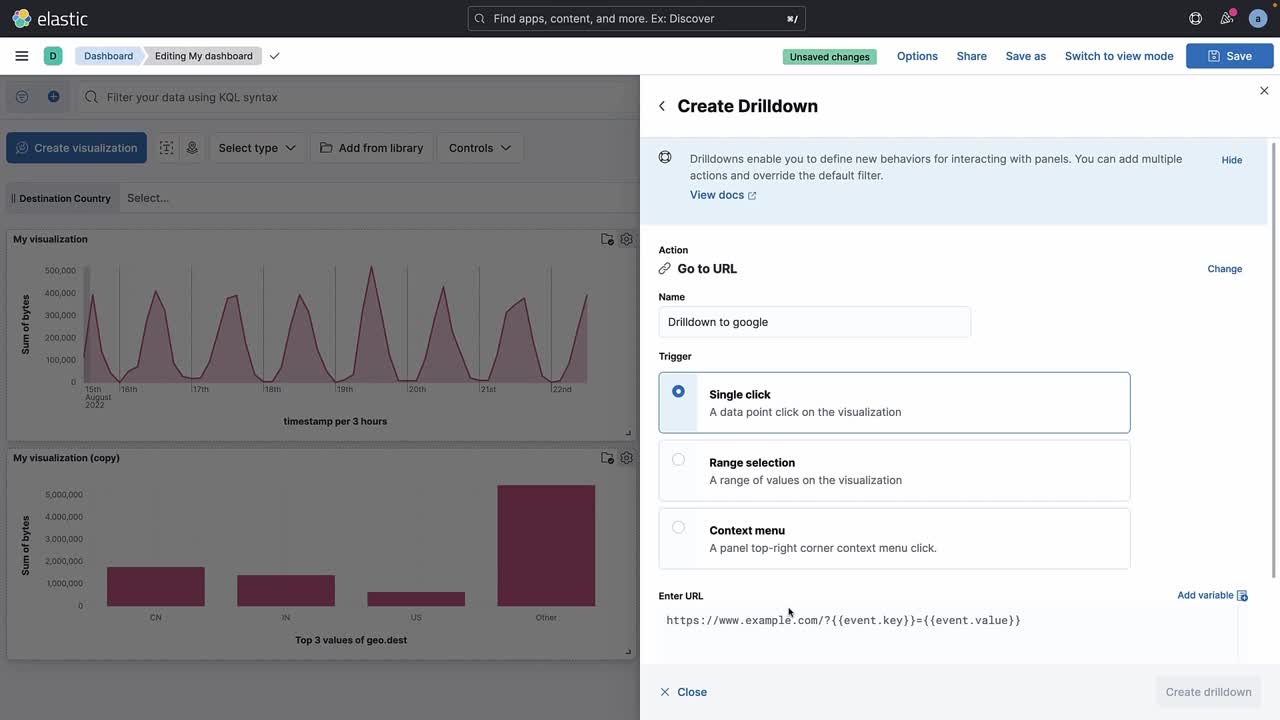
Create the drilldown
editCreate a drilldown that opens the Host Overview dashboard from the [Logs] Web traffic dashboard.
- Open the panel menu for the data table you created, then select Create drilldown.
-
Click Go to dashboard.
-
Give the drilldown a name. For example,
My Drilldown. - From the Choose a destination dashboard dropdown, select Host Overview.
- To use the geo.src filter, KQL query, and time filter, select Use filters and query from origin dashboard and Use date range from origin dashboard.
- Click Create drilldown.
-
Give the drilldown a name. For example,
- Save the dashboard.
-
In the data table panel, hover over a value, click +, then select
My Drilldown.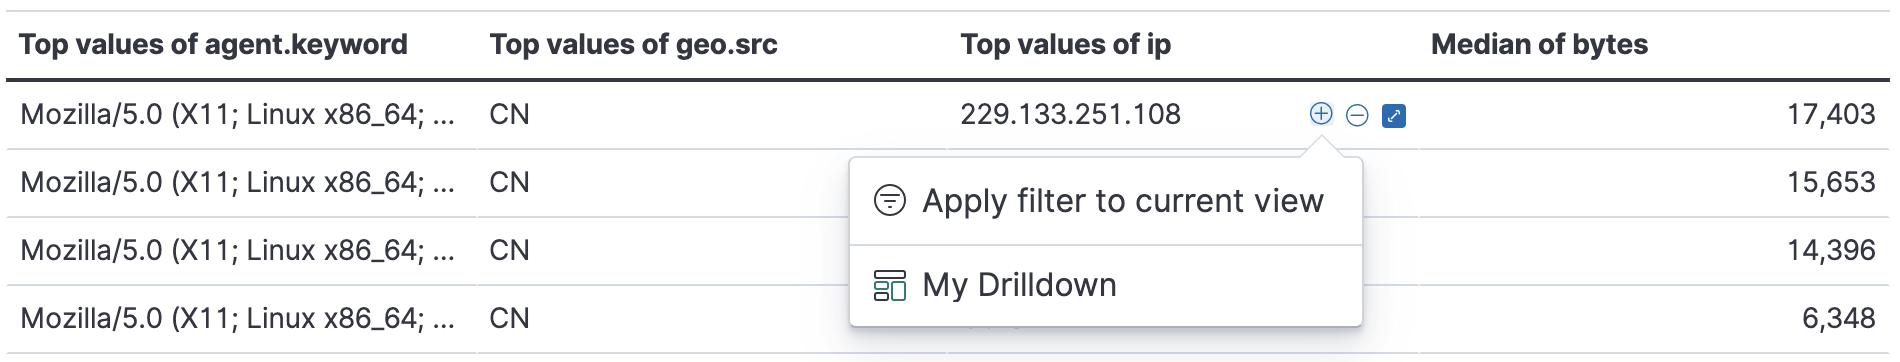
Create URL drilldowns
editURL drilldowns enable you to navigate from a dashboard to external websites. Destination URLs can be dynamic, depending on the dashboard context or user interaction with a panel. To create URL drilldowns, you add variables to a URL template, which configures the behavior of the drilldown.
Some panels support multiple interactions, also known as triggers. The variables you use to create a URL template depends on the trigger you choose. URL drilldowns support these types of triggers:
- Single click — A single data point in the panel.
- Range selection — A range of values in a panel.
For example, Single click has {{event.value}} and Range selection has {{event.from}} and {{event.to}}.
The panels you create using the following editors support dashboard drilldowns:
- Lens
- Maps
- TSVB
- Aggregation-based area chart, data table, heat map, horitizontal bar chart, line chart, pie chart, tag cloud, and vertical bar chart
Create a URL drilldown
editFor example, if you have a dashboard that shows data from a Github repository, you can create a URL drilldown that opens Github from the dashboard panel.
- Add the Sample web logs data.
- Open the [Logs] Web traffic dashboard.
- In the toolbar, click Edit.
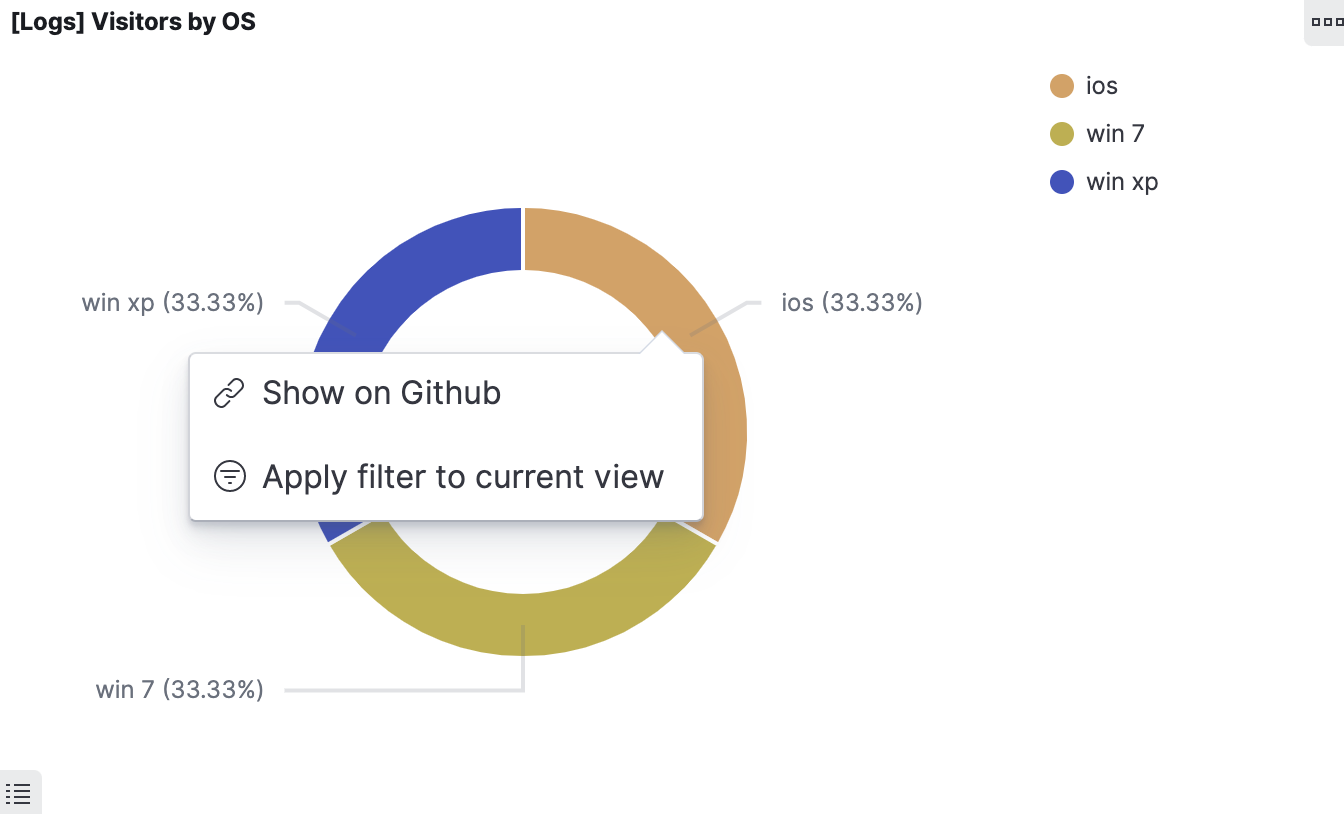
- Open the [Logs] Visitors by OS panel menu, then select Create drilldown.
-
Click Go to URL.
-
Give the drilldown a name. For example,
Show on Github. - For the Trigger, select Single click.
-
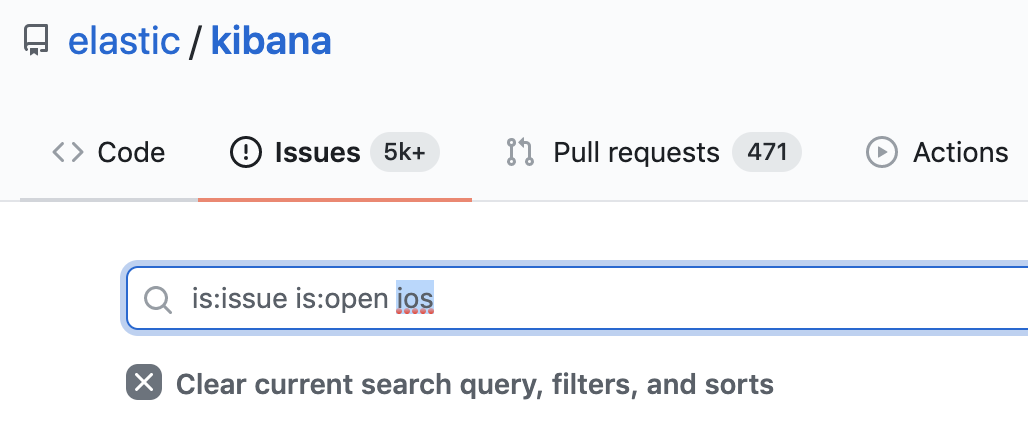
To navigate to the Kibana repository Github issues, enter the following in the Enter URL field:
https://github.com/elastic/kibana/issues?q=is:issue+is:open+{{event.value}}Kibana substitutes
{{event.value}}with a value associated with the selected pie slice. - Click Create drilldown.
-
Give the drilldown a name. For example,
- Save the dashboard.
-
On the [Logs] Visitors by OS panel, click any chart slice, then select Show on Github.
-
In the list of Kibana repository issues, verify that the slice value appears.
Manage drilldowns
editMake changes to your drilldowns, make a copy of your drilldowns for another panel, and delete drilldowns.
- Open the panel menu that includes the drilldown, then click Manage drilldowns.
-
On the Manage tab, use the following options:
- To change drilldowns, click Edit next to the drilldown you want to change, make your changes, then click Save.
- To make a copy, click Copy next to the drilldown you want to change, enter the drilldown name, then click Create drilldown.
- To delete a drilldown, select the drilldown you want to delete, then click Delete.