Elastic Security 7.8.0 released
Elastic Security 7.8 is now available for analysts everywhere. It delivers a new integration between Atlassian Jira and Elastic Security case management, a variety of UI enhancements, new detection rules protecting Linux endpoints, and enhanced support for common sources of security data. This seventh release of Elastic Security in less than 12 months extends the capabilities available for security teams to stop threats quickly and at scale.
Want to experience the latest release of Elastic Security? You can try it on Elastic Cloud or download the free and open Elastic Stack.
Let’s explore the highlights of Elastic Security 7.8.
Respond faster with integration between Jira and Elastic case management
Security practitioners are most effective when equipped with fast and intuitive solutions that are aligned with the existing workflows of their broader security operations team and IT organization. That’s why Elastic continues introducing integrations with popular downstream workflow tools, as well as enhancing our built-in case management capabilities.
Elastic Security 7.8 enhances analyst productivity with a new integration with Jira Core, Jira Service Desk, and Jira Software. From a single interface, Elastic Security users can quickly open or update a Jira incident or issue, enabling organizations to further standardize and streamline their incident response processes. This further unifies the end-to-end workflow for performing an investigation, creating a case, gathering and annotating data, and — once ready to escalate — quickly opening or updating a Jira incident or issue to take action. Want to learn more? Check out our documentation on integrating an external system with Elastic case management.
Find and act on issues quickly with a powerful UI
The Elastic Security interface continues to grow more flexible and intuitive. This latest release gives security practitioners quicker access to the data they need and new ways to take immediate action.
Interactive aggregation charts enable analysts to quickly visualize contextually relevant data — steps needed to visualize outlier activity and discern important trends — supporting the natural and uninterrupted advancement of an inquiry.
Elastic Security introduces new ways to apply and adjust the filters driving an investigation timeline, speeding decision-making and thereby enabling analysts to iterate rapidly on successive hypotheses. Additionally, users reviewing data on a grid or chart can now broaden or narrow a global filter with just two quick clicks, making it easier to zoom in to pinpoint specific issues or zoom out to spot broader trends.
Stop threats at scale with new out-of-the-box protections
Elastic Security 7.8 delivers a new set of out-of-the-box rules for detecting advanced threats targeting your Linux systems. The new rule set detects various Linux attack techniques, with an emphasis on evasion — preventing attackers from hiding malicious activity by taking steps like deleting system artifacts, disabling services, and even using local tools to spawn a new terminal. The Linux operating system’s otherwise ripe environment for living-off-the-land techniques necessitates the type of automated monitoring these new prebuilt rules provide.
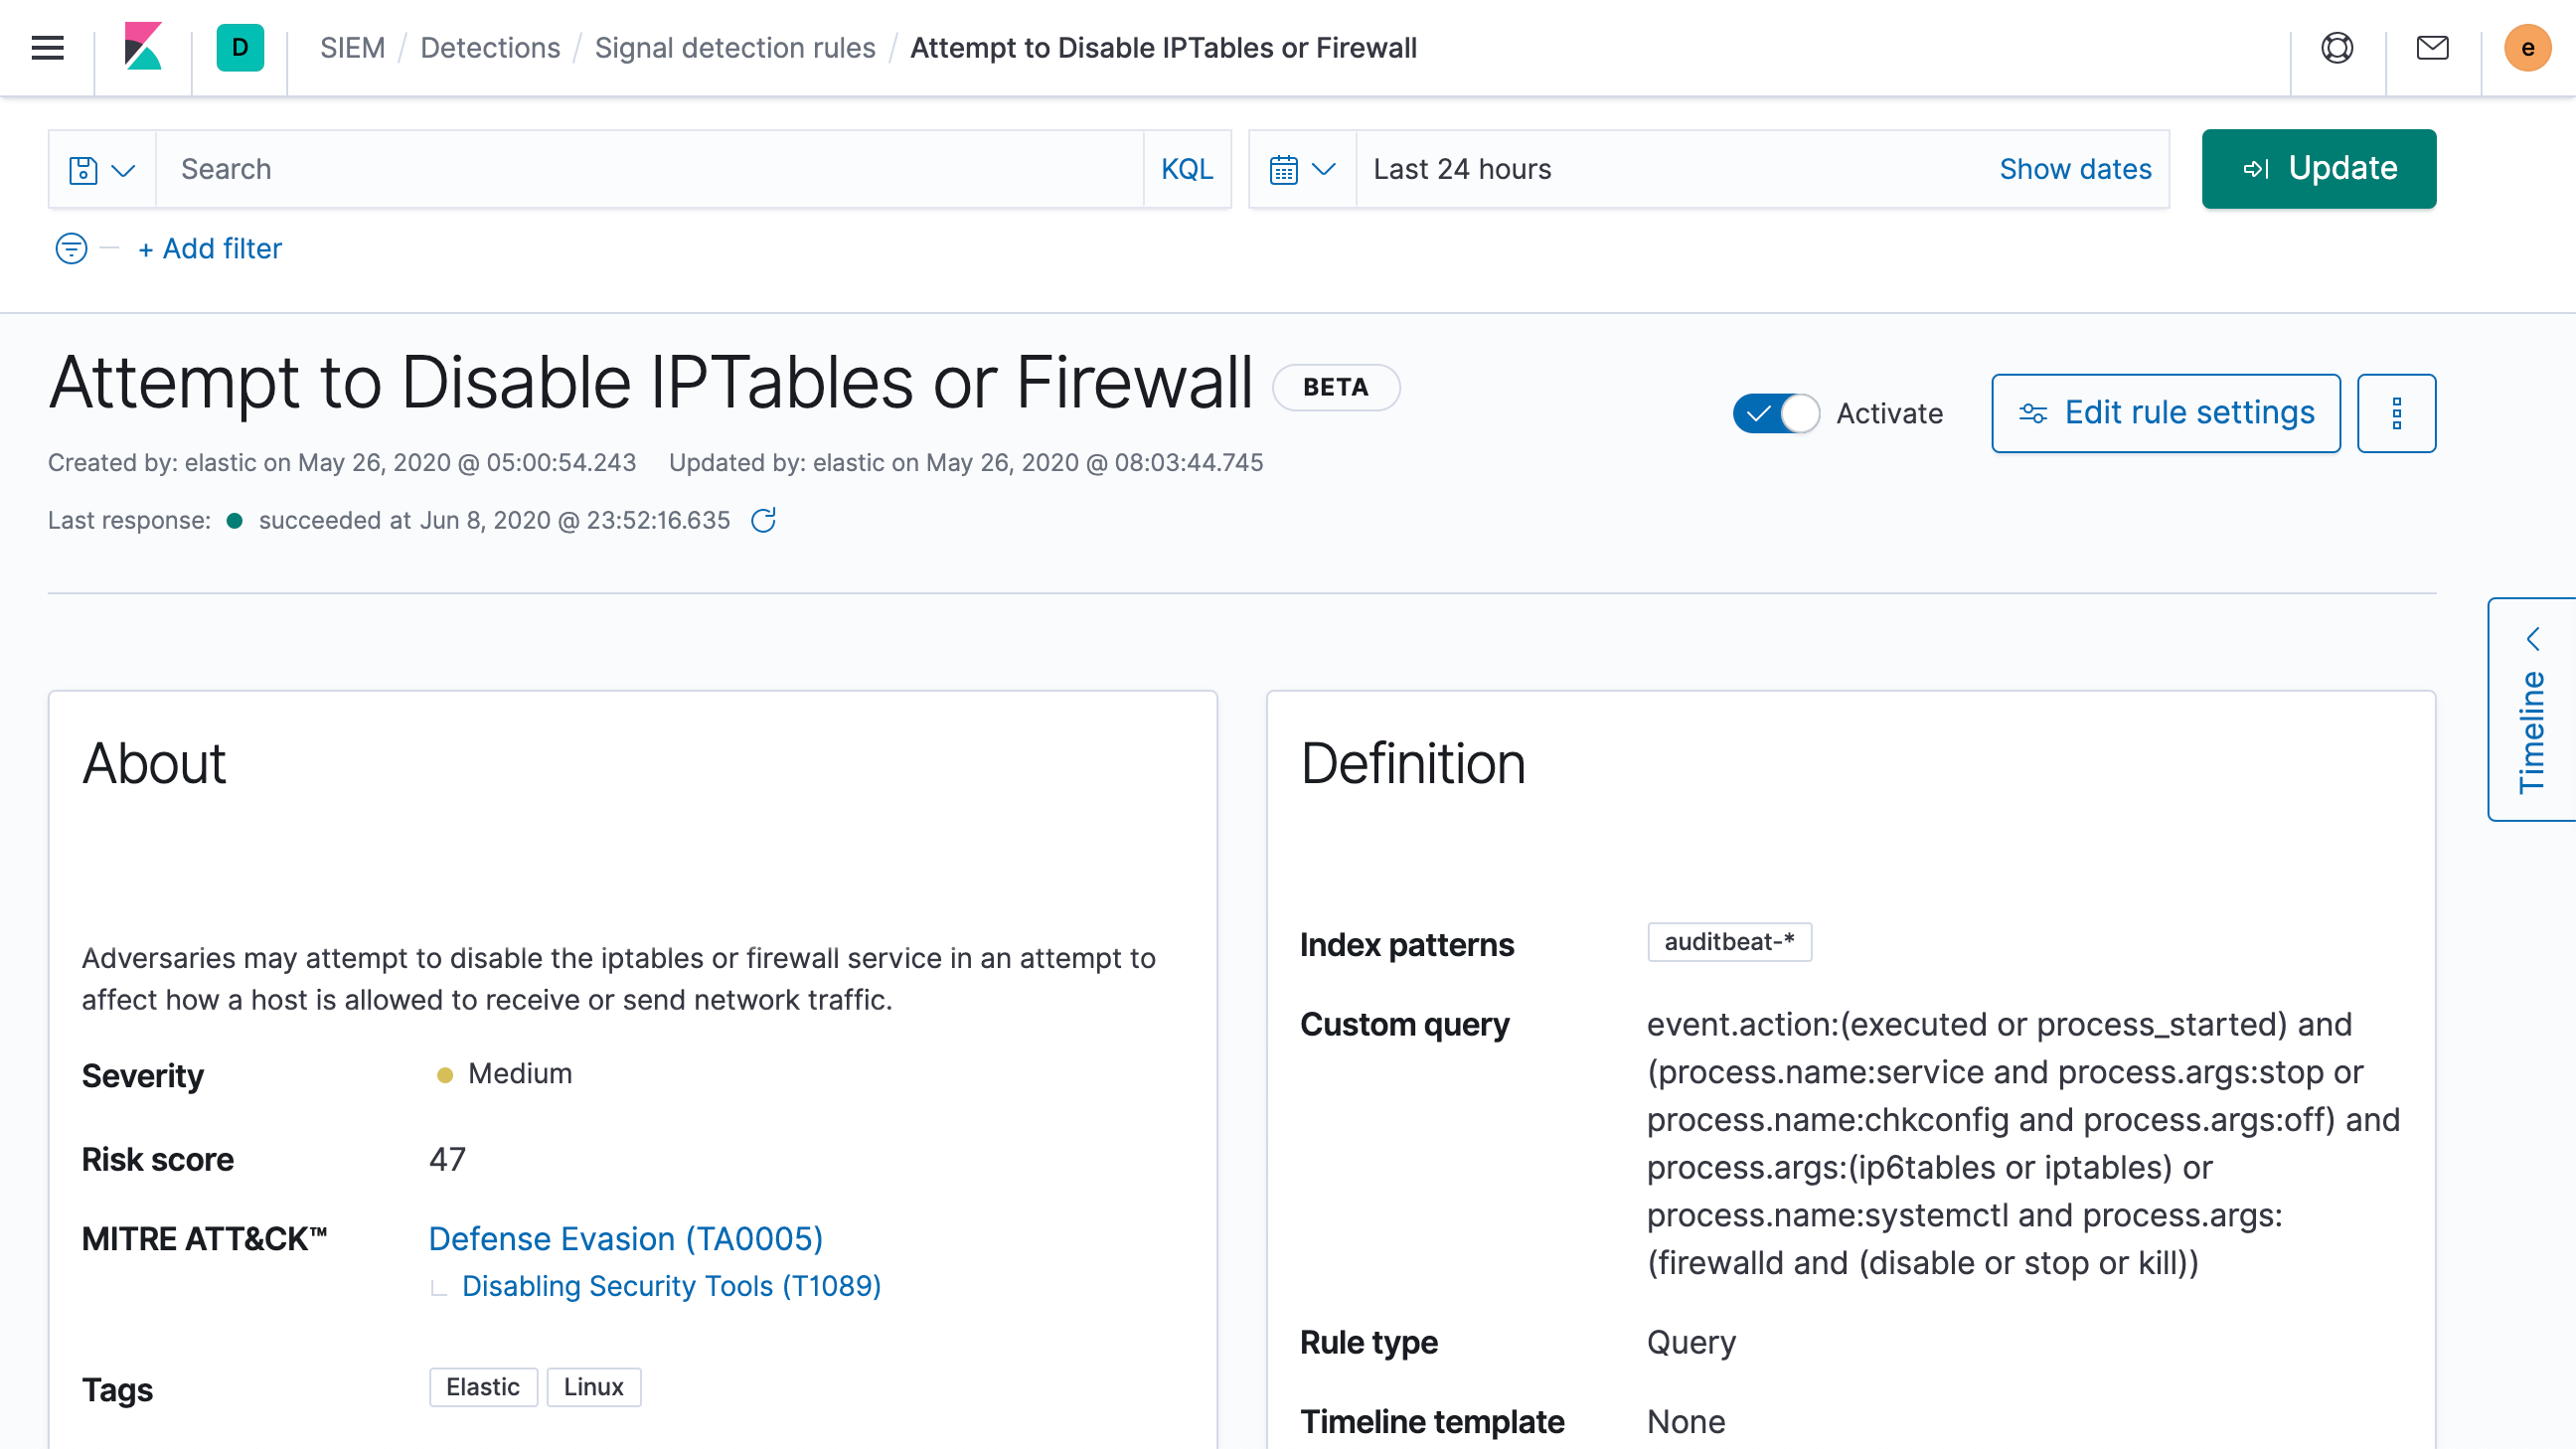
These new Linux threat detection rules are the latest addition to the wide range of out-of-the-box rules developed by our security research team. The rules operate at scale, leveraging ECS-formatted data from across your environment (e.g., Windows, macOS, and Linux hosts; network security technologies; and cloud infrastructure and applications) to expose hostile actors before they can cause damage and loss. To learn more, explore our prebuilt detection rules and machine learning jobs for Elastic Security.
Easily ingest and analyze network and endpoint data to eliminate blind spots
Elastic Security 7.8 further broadens the data immediately available to security teams with free and open Filebeat modules that are available to end-users everywhere. Network security event logs from Fortinet and Check Point devices allow you to monitor and analyze network activity, while endpoint data from CrowdStrike Falcon EDR provides access to host telemetry.
Access to this data, alongside the numerous other data sources with prebuilt support for Elastic Common Schema (ECS), enables sophisticated cross-environment analysis. The machine learning jobs, detection rules, and dashboards in Elastic Security are engineered for compatibility with ECS-formatted data, regardless of the original data source. And if you’d like to add something new to the mix, we’ve taken steps to make that easier, too — just watch our webinar about integrating custom logs with ECS to learn more.
Get started today
Want to give Elastic Security a spin? Experience all that 7.8 has to offer on Elasticsearch Service on Elastic Cloud, or check out an Elastic Security demo. Already have ECS-formatted data in Elasticsearch? Just upgrade to 7.8 of the Elastic Stack to start detecting and responding.
Want to attend a free, virtual ElasticON Tour event? Choose an upcoming session.