Aponte qualquer cliente compatível com Prometheus para o Elasticsearch e execute PromQL diretamente em suas métricas existentes. O Elasticsearch está adicionando endpoints nativos de consulta, descoberta e metadados do Prometheus como uma prévia técnica que funcionam com métricas ingeridas via Prometheus Remote Write, OpenTelemetry ou Bulk API. A API é executada sobre os fluxos de dados de série temporal (TSDS) do Elasticsearch, então não há uma camada de armazenamento específica do Prometheus para operar.
Este post explica como os endpoints de consulta, descoberta e metadados se baseiam no trabalho anterior de ingestão e consulta para formar esse conjunto de APIs. Posts complementares aprofundam tópicos específicos:
- O suporte nativo ao PromQL no ES|QL abrange como as consultas PromQL são traduzidas em planos de execução do ES|QL.
- Enviar métricas do Prometheus para o Elasticsearch com Remote Write abrange a configuração da ingestão.
- Como funciona a ingestão de gravação remota do Prometheus no Elasticsearch aborda os aspectos internos da gravação remota.
Isso ainda está em desenvolvimento. As seções abaixo destacam o que é compatível atualmente e quais partes ainda estão evoluindo.
A superfície da API
Hoje, a interface de API compatível com Prometheus é dividida em três grupos.
Endpoints de consulta
Os endpoints de consulta permitem que clientes compatíveis com Prometheus avaliem expressões PromQL:
GET /_prometheus/api/v1/query_rangeavalia uma expressão de PromQL ao longo de uma janela de tempo (resultados matriciais).GET /_prometheus/api/v1/queryavalia em um único ponto no tempo (resultados vetoriais). Atualmente implementado como uma consulta de curto alcance que retorna a última amostra.
Atualmente, apenas GET é suportado para endpoints de consulta. Alguns clientes usam POST por padrão, então você pode precisar configurá-los para usar GET. A convenção POST do Prometheus usa payloads application/x-www-form-urlencoded, que a camada HTTP do Elasticsearch rejeita como uma proteção contra CSRF antes que a solicitação chegue ao manipulador.
Para o status completo de cobertura do PromQL, consulte a postagem complementar sobre PromQL em ES|QL.
Endpoints de metadados
Os endpoints de metadados fornecem as informações necessárias para descoberta de que os clientes precisam para autocompletar, menus suspensos de variáveis e navegação de métricas.
Os endpoints de séries, rótulos e valores de rótulos aceitam match[] seletores e um intervalo de tempo (start/end). O parâmetro match[] aceita um seletor de séries do Prometheus como http_requests_total{job="api"} e restringe a resposta às séries temporais correspondentes. Isso mantém as respostas rápidas e relevantes em clusters com grande número de métricas. Por exemplo:
O primeiro retorna todas as séries para http_requests_total onde job="api", com seus conjuntos de rótulos completos. O segundo retorna apenas os nomes dos rótulos que existem nas séries http_requests_total . O terceiro retorna apenas os valores instance que aparecem nas séries correspondentes.
GET /_prometheus/api/v1/metadata é diferente: ele retorna tipo e unidade para cada métrica, opcionalmente filtrada por nome via um parâmetro metric.
Não aceita match[] seletores nem um intervalo de tempo. No Prometheus, os metadados são coletados de alvos ativos de coleta (as linhas HELP, TYPE e UNIT que eles expõem), então a resposta não envolve uma varredura de dados. O Elasticsearch não possui um repositório de metadados dedicado como esse, então a implementação atual descobre os metadados das métricas acessando os dados de séries temporais das últimas 24 horas. Isso mantém a consulta rápida sem exigir uma varredura completa do índice. Esse período retrospectivo de 24 horas é fixo atualmente: a API de metadados do Prometheus não expõe os parâmetros start ou end que o Elasticsearch poderia usar para torná-la ajustável pelo usuário.
A seguir, você verá como funcionam os endpoints de metadados, inclusive os comandos TS_INFO e METRICS_INFO que os sustentam.
Pré-filtragem de índices
Todos os endpoints de consulta e metadados aceitam um segmento de caminho opcional {index} após /_prometheus/:
Isso restringe quais índices do Elasticsearch a consulta executa antes de qualquer avaliação de expressão começar. Em clusters com muitos fluxos de dados distribuídos entre equipes ou ambientes, isso evita a varredura de índices não relacionados e pode reduzir significativamente a latência da consulta. Você pode configurar fontes de dados separadas por padrão de indexação para fornecer às equipes acesso segmentado às suas próprias métricas.
Uma nota sobre a Escrita Remota
Para ingestão, o Elasticsearch também expõe o endpoint padrão Prometheus Remote Write:
POST /_prometheus/api/v1/writeingere séries temporais por meio do protocolo Prometheus Remote Write v1. A versão 2 ainda não é suportada.
O Remote Write grava nos fluxos de dados de séries temporais (TSDS) existentes do Elasticsearch, não em uma camada de armazenamento separada específica do Prometheus. Os rótulos do Prometheus se tornam dimensões do TSDS e os nomes das métricas se tornam campos no mapeamento do índice. A publicação sobre a arquitetura de gravação remota aborda o mapeamento completo em detalhes, inclusive como os tipos de métricas são deduzidos e como os rótulos são armazenados com um prefixo labels..
Como funciona
Nos bastidores, todos os endpoints funcionam da mesma forma: analisam os parâmetros HTTP de entrada, constroem um plano de execução ES|QL, executam-no contra fluxos de dados de séries temporais e convertem o resultado colunar de volta para o formato JSON que os clientes do Prometheus esperam.
TS_INFO e METRICS_INFO
Os endpoints de metadados precisam responder a perguntas como "quais rótulos existem?" ou "quais tipos de métricas estão definidos?" em potencialmente milhões de séries temporais, sem varrer cada ponto de dados.
Internamente, os endpoints de metadados do Prometheus respondem a essas perguntas construindo planos ES|QL em torno de dois novos comandos de processamento: METRICS_INFO e TS_INFO. Você não precisa usar esses comandos diretamente para usar a API do Prometheus, mas eles são as primitivas centrais de execução por trás das respostas dos metadados. Ambos funcionam acessando apenas um documento por série temporal para extrair seus metadados, em vez de varrer todas as amostras. Isso significa que o custo deles escala de acordo com o número de séries temporais distintas, não com o número de pontos de dados.
METRICS_INFO retorna uma linha por métrica distinta com seu nome, tipo, unidade e campos de dimensão associados. TS_INFO é mais detalhado: uma linha por combinação de métrica e série temporal, incluindo os valores reais das dimensões como objeto JSON.
Um post do blog dedicado sobre TS_INFO e METRICS_INFO será publicado em breve, abordando o modelo de execução em duas fases, como eles escalam e como usá-los diretamente no ES|QL além da API do Prometheus.
Como os endpoints de metadados usam esses recursos
Cada endpoint de metadados constrói um plano ES|QL com um desses comandos em seu núcleo.
/api/v1/labels e /api/v1/series usam TS_INFO, já que precisam de detalhes por série temporal (quais rótulos existem, quais valores de dimensão identificam cada série). /api/v1/metadata e /api/v1/label/__name__/values usam METRICS_INFO, já que precisam apenas de informações por métrica (nomes de métricas, tipos, unidades).
/api/v1/label/{name}/values para rótulos normais (qualquer coisa diferente de __name__) não usa nenhum dos comandos. Rótulos regulares como job ou instance são campos de dimensão reais no índice, portanto o endpoint pode consultá-los diretamente com uma agregação group-by. Quando match[] seletores são fornecidos, eles são convertidos em uma cláusula WHERE que filtra as séries temporais antes que a agregação seja executada.
O rótulo __name__ precisa de uma estratégia diferente porque nem sempre está presente como um campo dimensional. O Prometheus Remote Write armazena labels.__name__, mas métricas ingeridas por meio de outros caminhos (OpenTelemetry, a Bulk API) não possuem isso. O nome da métrica é codificado no próprio nome do campo (por exemplo, metrics.http_requests_total). Você poderia olhar os mapeamentos de índice para enumerar nomes de campos, mas mapeamentos, por si só, não informam qual métrica tem quais dimensões, e eles não podem ser filtrados pelos valores de rótulos de um seletor match[]. METRICS_INFO pode fazer ambos: enumera nomes de métricas entre índices enquanto respeita os filtros upstream WHERE.
Em todos os casos, a camada da API lida com a tradução de volta para as convenções do Prometheus: removendo os prefixos de armazenamento labels. e metrics. e gerando automaticamente __name__ para métricas não-Prometheus que não o possuem.
Conclusão
O resultado: qualquer cliente compatível com o Prometheus pode consultar e explorar as métricas do Elasticsearch por meio de endpoints que ele já entende. As métricas de gravação remota, as métricas do OpenTelemetry e as métricas indexadas por outros caminhos aparecem por meio da mesma API, com suporte dos mesmos índices TSDS.
Todas as APIs do Prometheus mencionadas aqui estão disponíveis como prévia técnica no Elasticsearch Serverless hoje. Para clusters autogerenciados e implantações hospedadas no Elastic Cloud Hosted, as APIs estão disponíveis como prévia técnica no Elasticsearch 9.4, com exceção de GET /_prometheus/api/v1/metadata. Para experimentar localmente, use start-local.
Perguntas frequentes
As APIs de consulta e metadados compatíveis com o Prometheus funcionam apenas com dados ingeridos via Remote Write?
Não. A API compatível com Prometheus roda sobre qualquer fluxo de dados de série temporal (TSDS) do Elasticsearch. Os mesmos índices que contêm métricas do Prometheus Remote Write, OpenTelemetry ou Bulk API são consultados diretamente por meio do PromQL, sem nenhuma camada de armazenamento extra para operar.
Por que meus clientes Prometheus falham ao chamar os endpoints de consulta com POST?
Atualmente, apenas GET é compatível com os endpoints de consulta do Prometheus. Alguns clientes usam como padrão o POST com application/x-www-form-urlencoded, que a camada HTTP do Elasticsearch rejeita como uma proteção CSRF antes que a solicitação chegue ao manipulador. Configure o cliente para usar GET.
Posso direcionar uma consulta Prometheus para um subconjunto de índices no Elasticsearch?
Sim. Cada endpoint de consulta e de metadados aceita um segmento {index} opcional, como /_prometheus/metrics-prod-*/api/v1/query_range. Isso restringe a consulta aos índices correspondentes antes da avaliação, o que evita varrer dados não relacionados.
Como a API nativa do Prometheus se compara a executar um servidor dedicado do Prometheus?
O Elasticsearch consolida o Prometheus Remote Write, o OpenTelemetry e outros caminhos de ingestão em um único armazenamento baseado em TSDS, que pode ser consultado por meio do PromQL ou do ES|QL. Você mantém a compatibilidade com o cliente Prometheus enquanto reutiliza recursos existentes do Elasticsearch, como armazenamento de longo prazo, ILM e correlação com logs e rastreamentos armazenados no mesmo cluster.
Conteúdo relacionado

23 de março de 2026
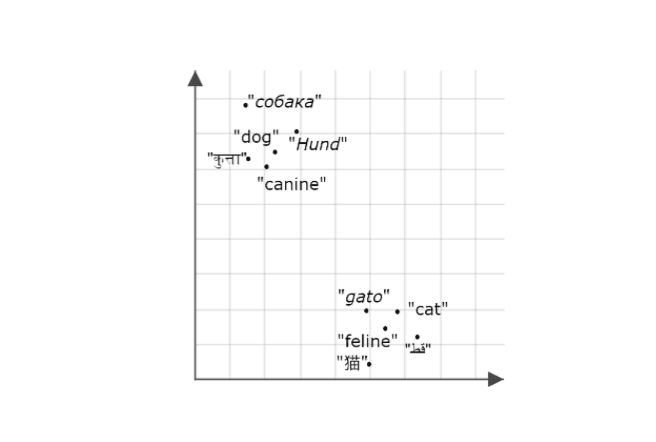
Usando a API de Inferência Elasticsearch junto com modelos de Hugging Face
Aprenda a conectar o Elasticsearch a modelos do Hugging Face usando endpoints de inferência e a construir um sistema multilíngue de recomendação de blogs com busca semântica e conclusões de chat.
27 de março de 2026
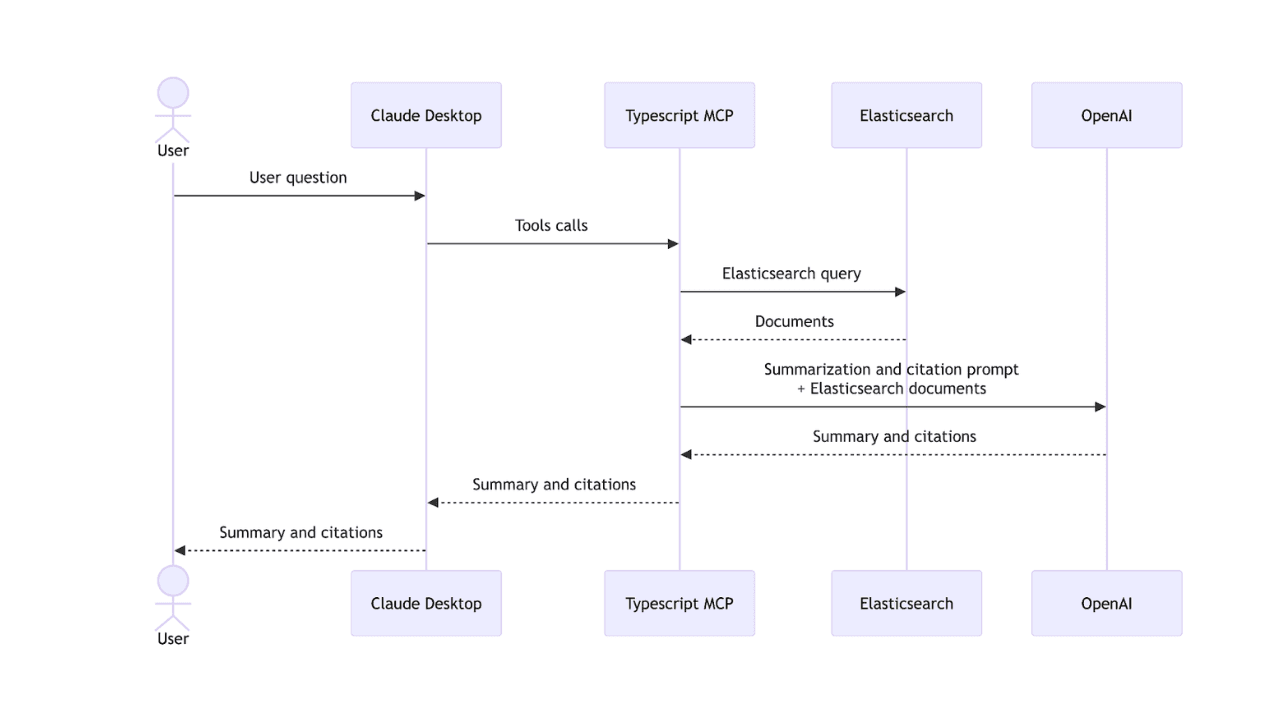
Criando um servidor MCP do Elasticsearch com TypeScript
Saiba como criar servidor MCP do Elasticsearch com TypeScript e Claude Desktop.
17 de março de 2026
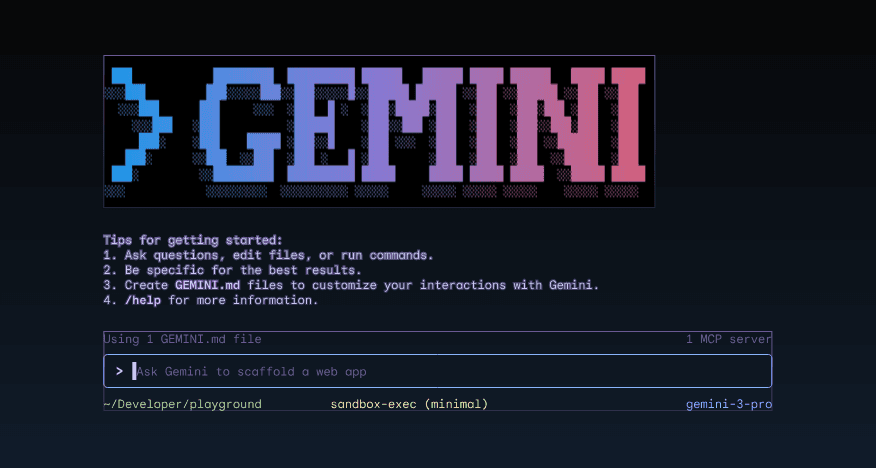
A extensão Gemini CLI para Elasticsearch com ferramentas e recursos
Apresentamos a extensão da Elastic para a CLI Gemini do Google, que permite buscar, extrair e analisar dados do Elasticsearch em fluxos de trabalho de desenvolvedores e agentes.
1 de janeiro de 2026
Uma introdução aos modelos Jina, sua funcionalidade e seus usos no Elasticsearch
Confira os embeddings multimodais Jina, o Reranker v3 e os modelos semânticos de embedding, além de como usá-los nativamente no Elasticsearch.

6 de novembro de 2025
Construindo um agente de conhecimento com recuperação semântica usando Mastra e Elasticsearch.
Aprenda como construir um agente de conhecimento com recuperação semântica usando Mastra e Elasticsearch como armazenamento vetorial para memória e recuperação de informações.