Seamlessly connect with leading AI and machine learning platforms. Start a free cloud trial to explore Elastic’s gen AI capabilities or try it on your machine now.
In 2020, Meta published a paper titled “Retrieval-Augmented Generation for Knowledge-Intensive NLP Tasks”. This paper introduced a method for expanding the knowledge of Language Models (LLMs) beyond their initial training data by leveraging external databases. Since then, this approach has garnered significant attention from researchers and remains a prominent and highly discussed topic due to its substantial benefits. These advantages encompass the ease of updating the knowledge database, enabling smaller models to match the performance of larger models on specific tasks, allowing generation to generalize to domains outside their training data, reducing the occurrence of hallucinations, and more.
All these experiments and discoveries invariably revolve around measuring the model's performance on a given task. Unfortunately, assessing the quality of generated text poses a significant challenge, given its inherent openness and permissiveness. In a “search” scenario, there exists an “ideal” document ranking, which allows for straightforward comparisons to gauge how closely one aligns with this ideal ranking. However, when it comes to evaluating the quality of generated text in terms of answering questions or summarizing content, the task becomes considerably more complex.
In this blog, our primary focus will be on RAG (Retrieval-Augmented Generation) Question Answering tasks and more specifically on closed-domain QA. We will delve into some of those various metrics commonly employed in this field. We will thoroughly explore these metrics and explain the decisions made at Elastic to effectively monitor model performance.
N-gram metrics
In this family of metrics, the idea is to check how similar generated text is from “ground truth”. There are many variations based on this idea, and we will only talk about a few of them.
BLEU score
- BLEU score : The Bilingual Evaluation Understudy, known as BLEU, is a metric employed to assess the quality of a machine-generated passage when compared to one or multiple reference passages. It quantifies the resemblance by analyzing the presence of shared n-grams (sequences of n consecutive words). The BLEU score is assigned within a range from 0 to 1, with a higher score signifying a closer alignment between the generated text and the reference text (see below).

Fig.1 - 1-gram precision (also called BLEU-1) used to calculate BLEU which is built out of these scores for different n-grams and an additional factor for brevity
ROUGE score
- ROUGE score : The Recall-Oriented Understudy for Gisting Evaluation is usually used to assess the effectiveness of machine-generated summaries. It evaluates how similar a generated passage is to reference passages by counting shared words or phrases. ROUGE differs from BLEU in its scoring, as it calculates recall, while BLEU calculates precision. This means ROUGE primarily focuses on determining how much information from the reference passages is contained within the generated passage. This characteristic makes ROUGE a popular choice for tasks related to summarization.
METEOR score
- METEOR score : Metric for Evaluation of Translation with Explicit Ordering is a metric widely used in the field of machine generation. METEOR differs from the previously mentioned metrics by incorporating the harmonic mean of precision and recall. Additionally, it takes synonyms, stemming and word order (via fragmentation penalty) into account when assessing word matching. These attributes contribute to METEOR achieving a stronger correlation with human judgments compared to BLEU.
While these metrics serve as valuable tools for quick and straightforward evaluation of LLMs, they have certain limitations that render them less than ideal. To begin with, they fall short when it comes to assessing the fluency, coherence, and overall meaning of passages. They are also relatively insensitive to word order. Furthermore, despite METEOR's attempts to address this issue through synonyms and stemming, these evaluation tools lack semantic knowledge, making them blind to semantic variations. This problem is particularly acute in assessing long texts effectively, as treating text as a mere bag of passages is overly simplistic. Additionally, reliance on 'template answers' makes them expensive to use in large-scale evaluations and introduces bias toward the exact phraseology used in the template. Lastly, for specific tasks, studies have revealed that the correlation between BLEU and ROUGE scores and human judgments is actually quite low. For these reasons, researchers have tried to find improved metrics.
Intrinsic metrics
Perplexity (PPL)
Perplexity (often abbreviated as PPL) stands as one of the most common metrics for assessing Language Models (LLMs). Calculating perplexity necessitates having access to the probability distribution for each word generated by your model. It is a measure of how confidently the model is able to predict the sequence of words. The higher the perplexity, the less confidently the model predicts the observed sequence. Formally, it is defined as follows:
where is the log predicted probability of the token conditioned on other tokens (!= i) in the sentence according to the model. To illustrate, below is an example of how perplexity is computed for a model with a vocabulary of just three words.

Fig.2 - Perplexity score example
A significant benefit of perplexity is its speed to compute because it solely relies on output probabilities and doesn't involve an external model. Additionally, it tends to have a strong correlation with the quality of a model (although this correlation may vary depending on the test dataset being used).
Nonetheless, perplexity comes with certain limitations that can pose challenges. Firstly, it relies on the information density of the model, making it difficult to compare two models that differ in vocabulary size or context length. It is also impossible to compare scores between datasets, as some evaluation data may have intrinsically higher perplexity than others. Moreover, it can be overly sensitive to vocabulary discrepancies, potentially penalizing models for expressing the same answer differently, even when both versions are valid. Lastly, perplexity isn't well-suited for evaluating a model's ability to handle language ambiguity, creativity, or hallucinations. On ambiguity especially, words which are poorly determined by the rest of the sequence push up perplexity, but they aren’t indicators of poor generation or understanding. It could potentially penalize a model which understands ambiguity better than a less capable one. Due to these shortcomings, the NLP community has explored more advanced extrinsic metrics to address these issues.
Model-based metrics
Intrinsic and N-gram metrics have a significant drawback in that they don't leverage semantic understanding to evaluate the accuracy of generated content. Consequently, they may not align as closely with human judgement as we want. Model-based metrics have emerged as a more promising solution to tackle this issue.
BERTScore
- BERTScore : To understand what a sentence really means from a semantic standpoint, BERTScore uses the famous Transformer-based model BERT. It looks at both the sentence we want to evaluate and a reference sentence, and then it compares how similar they are by leveraging the contextual embeddings of the tokens in both sentences. The final score is computed as a weighted combination of the cosine similarity of the closest token pairs.
BLEURT
- BLEURT : The basic concept closely resembles BERTScore, as it relies on a Transformer-based model to assess the similarity between a reference text and a candidate text. However, BLEURT's training incorporates two crucial enhancements. First, it uses a pre-training step using a dataset with randomized changes based on Wikipedia content to simulate generated output variability. Additionally, it uses a fine-tuning step that incorporates human ratings to refine its performance.
BARTScore
- BARTScore : The idea is to translate the problem of evaluating a generated text to a text generation problem. Using a specifically trained sequence-to-sequence model based on BART, it is capable of getting a score using the weighted log probability of one generated text y given another input text x. BARTScore supports the evaluation of generated text from different perspectives (faithfulness, precision, recall, …) which makes it powerful.

Fig.3 - Kendall’s Tau correlation of different metrics on WMT19 dataset from BARTScore paper
BERTScore and BLEURT could be seen essentially as n-gram recalls but using contextual representation. BARTScore, on the other end, is closer to a perplexity measurement, between a target and a generated text, using a critic model rather than the model itself. While these model-based metrics offer strong evaluation capabilities, they are slower than BLEU or PPL because they involve external models. The relatively low correlation between BLEU and human judgement in many generation contexts mean this trade-off is justified. Simple similarity based metrics are still popular for selecting LLMs (as seen in the Hugging Face leaderboard). This approach might serve as a reasonable proxy, but given the capabilities of current state of the art LLMs it is not sufficient.
UniEval: Elastic’s choice for evaluating RAG
UniEval unifies all evaluation dimensions into a Boolean Question Answering framework, allowing a single model to assess a generated text from various angles. For example, if one of the evaluation dimensions is relevance, then one would ask the model directly "Is this a relevant answer to this question ?”. Given a set of tasks determined by the evaluation dimensions, a model is trained which is able to evaluate generated text with respect to those dimensions. Employing T5 as the foundational model, UniEval uses a two-step training process. The initial step, called “intermediate multitask learning”, utilizes the query and context to address multiple tasks unified as boolean QA tasks from pre-existing relevant datasets. Subsequently, the second step entails sequential training, wherein the model learns, dimension by dimension, how to evaluate distinct aspects of the generated text. The pre-trained UniEval model is geared towards summarization, yet we think that RAG Question Answering can be viewed as an aggressive summarization task when avoiding parametric memory for accurate responses. It has been trained across the following dimensions:
- Coherence, gauging the formation of a cohesive body from all sentences.
- Consistency, assessing the factual alignment between the answer and the context.
- Fluency, evaluating the quality of individual sentences.
- Relevance, measuring the factual alignment between the answer and the ground truth.

Fig.4 - Pearson and Spearman correlations on the Topical-Chat benchmark averaged on all UniEval dimensions
While UniEval is quite powerful, it doesn't currently hold the title of a “state-of-the-art” evaluation model, as of our writing. It seems that a GPT-based evaluator, like G-Eval, could potentially show a stronger correlation with human judgment than UniEval (only in the context of a GPT-4 based evaluator). However, it's essential to consider the significant cost difference. UniEval is an 800-million-parameter model, whereas GPT-4 is estimated to boast a massive 1.76 trillion parameters. We firmly believe that the slight advantage seen with G-Eval-4 isn't justified by the substantial increase in cost.
Real-world usage of UniEval
We're just starting to explore UniEval, and we intend to incorporate it into numerous exciting projects involving text generation in the future. However, armed with this evaluation model, we decided to test its capabilities by addressing three specific questions.
Can we easily compare LLMs quality with UniEval?
This is likely the first consideration that comes to mind when you have an evaluation metric. Is it an effective tool for predicting the quality of LLMs out there? We conducted a benchmark test on Mistral-7b-Instruct and Falcon-7b-Instruct to assess how distinguishable these two models are in terms of fluency, consistency, coherence, and relevance. For this benchmarking, we employed 200 queries from 18 datasets, ensuring a diverse range of contexts (including BioASQ, BoolQ, CoQA, CosmosQA, HAGRID, HotpotQA, MSMARCO, MultiSpanQA, NarrativeQA, NewsQA, NQ, PopQA, QuAC, SearchQA, SleepQA, SQuAD, ToolQA, TriviaQA, TruthfulQA). The prompt given to Mistral/Falcon includes both the query and the context containing the information needed to answer the query.

Fig.5 - UniEval evaluation of Mistral and Falcon with distribution of scores of 3600 queries. Higher score is better.
In this specific instance, it's evident that Mistral outperforms Falcon across all evaluation dimensions, making the decision quite straightforward. However, it may be more challenging in other cases, particularly when deciding between relevance and consistency, both of which are crucial for Question Answering with RAG.
Is “consistency score” correlated with the number of hallucinations generated by a model?
The experiment is straightforward. We gather about 100 queries from the SQuAD 2.0 datasets. Next, we assess a model (specifically Mistral-7B-Instruct-v0.1 in this instance, but it could be any model) using UniEval. Following that, we manually examine and annotate the generated texts that exhibit hallucinations. Afterward, we create a calibration curve to check if the “consistency score” serves as a reliable predictor for the probability of hallucinations. In simpler terms, we're investigating whether the “consistency score” and the number of hallucinations are correlated.

Fig.6 - Calibration curve for consistency on hallucinations detection
As observed, consistency turns out to be a reliable indicator of the probability of hallucinations, although it's not flawless. We've encountered situations where hallucinations are subtle and challenging to identify. Additionally, the model we tested occasionally provided correct answers that didn't originate from the prompt's context but rather from its parametric memory. In terms of the consistency metric, this resembles a hallucination, even though the answer is accurate. This is why, on average, we detect more hallucinations than the actual true number. It's worth noting that, during certain experiments where we deliberately included misleading prompts, we managed to mislead both the generation process and our evaluation of it. This proves that UniEval is not a silver bullet.
How are decoding strategies impacting evaluation dimensions?
For this experiment, we wanted to compare different ways of decoding information in Falcon-7b-Instruct. We tried several methods on 18 datasets, using 5 queries per dataset (90 queries in total):
- Greedy decoding, where we chose the most likely tokens.
- Beam decoding, which involves maintaining multiple possible paths and selecting the one with the highest overall probability (using 5 beams).
- TopK decoding, where we selected the top candidates, redistributed probability among them, and then sampled a token (with a top k value of 4).
- Nucleus decoding, similar to TopK but with a variable number of candidates based on a probability mass threshold (threshold=0.95, max_topk=50).
- Contrastive decoding, which applies a penalty to the top candidates to encourage diversity in the selection process (penalty_alpha=0.6, topk=4).

Fig.7 - Decoding strategies benchmark with UniEval
According to earlier studies, the most effective method is contrastive decoding. It's important to note that greedy decoding is holding up reasonably well in this context, even though it is recognized as a somewhat constrained strategy. This might be attributed to the focus on short answers (with a maximum of 64 new tokens) or the possibility that UniEval isn't accurately assessing the “diversity” aspect.
Conclusion
In this blog, we aimed to give some insight into the challenges involved in evaluating LLMs, particularly in the context of question answering using RAG. This field is still in its early stages, with numerous papers being published on the subject. While UniEval isn't a cure-all solution, we find it to be a compelling approach that could offer a more precise assessment of how our RAG pipeline performs. This marks the initial step in an ongoing research endeavor here at Elastic. As always, our objective is to enhance the search experience, and we believe that solutions like UniEval, or similar approaches, will contribute to the development of valuable tools for our users.
The release and timing of any features or functionality described in this post remain at Elastic's sole discretion. Any features or functionality not currently available may not be delivered on time or at all.
Elastic, Elasticsearch and associated marks are trademarks, logos or registered trademarks of Elasticsearch N.V. in the United States and other countries. All other company and product names are trademarks, logos or registered trademarks of their respective owners.
Frequently Asked Questions
What metrics are commonly used to evaluate RAG?
There are various metrics used to evaluate RAG, such as: N-gram metrics (including BLEU score, ROUGE score & METEOR score), Intrinsic metrics (like PPL), Model-based metrics (such as BERTScore, BLEURT and BARTScore), and Elastic's choice: UniEval.
How does UniEval evaluate RAG?
UniEval evaluates RAG by unifying all evaluation dimensions into a Boolean Question Answering framework, allowing a single model to assess a generated text from various angles.
Related Content
July 10, 2026
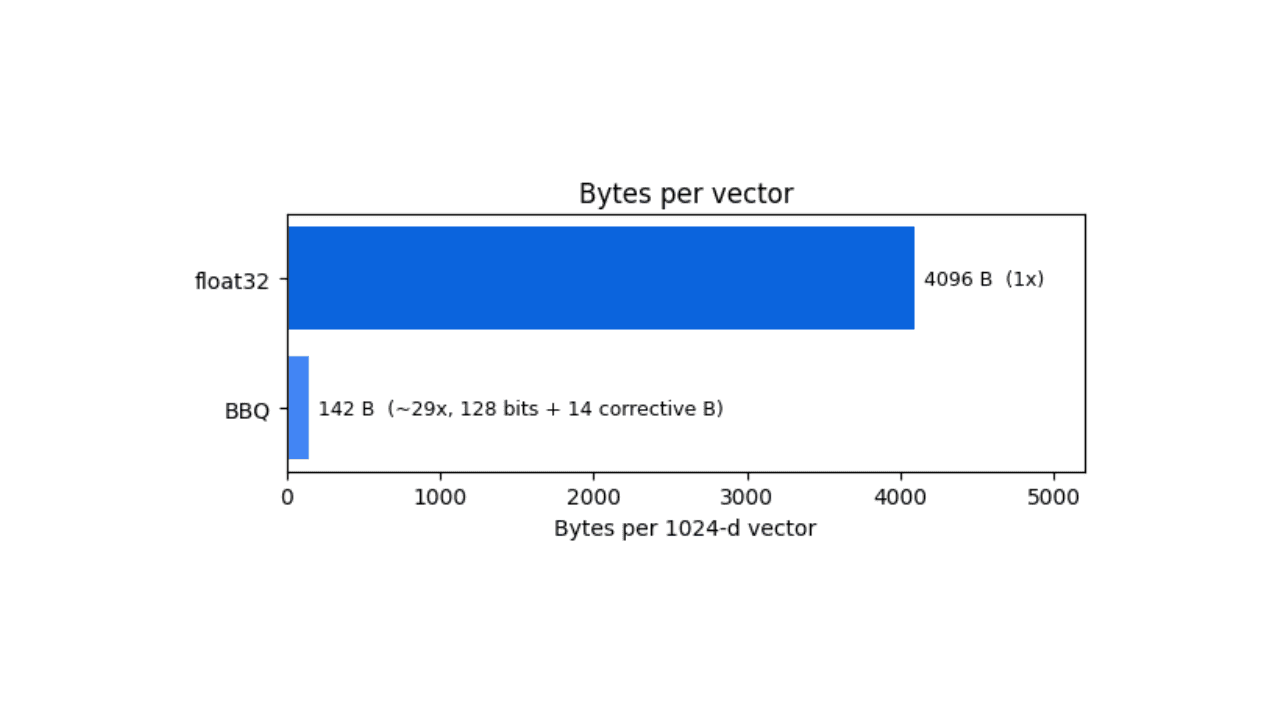
How BBQ shrinks Jina v5 embeddings by 29x without losing recall in Elasticsearch
A hands-on test comparing BBQ and float32 vector indices in Elasticsearch, measuring memory, disk and recall@10 across five languages.
July 7, 2026
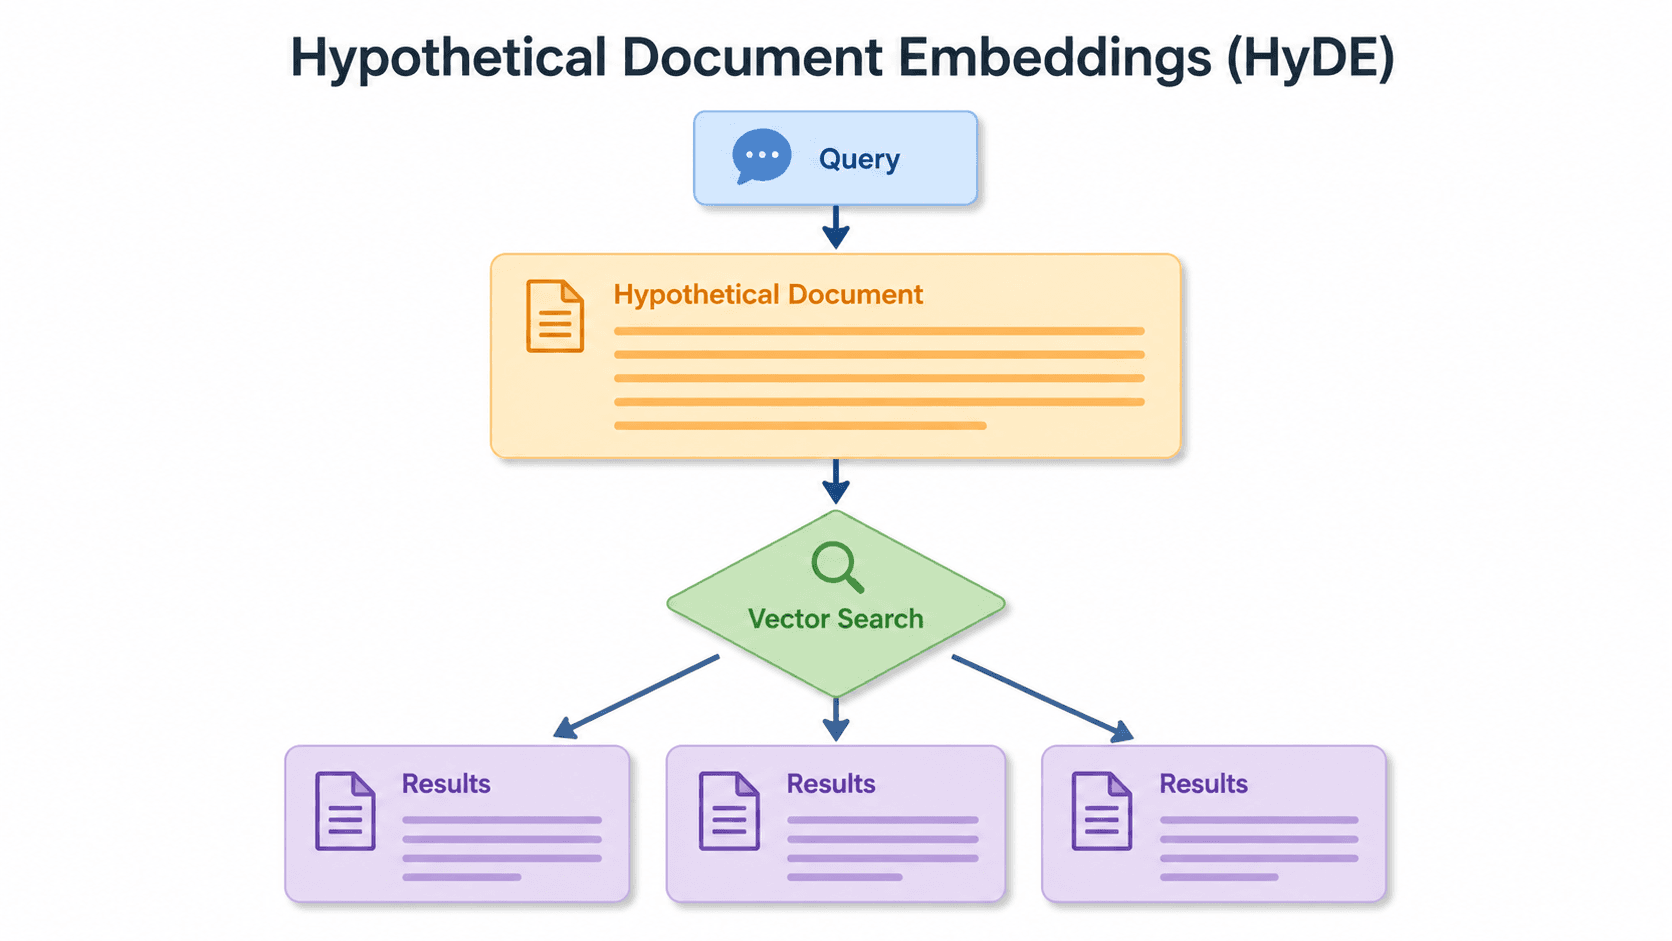
Short queries, formal documents: how HyDE improved semantic search precision by 50% in Elasticsearch
HyDE boosts semantic search precision and recall by 50% on short queries. Here's how to implement it in Elasticsearch with the Inference API and semantic_text.
July 21, 2026
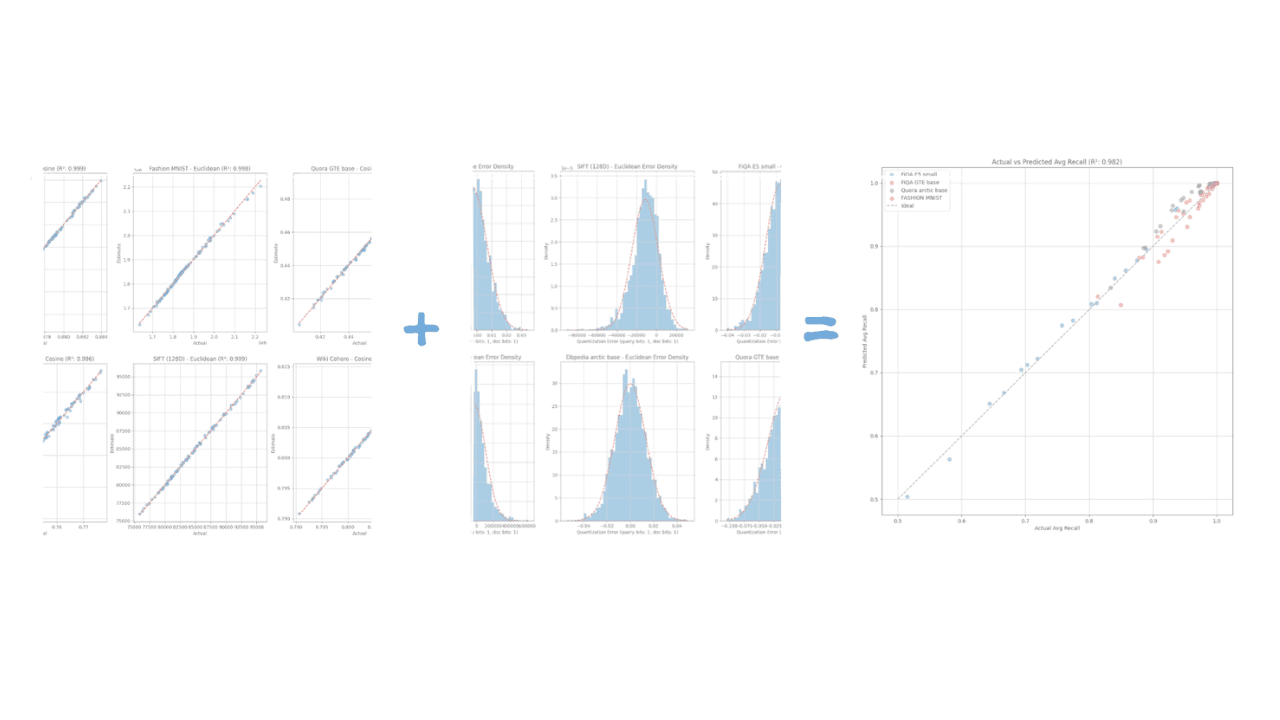
How Elasticsearch auto-tunes vector quantization to hit your recall target
Learn the geometric model that lets Elasticsearch predict recall with R² > 0.98 accuracy and auto-select vector quantization parameters from a small data sample.
June 24, 2026
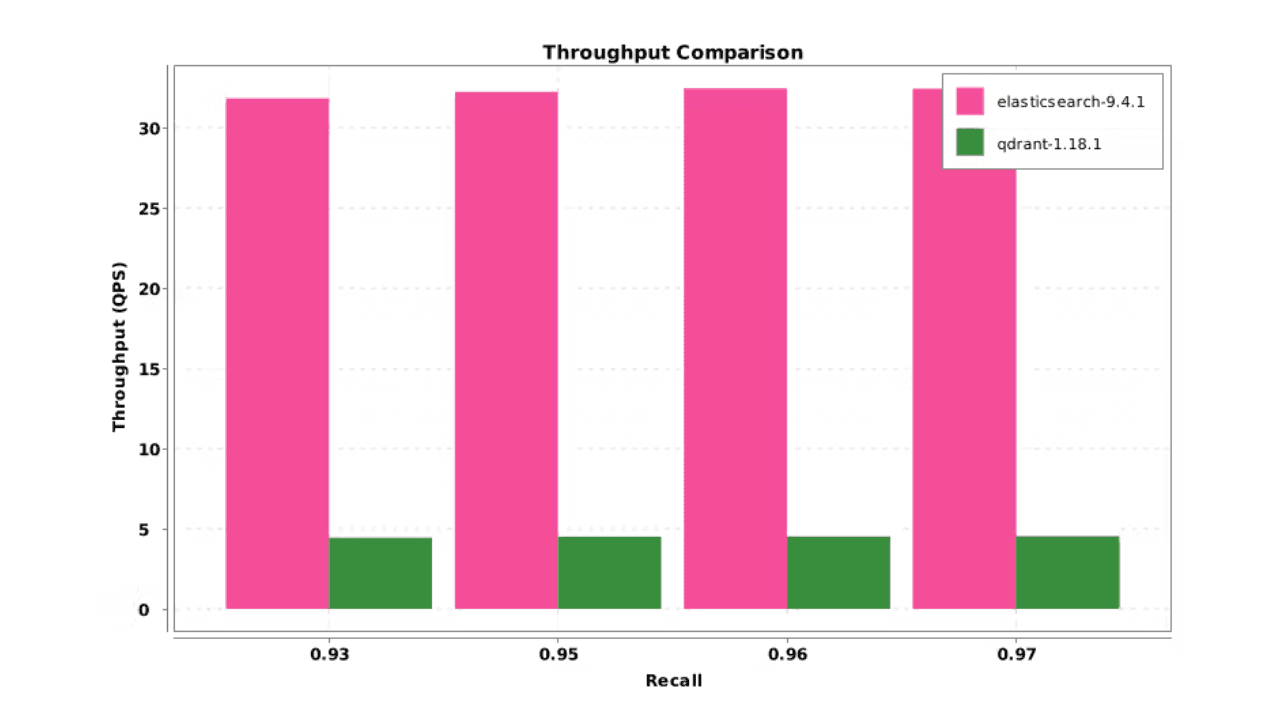
Elasticsearch DiskBBQ delivers 7x faster vector search than Qdrant on network-attached storage
Elasticsearch DiskBBQ achieves up to 7x higher vector search throughput than Qdrant at comparable recall on network-attached storage. Explore the benchmark methodology and full results.
July 24, 2026
How Elasticsearch detects multiple change points in time series with 0.99 recall
ES|QL's CHANGE_POINT command finds structural shifts, variance changes and spikes in any metric in ~1ms, without tuning anything per series.