Elastic Observability 8.12: GA for AI Assistant, SLO, and Mobile APM support

 Share on Twitter
Share on Twitter

 Share on LinkedIn
Share on LinkedIn

 Share on Facebook
Share on Facebook

 Share by Email
Share by Email

 Print this page
Print
Elastic® Observability 8.12 announces general availability (GA) for the AI Assistant, Service Level Objectives (SLO), and Mobile APM support:
Service Level Objectives (SLO): Now GA, allows SREs to monitor and manage business and operation SLOs by tracking service performance, error budgets, reliability, and business goals.
Observability AI Assistant: Now GA, provides users with the ability to get contextual insights from generative AI LLMs and internal private information with the use of RAG.
Mobile APM support based on OpenTelemetry: Now GA, allows monitoring of iOS and Android Native apps including pre-built dashboards for visualizing service interdependencies, end-to-end trace waterfall, error and crash analytics.
Elastic Observability 8.12 is available now on Elastic Cloud — the only hosted Elasticsearch® offering to include all of the new features in this latest release. You can also download the Elastic Stack and our cloud orchestration products, Elastic Cloud Enterprise and Elastic Cloud for Kubernetes, for a self-managed experience.
What else is new in Elastic 8.12? Check out the 8.12 announcement post to learn more >>
Service Level Objectives (SLOs)
Service Level Objectives (SLOs) has been updated from Beta to generally available for our Platinum and Enterprise subscription customers. As part of the general release, the SLOs feature has added several updates for our SRE and DevOps users.
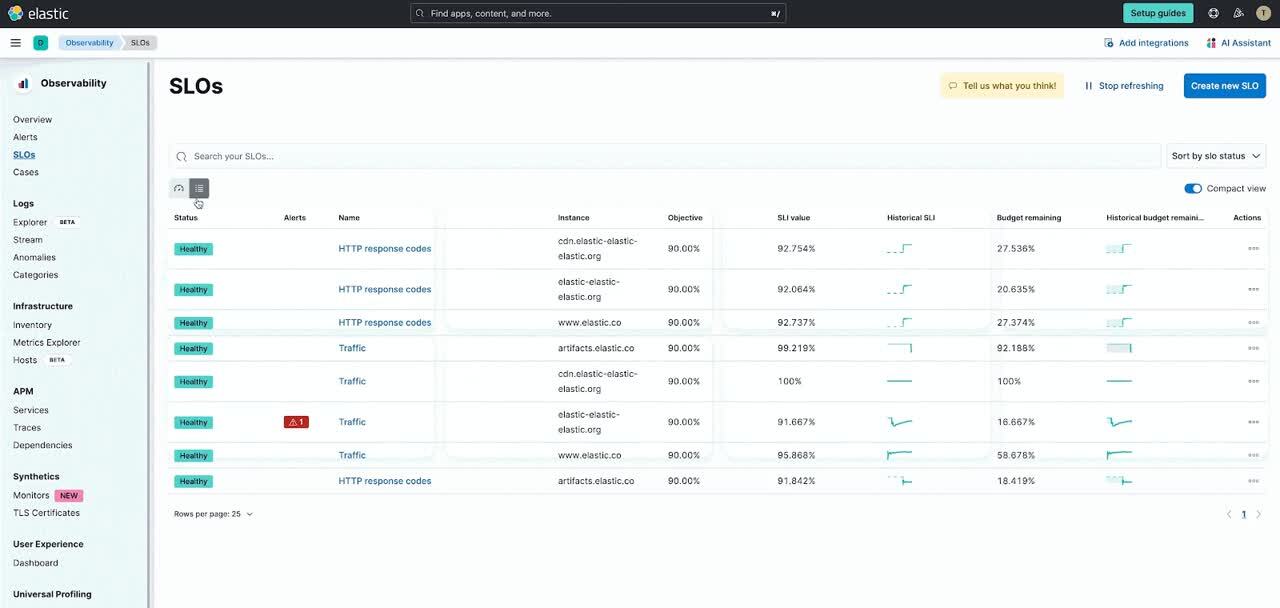
To make it easier to monitor large numbers of SLOs, users can now have multiple view options on the SLO overview page. New options for Card view and Table view are now available.
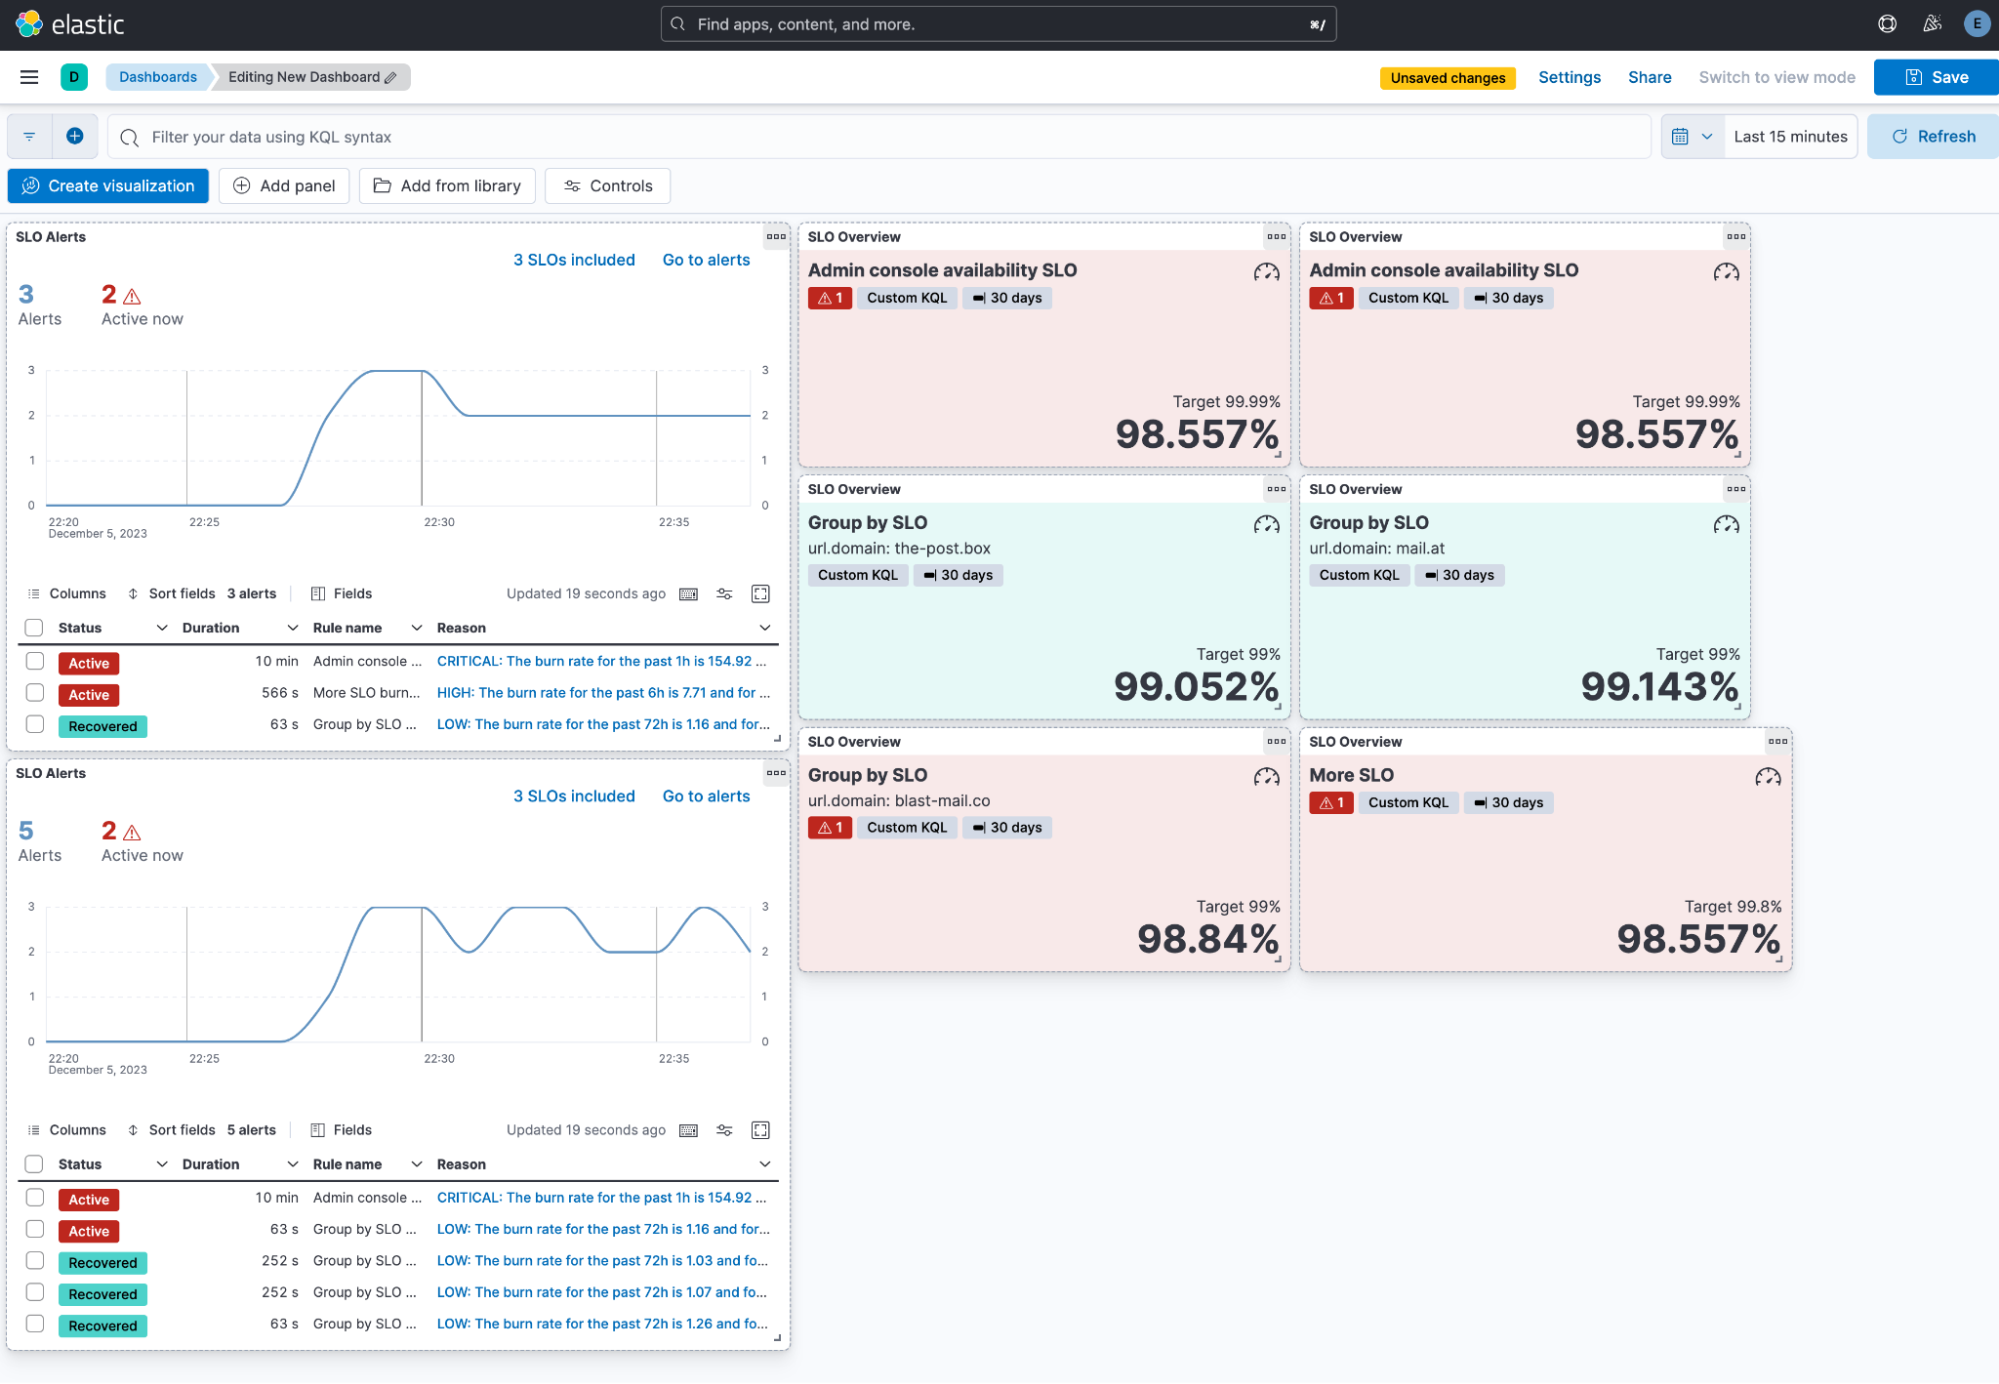
We know many of our users like to add their SLO overview visualizations to their custom dashboards. Now it is easier to add the SLO overview in the SLO details page, but you can also add an Alert visualization to view any burn rate alerts that are related to specific SLOs to dashboards as well. Users can add a new SLO alerts widget if they want to see a summary and a list of their SLO alerts. They have the option to select multiple SLOs, edit the configuration, and interact with the alert widget.
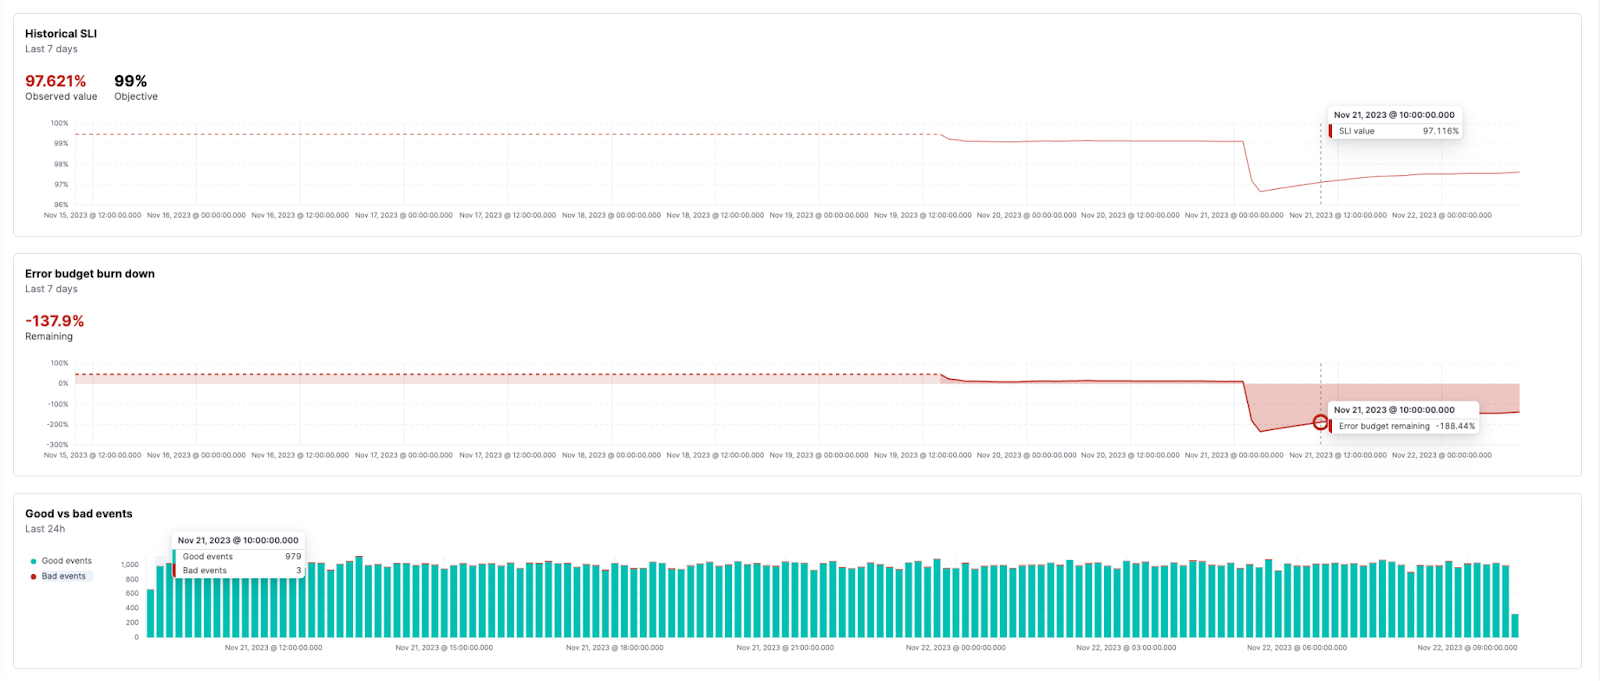
There is a new chart on the SLO details page showing the good versus bad events that have happened over the past 24 hours for faster investigation when an SLO is breached.
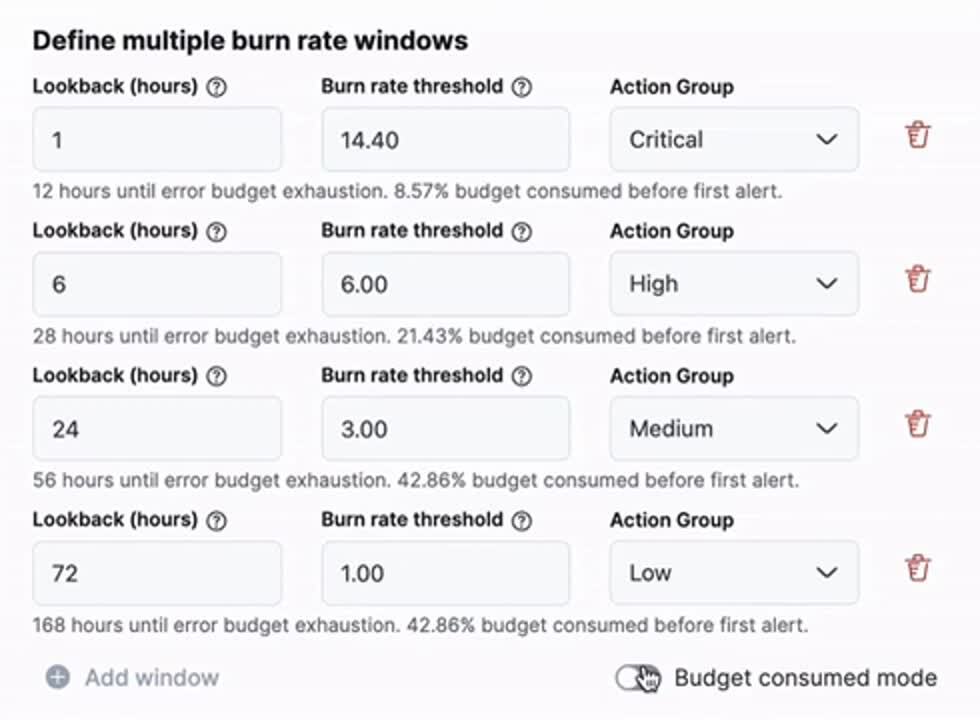
For SLO burn rate alerting, there is a new way to define your burn rate windows based on the amount of budget consumed. This will allow SREs to define how much budget they are willing to spend before they receive the alert. There is an option to switch between “burn rate mode” and “budget consumed mode” using a toggle below the window definitions. There is also helper text to view what the burn rate would be for the budget defined for the time window, as well as new corresponding helper text to show how much budget would be consumed when defining the window in “burn rate mode.”
SLOs also have a new Service Level Indicator (SLI) for Time Slice metrics in v8.12. This new SLI can be used for statistical aggregations, which allows for the use of aggregations like avg, max, min, sum, std_devation, last_value, percentile, and doc_count along with a custom equation and threshold. Because these aggregations are based on the windows size, they will be calculated based on a timeslice budgeting method.
Train your AI Assistant with an internal knowledge base
Elastic’s AI Assistant for Observability has been upgraded from tech preview to generally available for our Enterprise customers in v8.12. The AI Assistant now comes with an integrated knowledge base for organizations to link their application documentation to train the AI Assistant responses about the Observability data.
The knowledge base allows users to add documents into an Elasticsearch index, which the Assistant can then recall during interactions with the user to improve its reasoning about the user’s query. This allows the AI Assistant to link alerts with root cause troubleshooting guides, error messages with context of what they mean, and processes with what they are dependent on or how to optimize them.
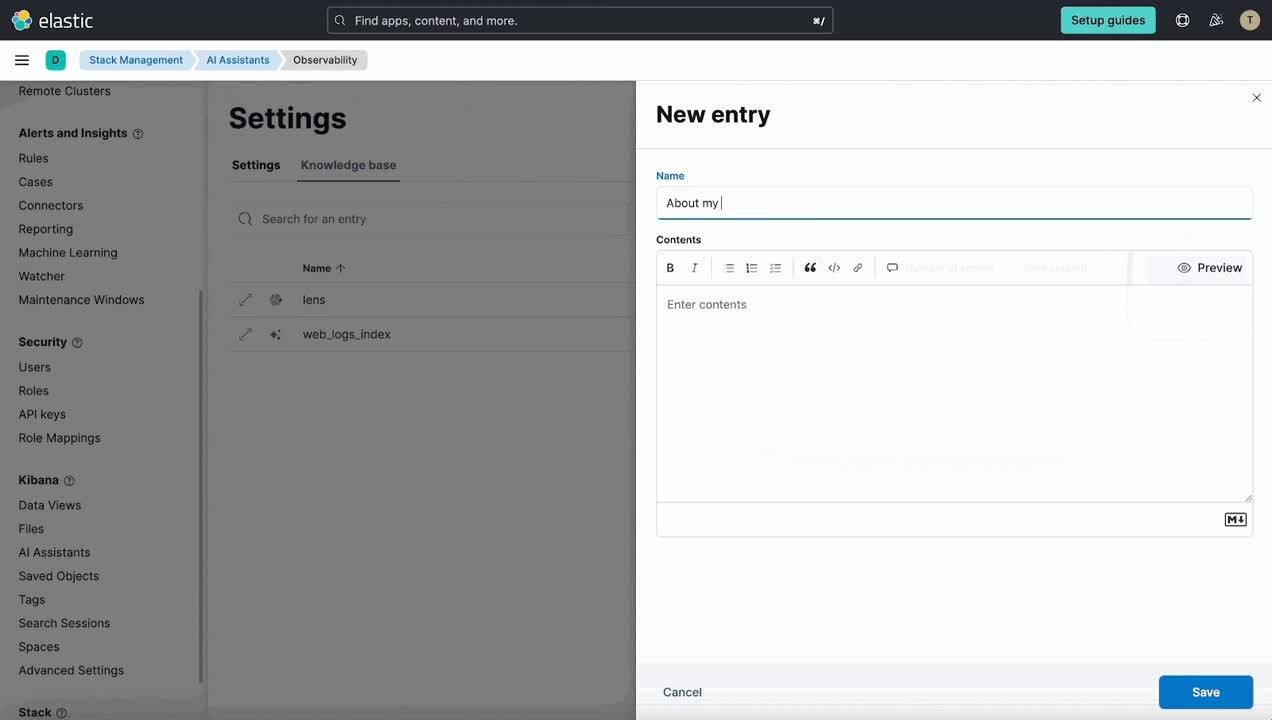
In 8.12, we have added a dedicated Settings page for the Assistant in Stack Management, which includes a UI for managing the knowledge base contents. This enables administrators to easily see the contents of the knowledge base, add a single entry, import multiple entries via a file, and edit and delete entries.
Additionally, the AI Assistant uses the knowledge base with every user prompt — which previously only happened on the first user prompt in a conversation. To reduce noise and lower token usage, v8.12 also includes a step where the LLM initially scores the documents for relevancy and only includes the relevant ones when asking the LLM to answer the user's request.
Mobile APM
Mobile APM support for iOS and Android Native apps is now generally available. Along with several enhancements in data collection, the solution includes pre-built dashboards for viewing service interdependencies and end-to-end trace waterfall and for exploring the impact of App version, OS version, device make/model, and geo location on performance, error, and crash analytics.
On the Service Overview dashboard shown below, users can see the KPIs such as crash rate, http requests, average app load time, etc., including the comparison view.
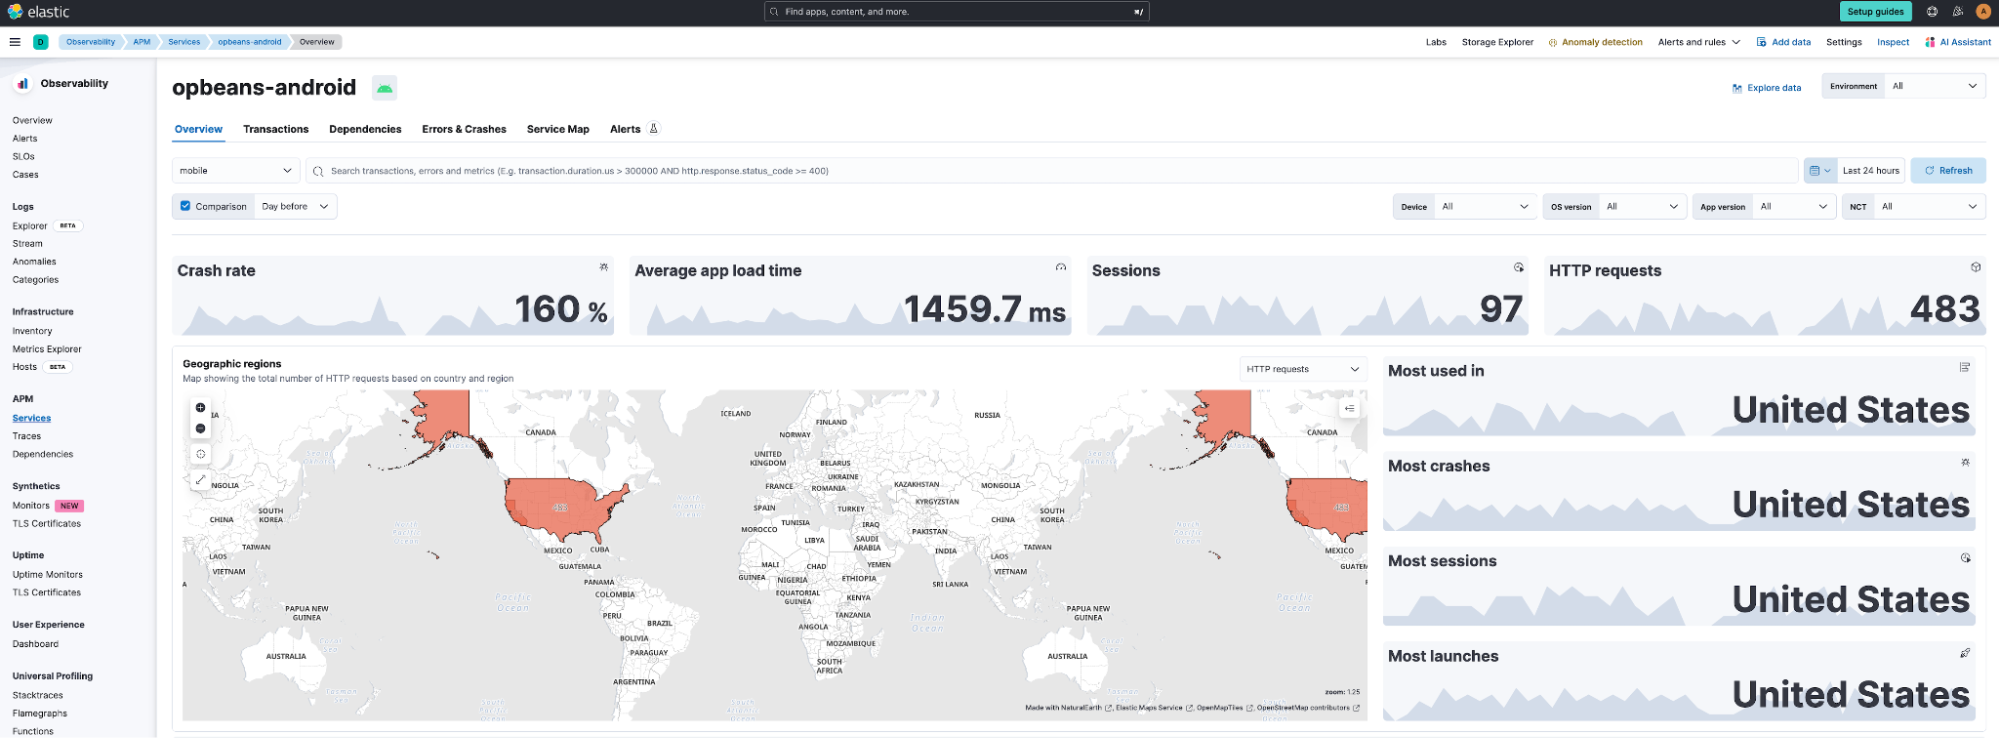
Further, the geographic distribution of user traffic is available on a map at a country and regional level. The service overview dashboard also shows trends of metrics such as throughput, latency, and failed transaction rate.
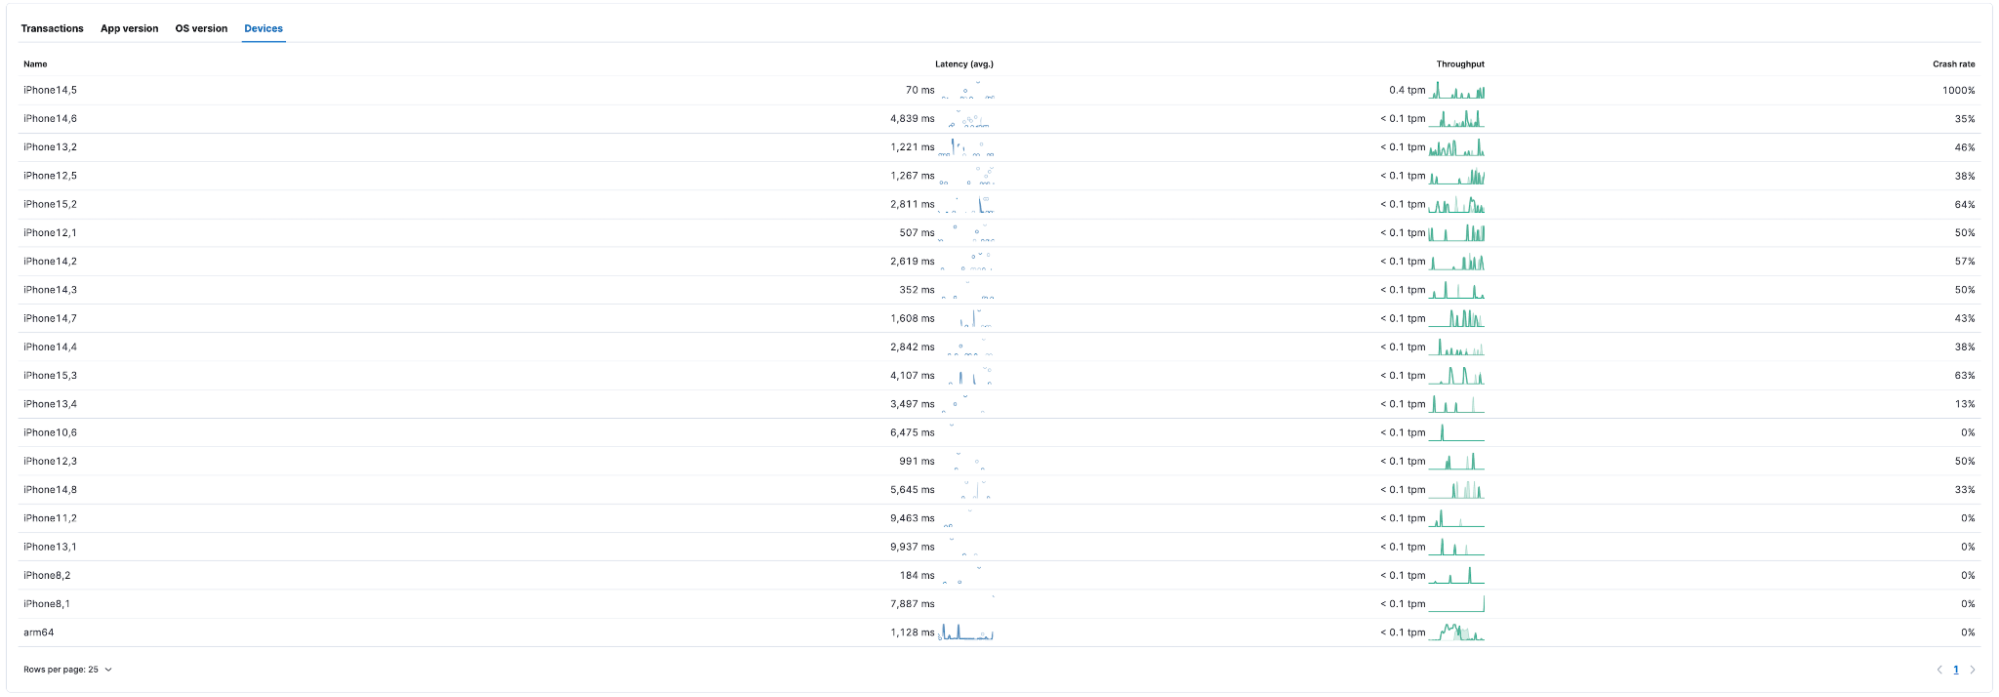
The Transactions dashboard shown below highlights the performance of the different transaction groups, including the trace waterfall for individual transactions with linkages to associated errors and crashes. Further, users can see at a glance the distribution of traffic by device make and model, app version, and OS version.
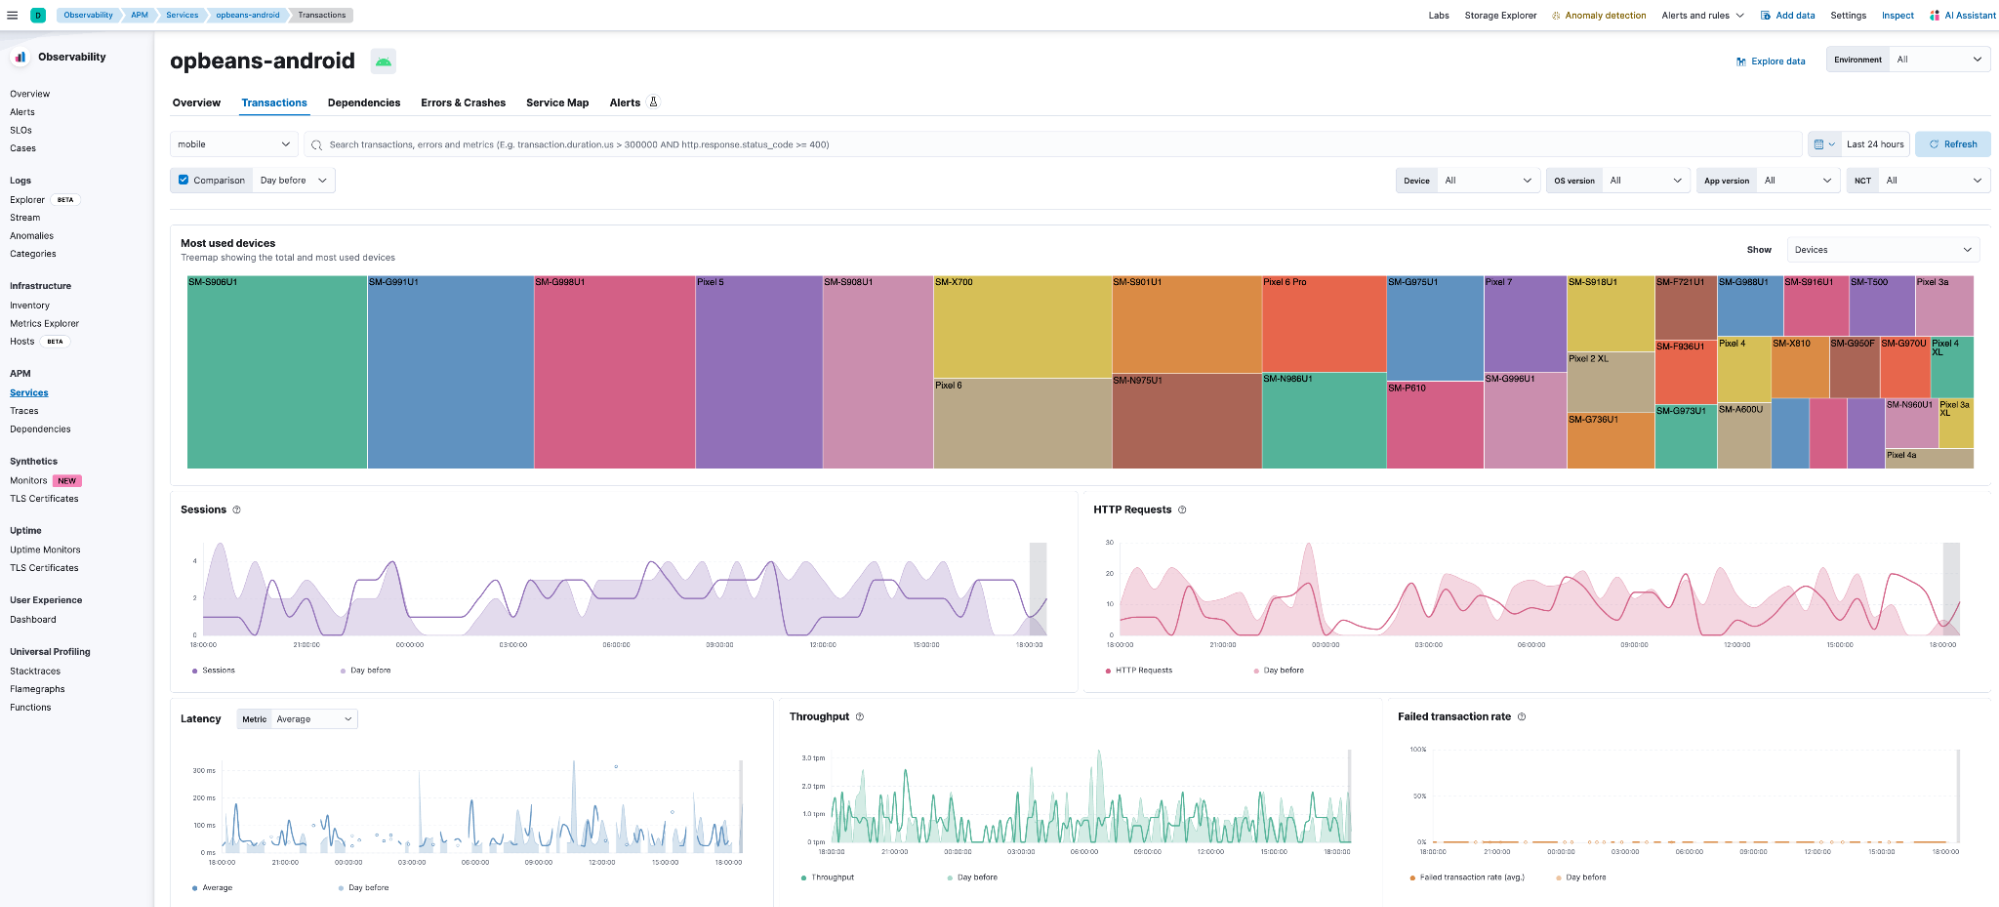
Users can also see how the device make and model impact latency and crash rate.
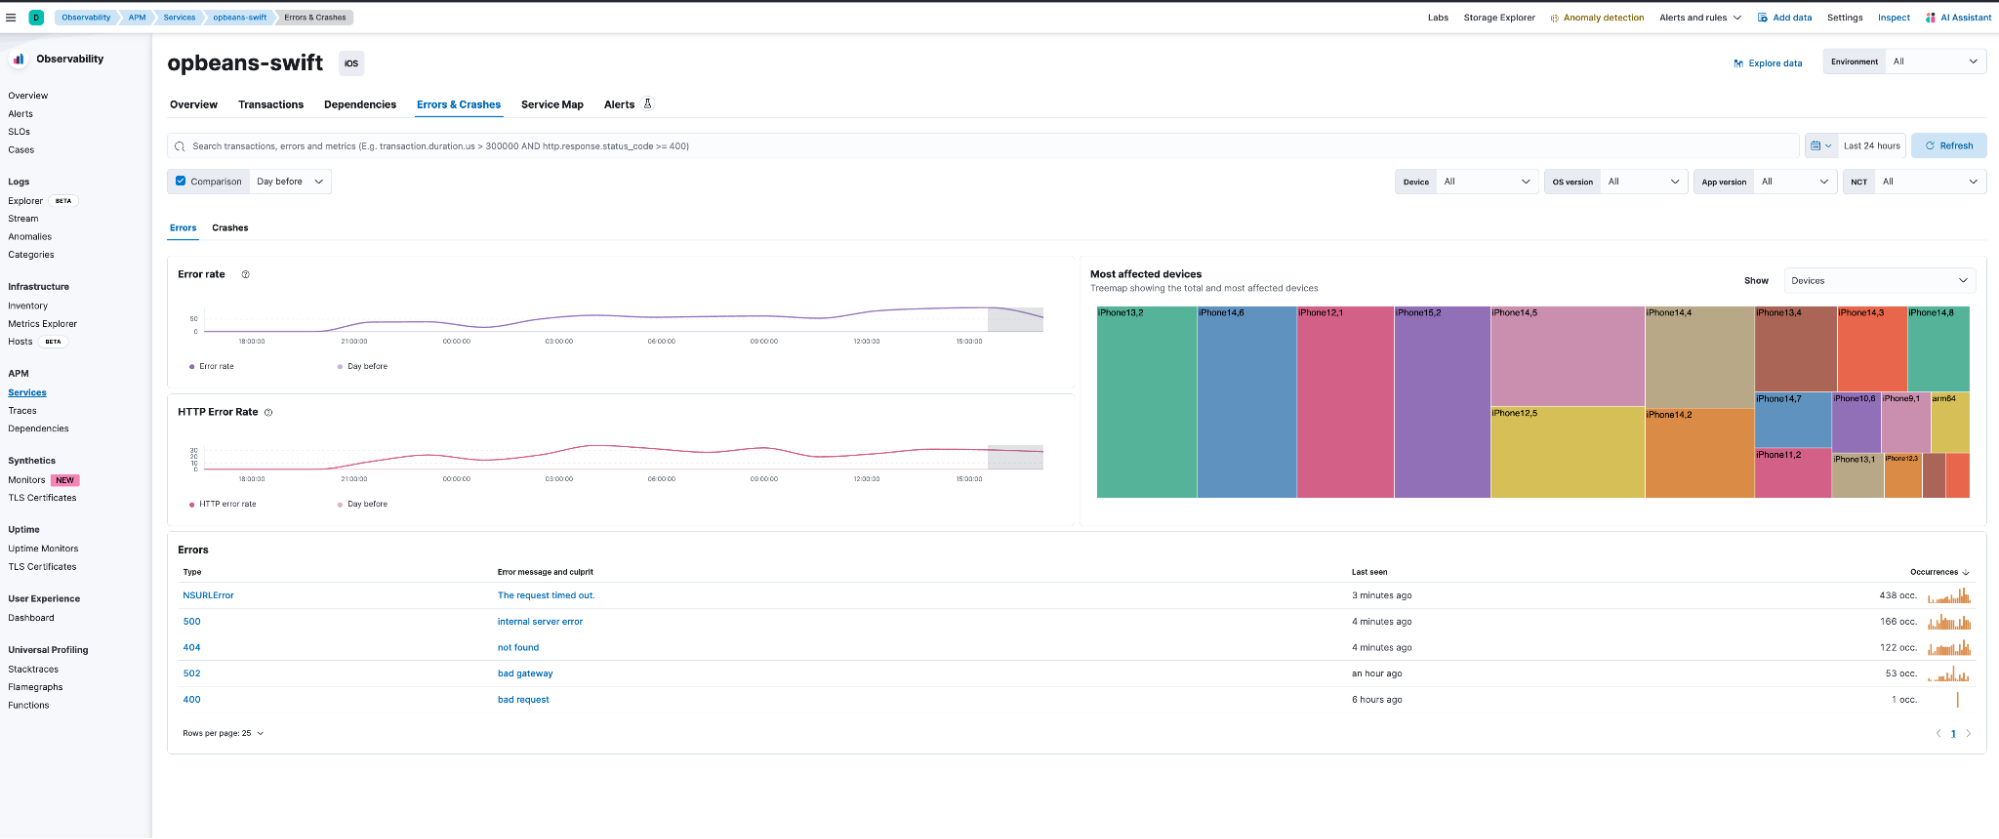
The Errors & Crashes dashboards shown below can be used for analyzing the different error and crash groups, as well as for viewing the stack traces of the individual error or crash instances. In this release, users will have to rely on other tools for de-obfuscation (Android) or symbolication (iOS) of stack traces.
The Service Map dashboard shown below can be used to visualize the end-to-end service interdependencies.
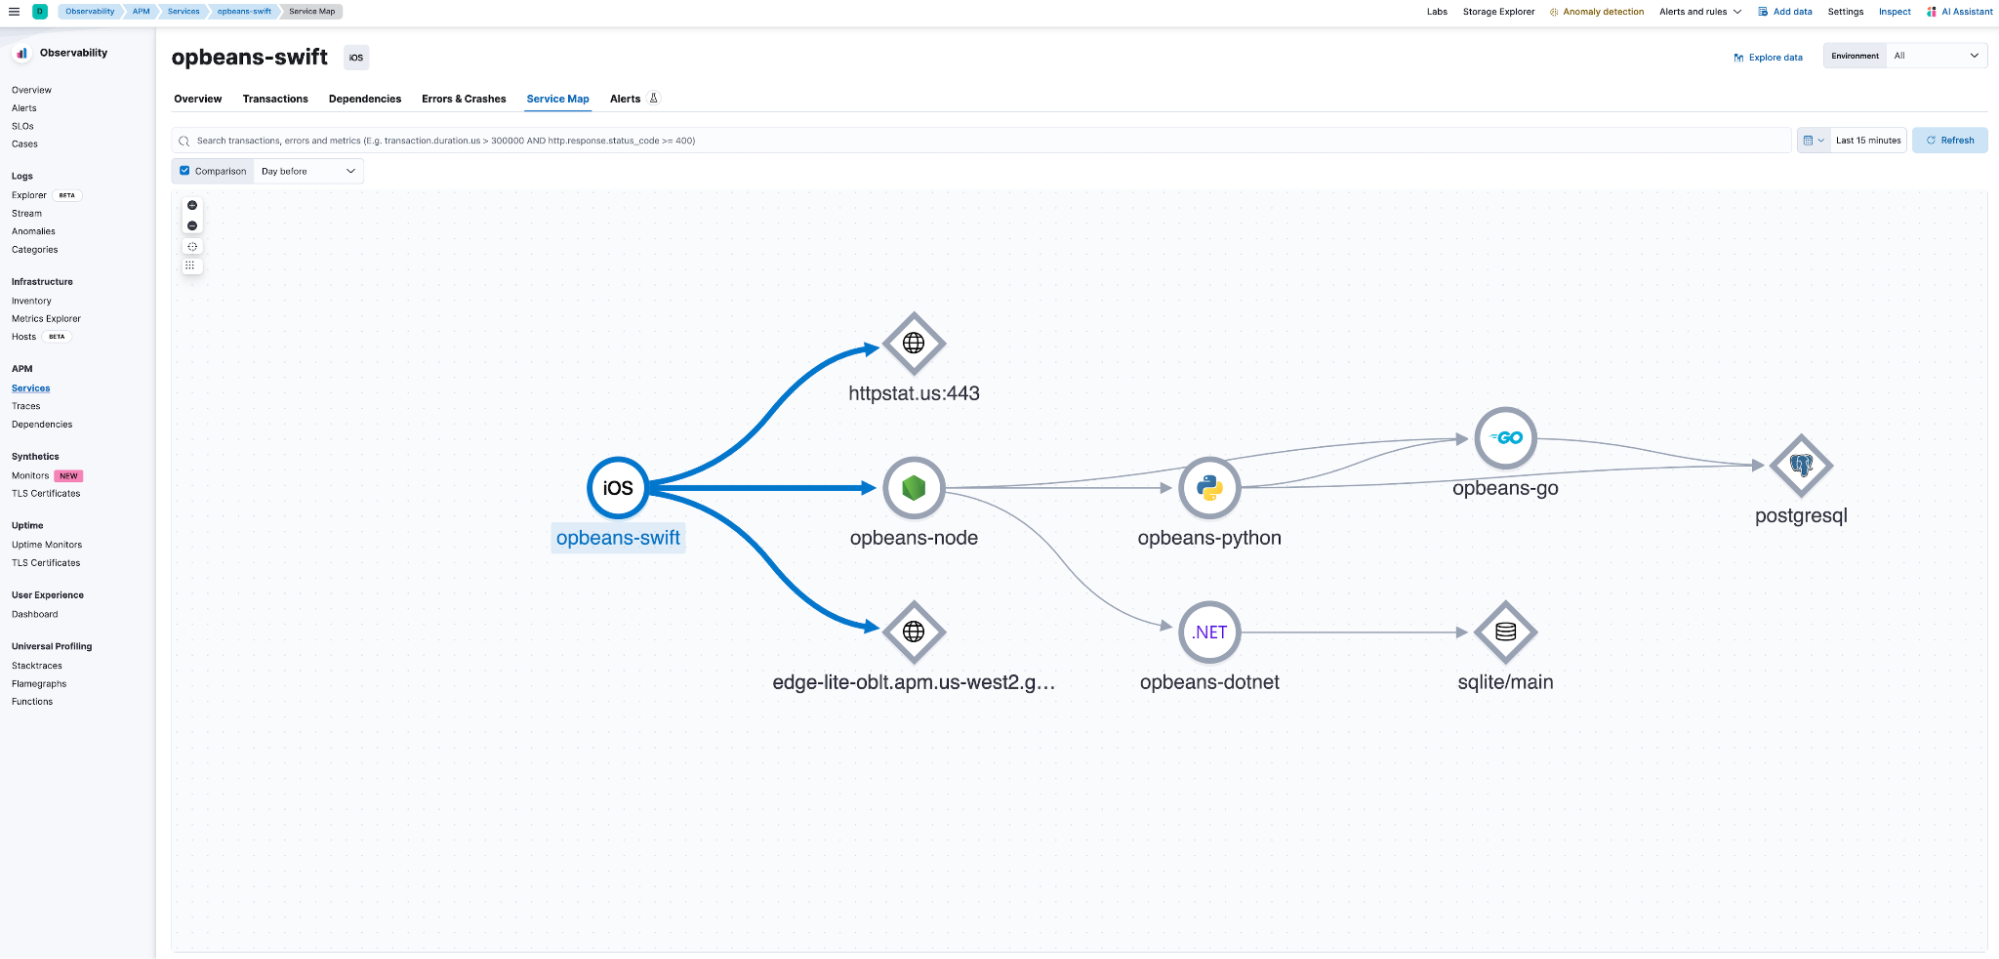
The comprehensive pre-built dashboards provide visibility into the sources of errors and bottlenecks to SREs and developers, thereby reducing MTTR and facilitating high innovation velocity.
Try it out
Read about these capabilities and more in the release notes.
Existing Elastic Cloud customers can access many of these features directly from the Elastic Cloud console. Not taking advantage of Elastic on cloud? Start a free trial.
The release and timing of any features or functionality described in this post remain at Elastic's sole discretion. Any features or functionality not currently available may not be delivered on time or at all.
Share
- Share on Twitter
Share on Twitter
- Share on LinkedIn
Share on LinkedIn
- Share on Facebook
Share on Facebook
- Share by Email
Share by Email
- Print this page
Print