Kibana 5.1.1 released
We're excited to announce the immediate release of Kibana 5.1.1!
What happened to 5.1.0, you say? The long answer is complicated and there's really no one at fault, but for the sake of this blog post let's just say that it's Simon's fault. The short answer is that we accidentally published incorrect 5.1.0 builds a couple weeks ago for about five seconds, so let's just move on without throwing blame around. See our Stack announcement for more details about why this is Simon's fault.
Onward! Despite the minor release designation there are some major features here.
Tag that cloud
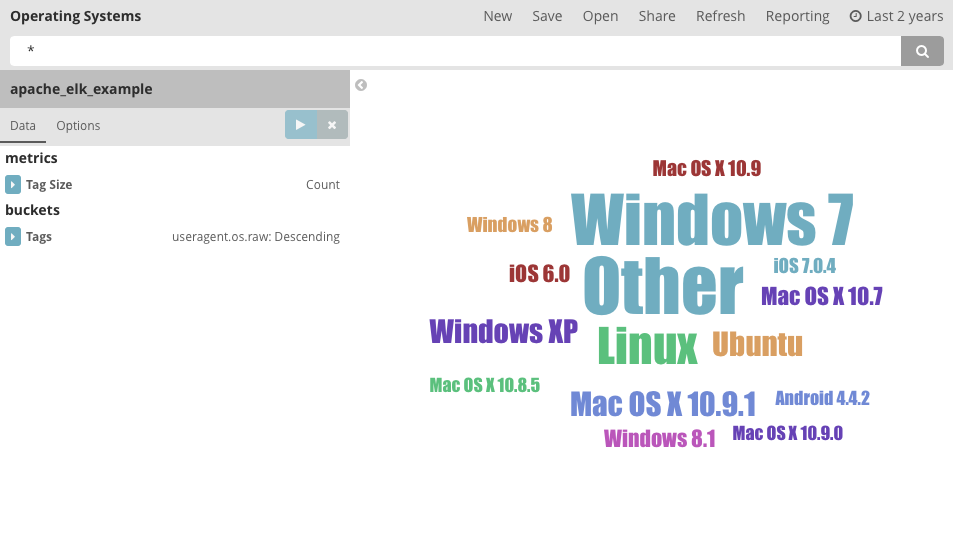
The terms agg and significant terms agg are useful for seeking out interesting parts of a large body of text data or getting statistics on tags or labels on other documents. 5.1.1 adds the tag cloud visualization to provide a graphical view of this data, with each word's size representing its importance. There's a lot you can tweak with tag cloud, including word orientation and all the font properties of the word.
Return of the charts
For Marvel 2.0 we simplified the UI considerably by removing many of the charts that were referenced less often. And of course people, a lot of people, missed them! For 5.1, we have added an Advanced View to X-Pack's monitoring feature. The index and node views both gained several charts to expose things like segment counts and detailed memory usage.
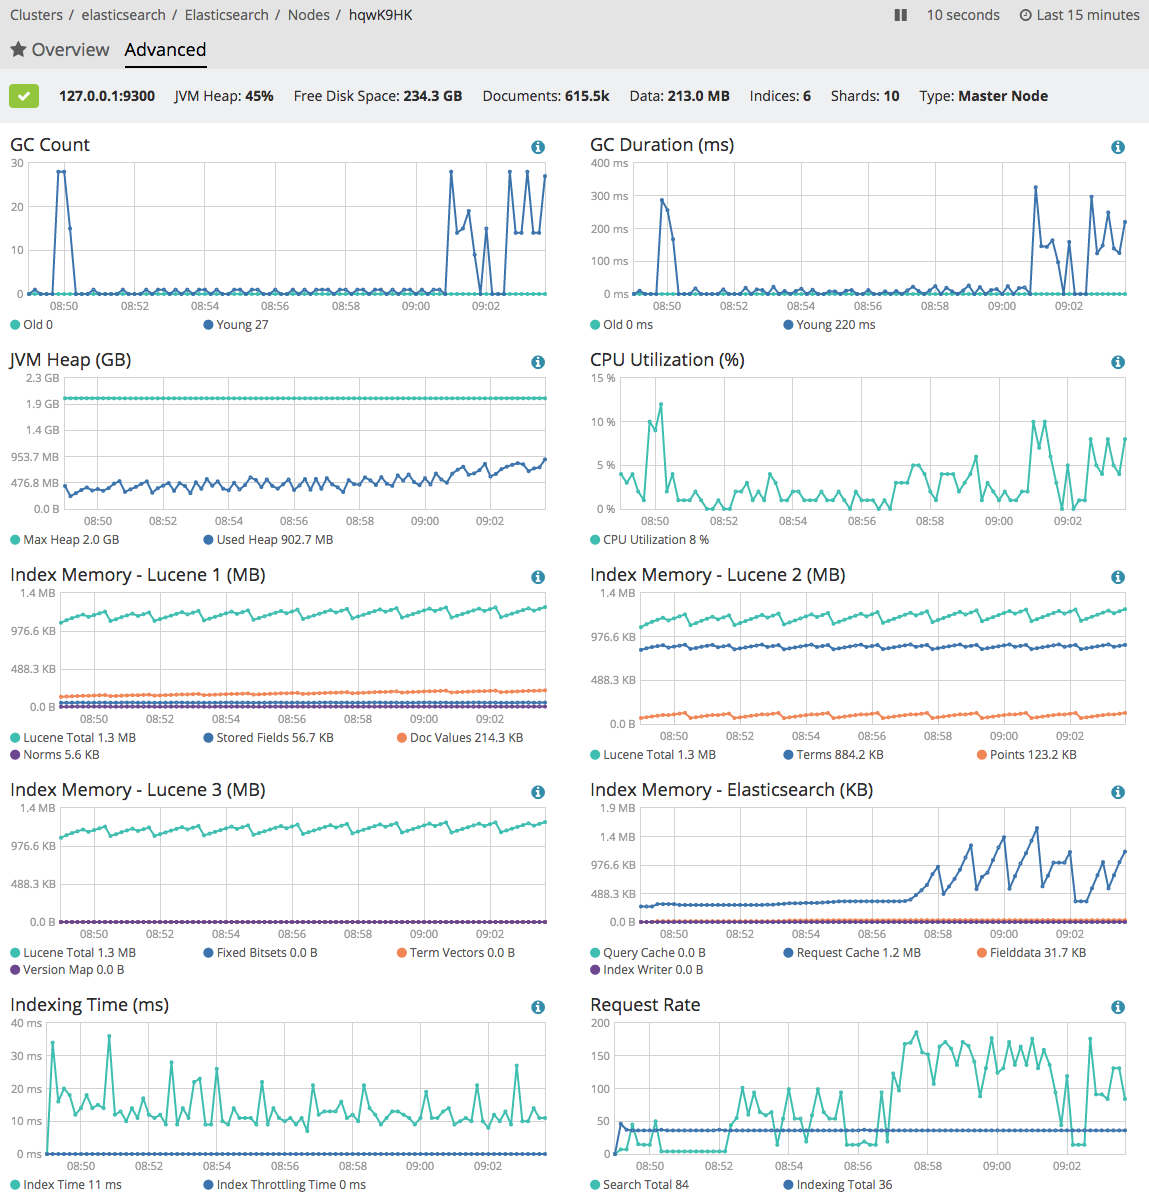
Monitoring tooltips in 5.1.1 continue to help you understand the data you're seeing. To help with usability, we moved the legend from being inside the chart to outside, so you can focus on the data with less clutter.
Your profile never looked better
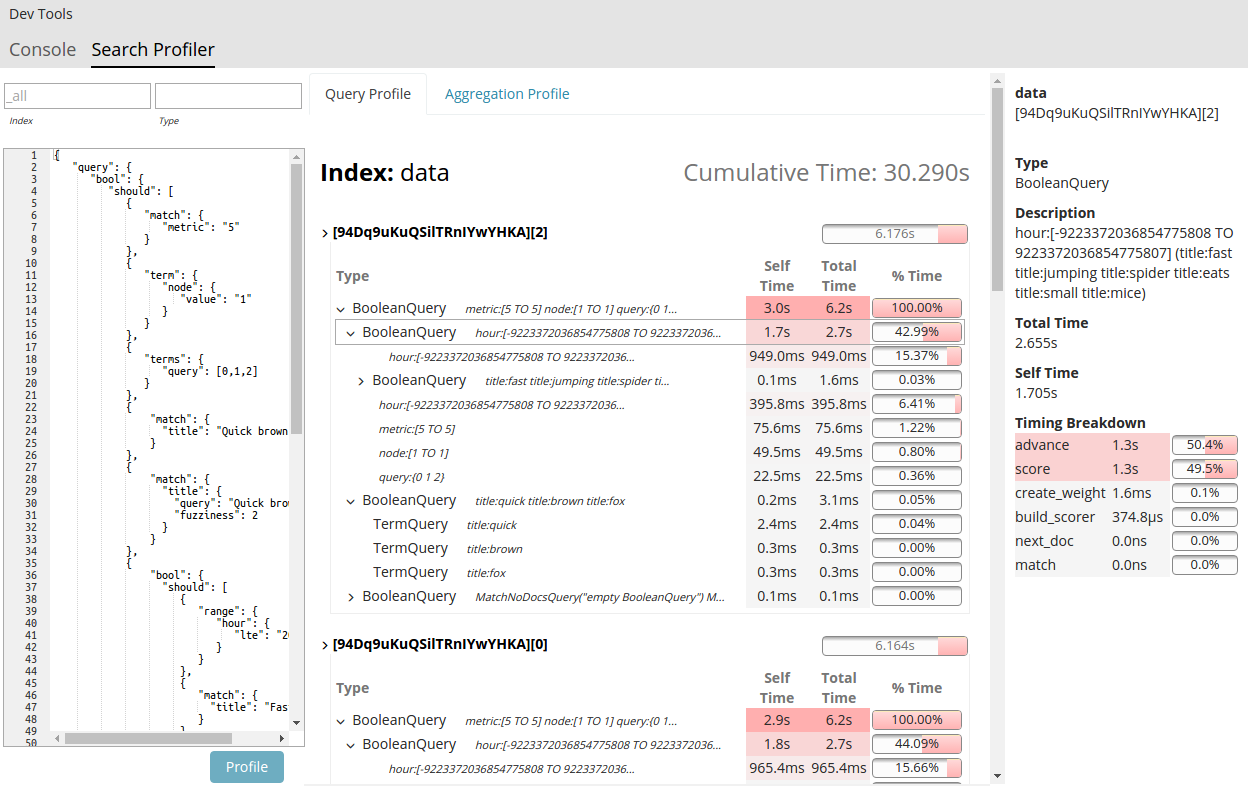
Elasticsearch 2.2 added the profile API, which allows you to get detailed information about the parts of your queries that take time. You can then refine or re-write the slower parts to improve. The iteration has been done with the REST API previously. Now, for 5.1.1, the X-Pack basic (free) install includes a UI for the profiler. You can find it in the Dev Tools area of Kibana after installing X-Pack. The profiler UI gives you a tree structure of the query with timing associated with each branch, which allows you to dig into the most time consuming parts. It can also help you quickly iterate, easily enabling the viewing of new (and hopefully faster!) queries. It's available in our Basic Edition, which is free for production or dev use with registration.
Fastbana
Speaking of performance, Kibana 5.1.1 is fast. How fast? Really efficient! Err… I mean really fast! But also more efficient, too. In this release, we made four key changes to Kibana specifically focussed on performance.
First, we improved rendering performance across the entire project. For any given UI component, the change will go unnoticed. But the cumulative effect across the entire UI is a more responsive Kibana.
Next, we took a swing at global warming by lessening the CPU load caused by the progress indicator. The net effect here was almost a 50% improvement on overall CPU usage while the progress indicator was present. That's right, that animated pink line at the top of the screen had that much of an impact. Browsers, eh?
Then we turned our attention to two long standing performance problems in Discover.
Up until 5.1.1, Discover could grind to a halt when you were searching against indexes that have a large number of fields. The primary culprit was a formatting mechanism we added all the way back in 2014. This was purely an aesthetic utility that doesn't even have a pronounced effect any longer. So we removed it, and now Discover doesn't fall over when your indexes have tons of fields.
The last performance-related change we made is a feature that requires your intervention, but it allows Discover to query indexes that have very large fields. Sort of the opposite problem as the previous paragraph, Discover would fail miserably when it encountered indexes that had even a single _source field with a huge amount of data in it. This could be anything from a large deeply nested JSON object or even binary data, neither of which are filterable in Kibana anyway. In Kibana 5.1.1, you can now configure your index patterns in the Management app to exclude specific _source fields that are too large to be used in the Discover app in Kibana.
Try it!
There are many more features in 5.1.1, and some good bug fixes as well. Check out the release notes to see the full list of changes.
As always, you can download it here. Feedback welcome, at our public repo, on twitter @elastic, or on the forums.