What’s new in 8.8
editWhat’s new in 8.8
editHere are the highlights of what’s new and improved in Elastic Security. For detailed information about this release, check out the Release notes.
Other versions: 8.7 | 8.6 | 8.5 | 8.4 | 8.3 | 8.2 | 8.1 | 8.0 | 7.17 | 7.16 | 7.15 | 7.14 | 7.13 | 7.12 | 7.11 | 7.10 | 7.9
Detection rules enhancements
editNew warning for running maintenance windows
A warning banner displays on the Rules page if a maintenance window is running. During an active maintenance window, rule actions won’t run, and alert notifications aren’t sent.
To use maintenance windows, you must have the appropriate subscription and Kibana feature privileges.
Prebuilt rule updates
Check out the latest updates to prebuilt rules. To download the latest updates, refer to Download latest Elastic prebuilt rules.
Alerts enhancements
editControl alert notifications and summaries
The following enhancements give more control over how and when alert notifications are sent. For more information, refer to Set up alert notifications.
-
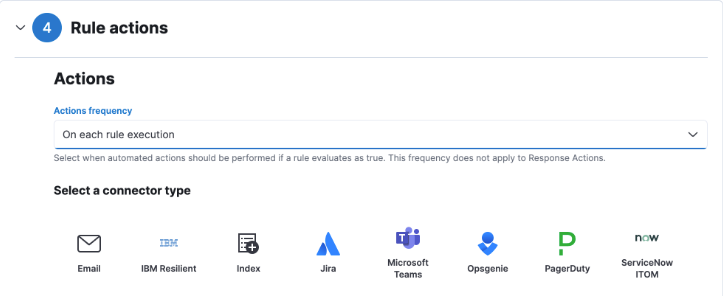
You can now specify how often alert notifications are sent to third-party systems (such as Slack, JIRA, email, etc.). You can apply your preferred frequency to all rule actions, or set notification frequency individually for each action.
- You can decide whether to be notified each time an alert is generated, or receive alert summaries.
- Instead of turning rules off to stop alert notifications, you can snooze rule actions for a specified time period. When you snooze rule actions, the rule continues to run on its defined schedule, but won’t perform any actions or send alert notifications.
Max alerts warning
When a rule reaches the maximum number of alerts it can generate in a single rule execution, the following warning is displayed on the rule’s details page and in the rule execution log: This rule reached the maximum alert limit for the rule execution. Some alerts were not created. To troubleshoot this event, we recommend you check for unexpected alerts. For more information, refer to Troubleshoot maximum alerts warning.
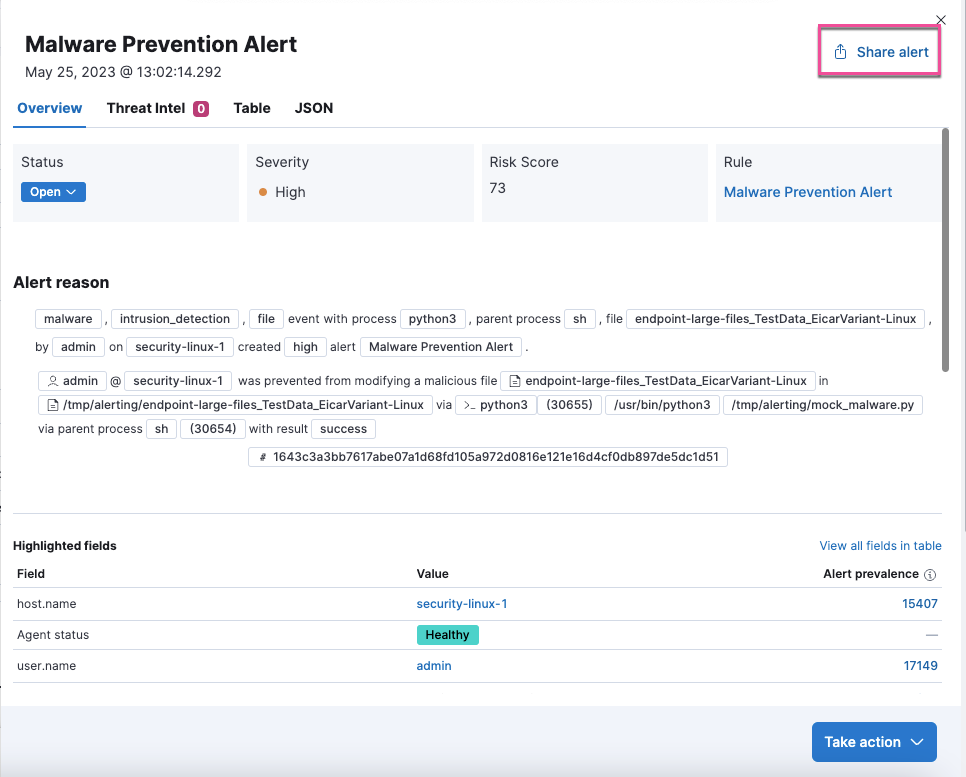
Share an alert
The Share alert button in the alert details flyout provides a shareable link you can copy and paste into browsers, cases, messages, and more.
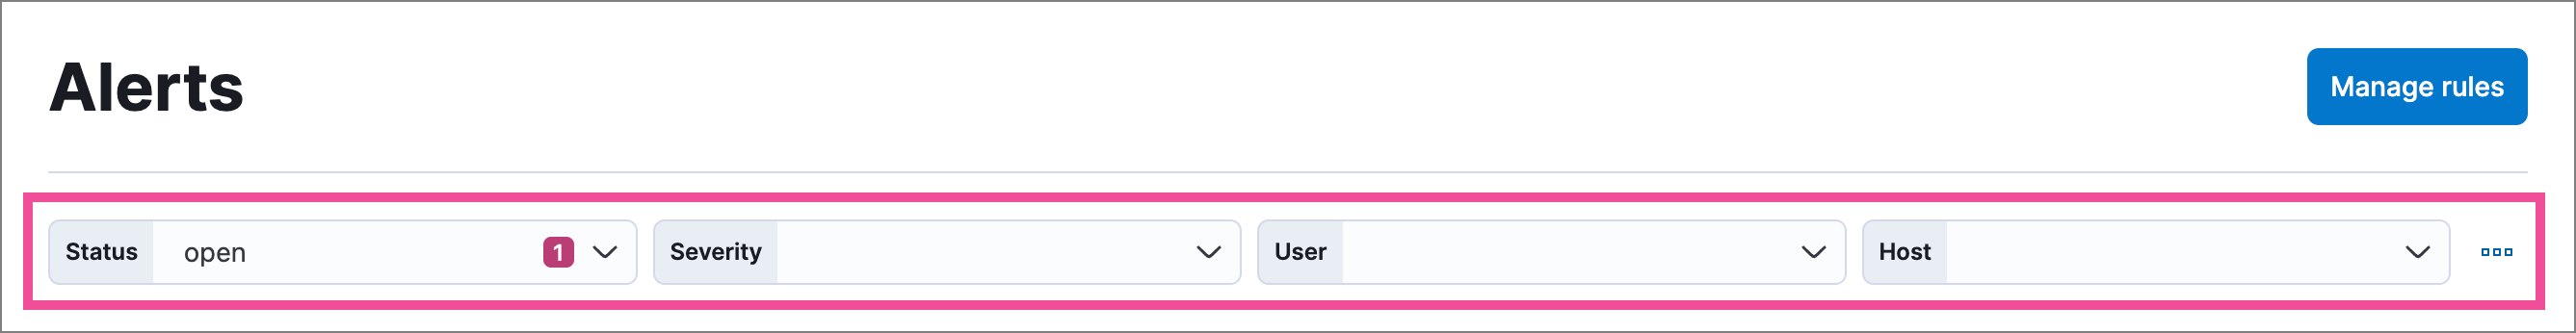
Edit filter controls on the Alerts page
The drop-down filter controls on the Alerts page allow you to filter alerts by up to four fields. By default, you can filter by Status, Severity, User, and Host, but you can edit these to filter by different fields. You can also remove, add, and reorder them.
New alert suppression options
A new rule configuration option for alert suppression allows you to specify how to handle alerts when a field that’s used for suppression does not have a value.
To learn how to reduce notifications and alerts, check out our analysis comparison here.
Filter alerts from the Entity Analytics dashboard
In the Entity Analytics dashboard, you can now filter alerts on the Alerts page by selecting the number link in the column.
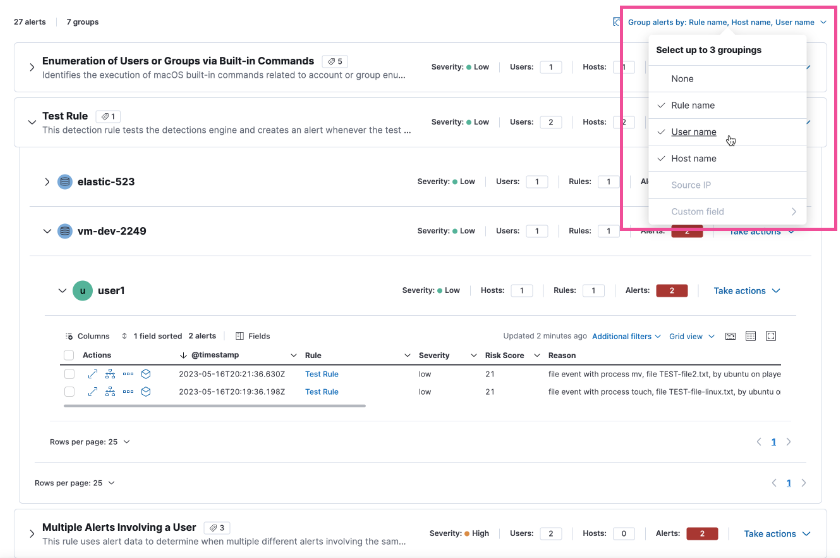
Select up to three fields for grouping alerts
You now select up to three fields to group alerts by to customize your alerts view. Each group is nested in the Alerts table by order of selection.
Visualization actions and inline actions added to more places in the Elastic Security app
editVisualization actions, which allow you to examine Elasticsearch queries used to retrieve data throughout the Elastic Security app or perform actions for the selected visualization, have been added to several places in the Elastic Security app. Look for the Inspect button (![]() ) or options menu (
) or options menu (![]() ) in the UI.
) in the UI.
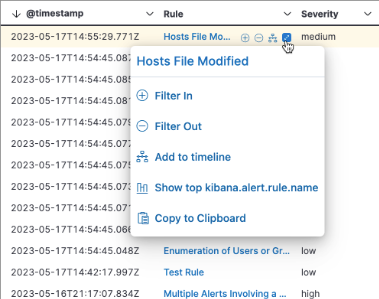
Inline actions are displayed when you hover over a specific data field or value and allow you to customize your view or investigate further. They’ve also been added to more places throughout the Elastic Security app, such as:
- Explore pages (Host, Network, and User pages)
- Entity analytics (Entity Analytics Dashboard, user risk score, and host risk score features)
- Alerts and events table
- Event details flyout
Cloud Security enhancements
editNew Container Workload Protection (beta)
You can now use Elastic Agent to protect your containers by detecting and preventing malicious behavior and malware, and to capture workload telemetry data. This solution uses a new integration, Defend for Containers (D4C), which allows you to create custom alerting and enforcement policies.
New Cloud Native Vulnerability Management (CNVM) (beta)
The Cloud Native Vulnerability Management (CNVM) feature helps you identify known vulnerabilities in your cloud workloads. When it finds vulnerabilities, it enables your remediation efforts by providing metadata such as the CVSS, severity, affected package, and a fix version if available, as well as information about impacted systems.
New "execute" response console command
editA new response console command, execute, allows you to run shell commands and scripts on the host. The complete output is also saved to a downloadable .zip file.
Ensure you have the appropriate privileges to use the response console.
Delete notes in Timeline
editIn Timeline, you can now delete notes for individual events or delete investigation notes for the entire Timeline.
Cases enhancements
editThe following enhancements have been added to Cases:
-
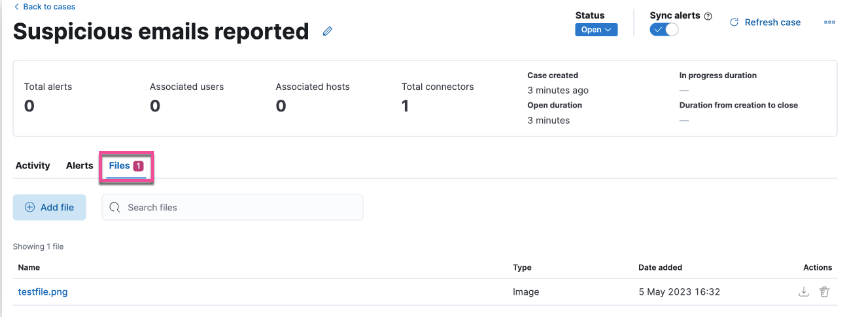
You can now add files to a case.
- You can now add the Cases column to the Alerts table, which is helpful to quickly identify which alerts have been added to a case.
- Case activity and history are paginated and sortable.
-
The privileges for attaching alerts to cases have changed. Now, users need
Readaccess to Security andAllaccess to Cases.