What’s new in 8.3
editWhat’s new in 8.3
editHere are the highlights of what’s new and improved in Elastic Security. For detailed information about this release, check out the Release notes.
Other versions: 8.2 | 8.1 | 8.0 | 7.17 | 7.16 | 7.15 | 7.14 | 7.13 | 7.12 | 7.11 | 7.10 | 7.9
Terminology changes
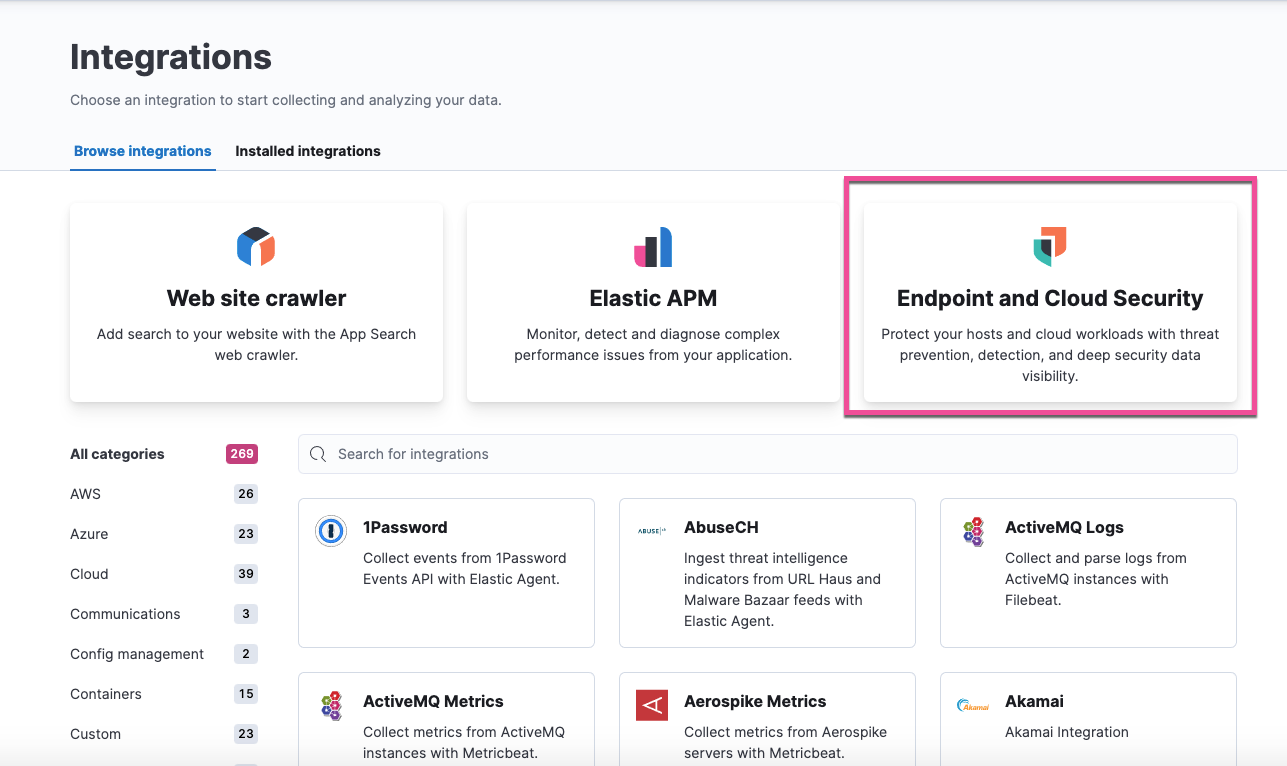
edit"Endpoint Security integration" has been renamed to "Endpoint and Cloud Security integration"
Due to the launch of Elastic Security for Cloud, the Endpoint Security integration, which allows the Elastic Agent to monitor for events on your host, has been renamed to Endpoint and Cloud Security integration. Please note that general industry term references to endpoint security have not changed.
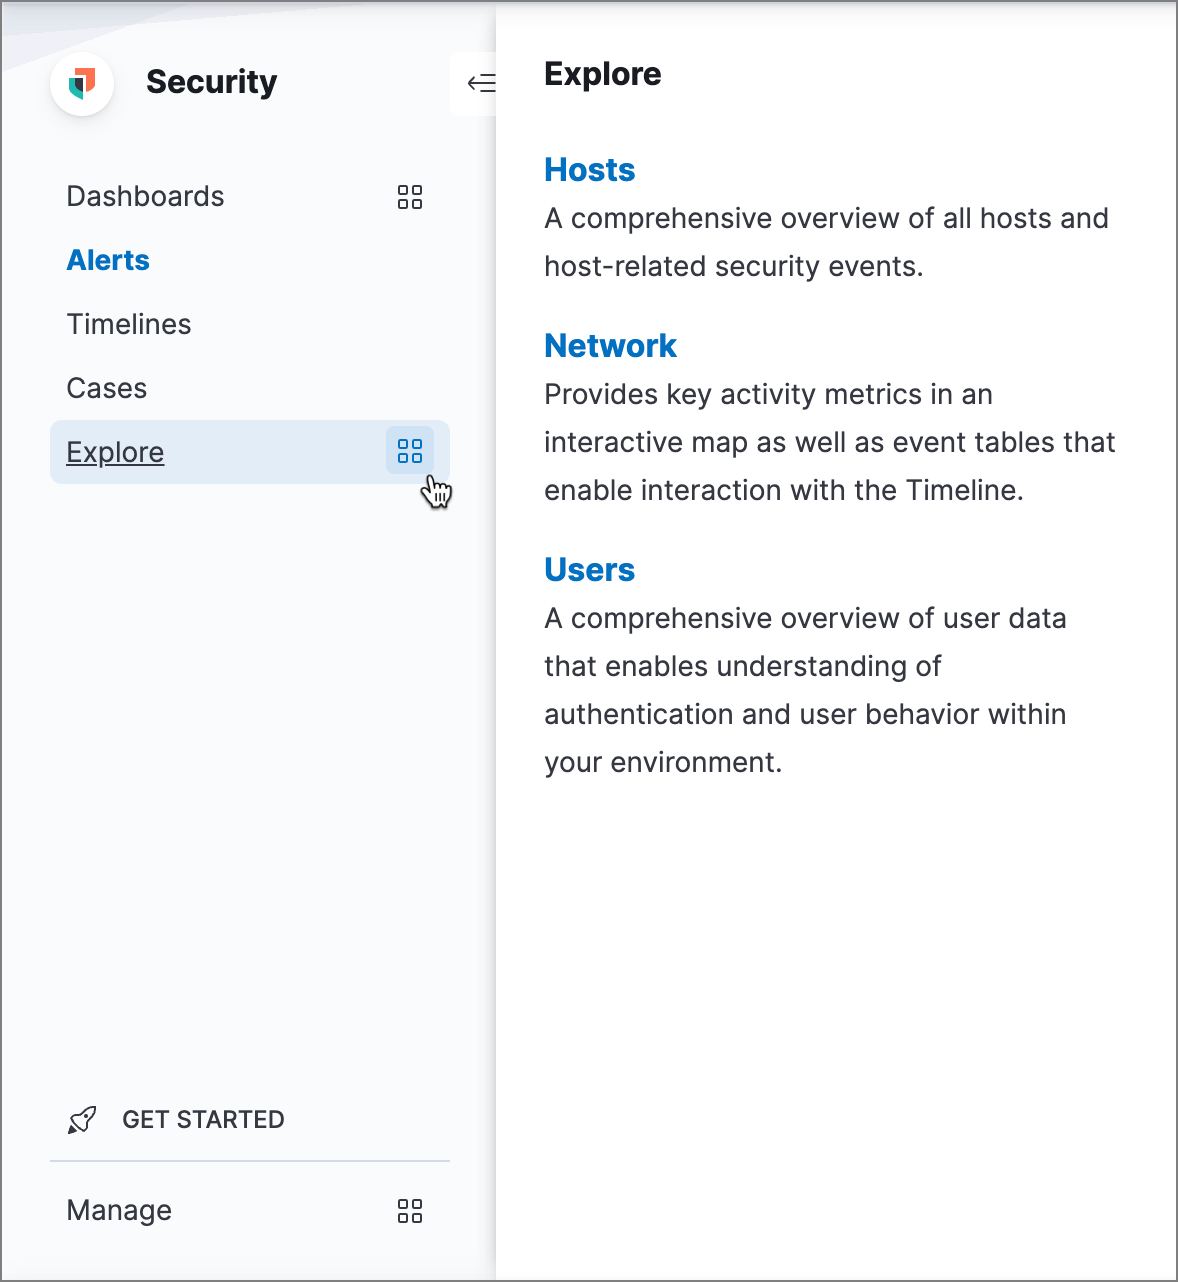
New streamlined navigation
editAn optional, new navigation menu, which can be enabled in the advanced Kibana settings, groups related pages and highlights commonly visited areas for a streamlined experience.
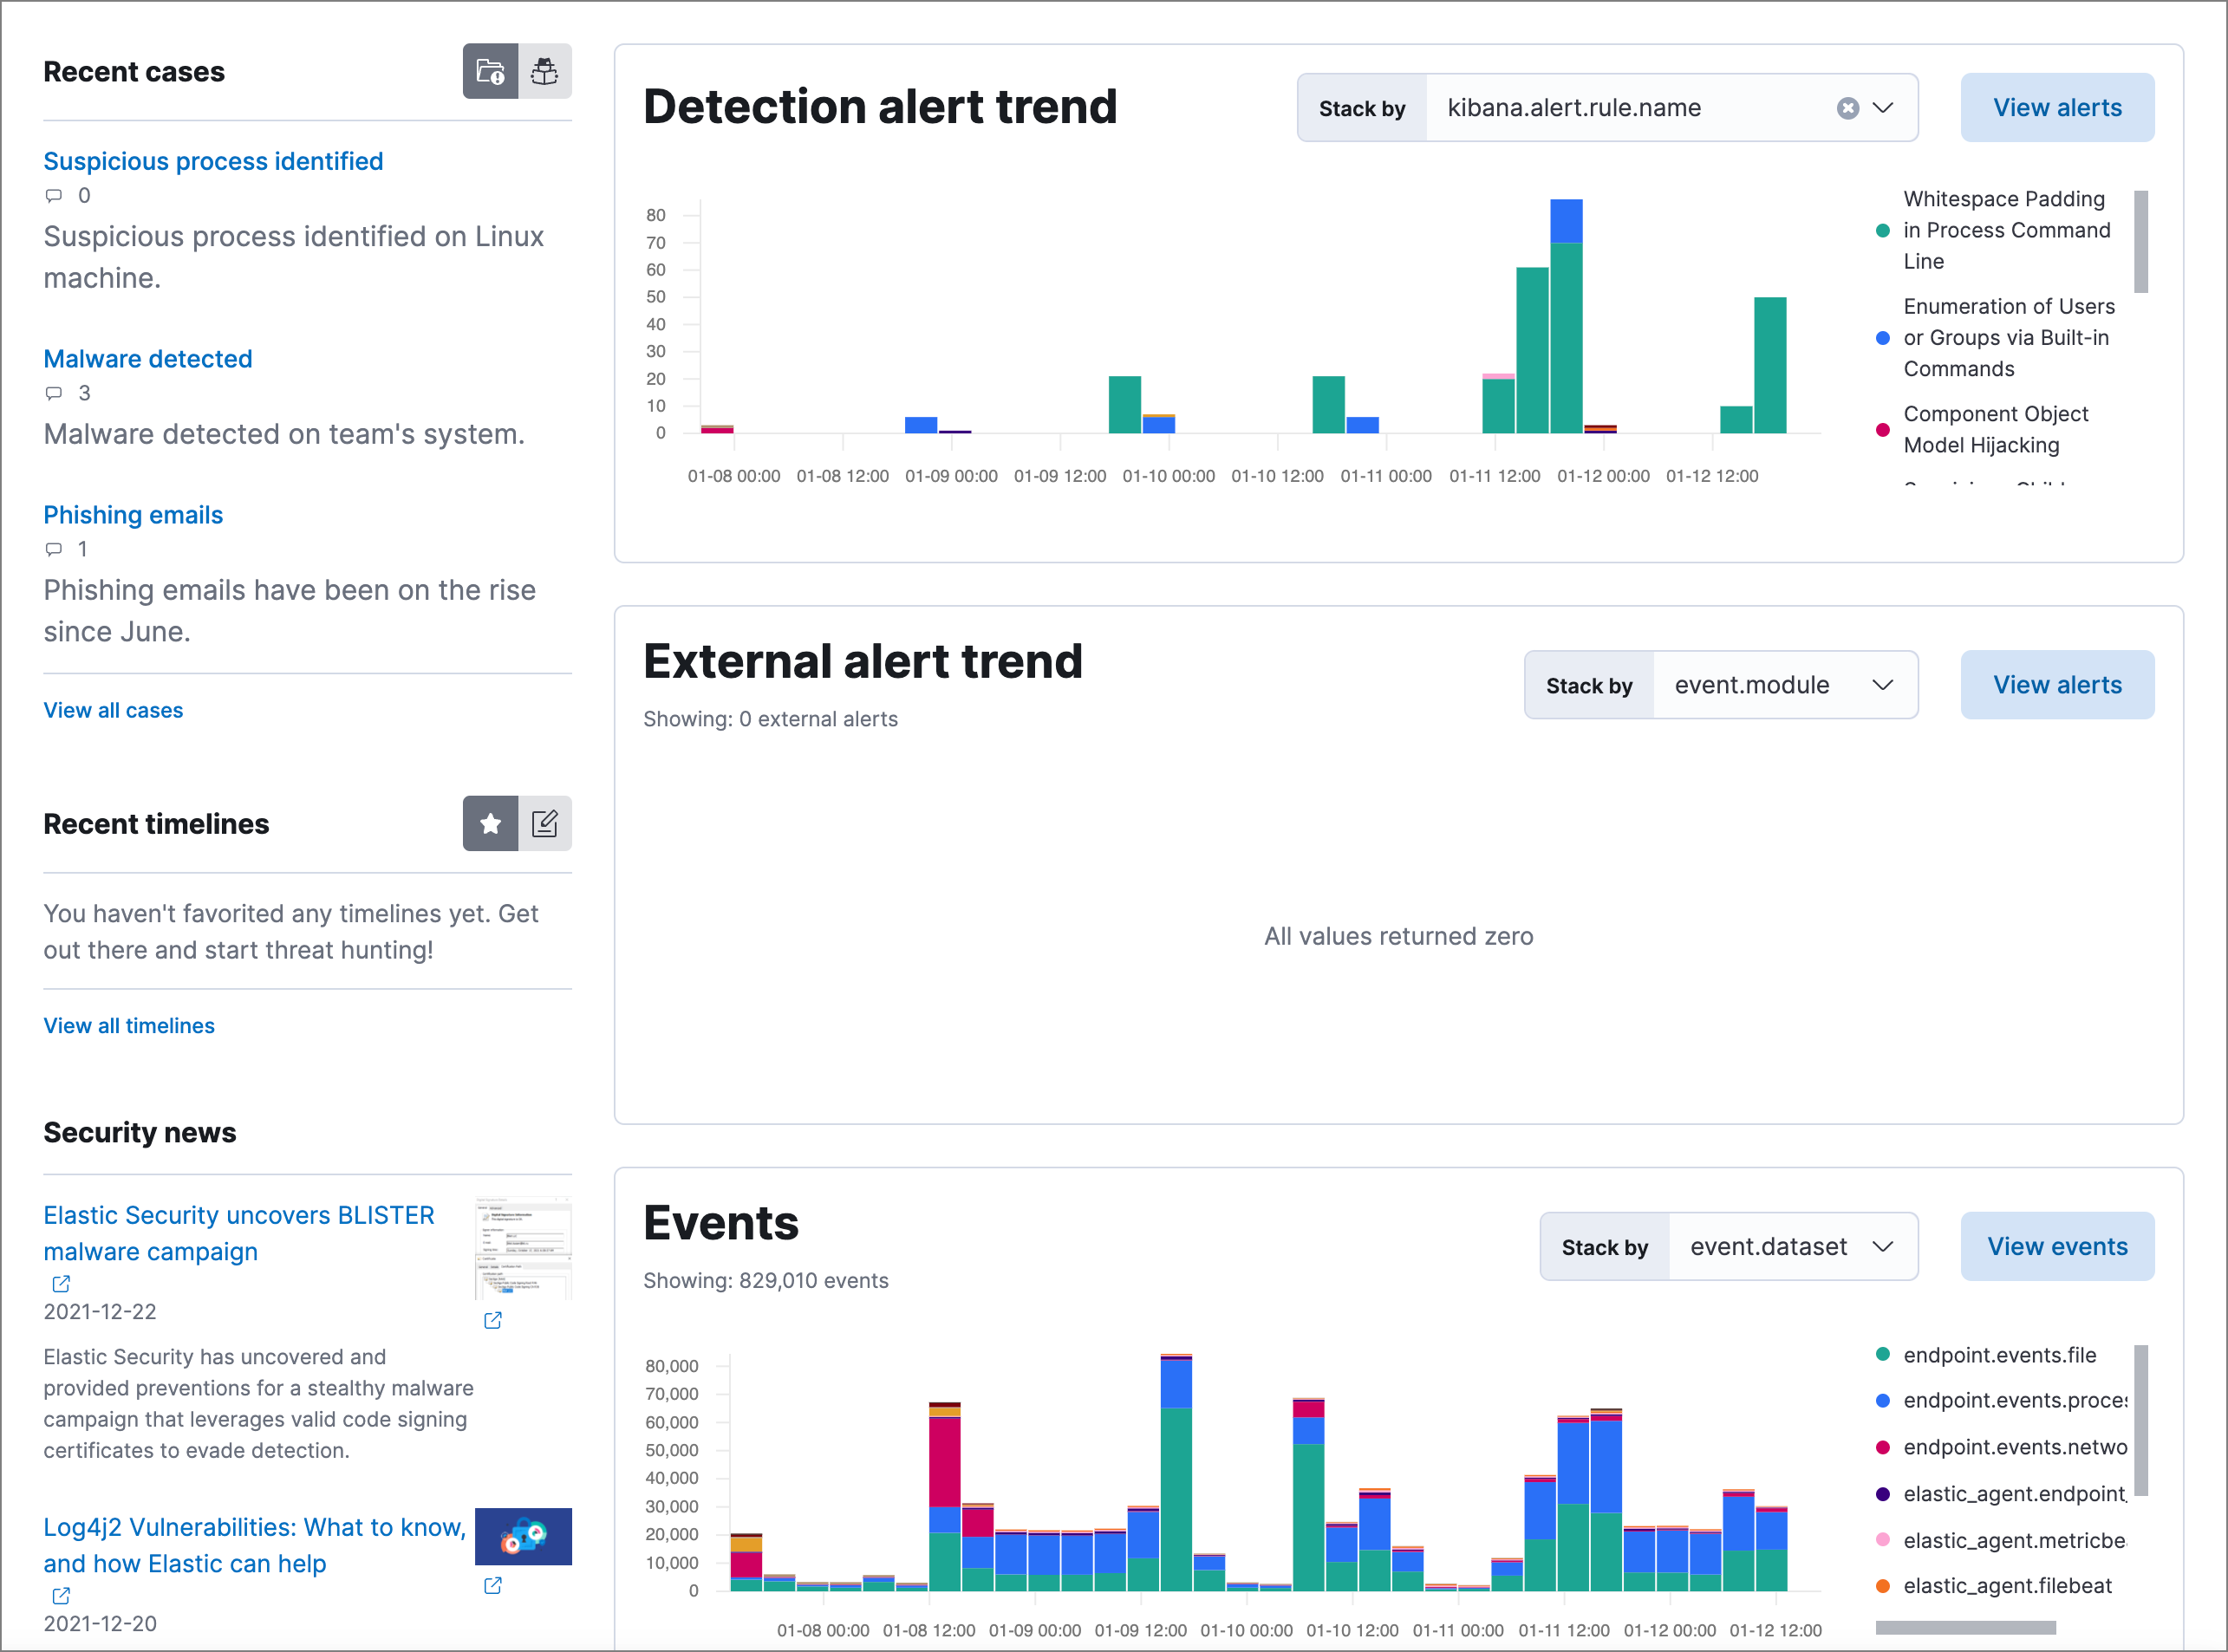
New dashboards summarize critical information
editA new Dashboards section, which includes two new dashboards to help you visualize critical information, has been added to the navigation menu in the Elastic Security app.
The Overview dashboard provides an overview of detections, external alerts, and event trends. Use it to assess overall system health and find anomalies that may require further investigation.
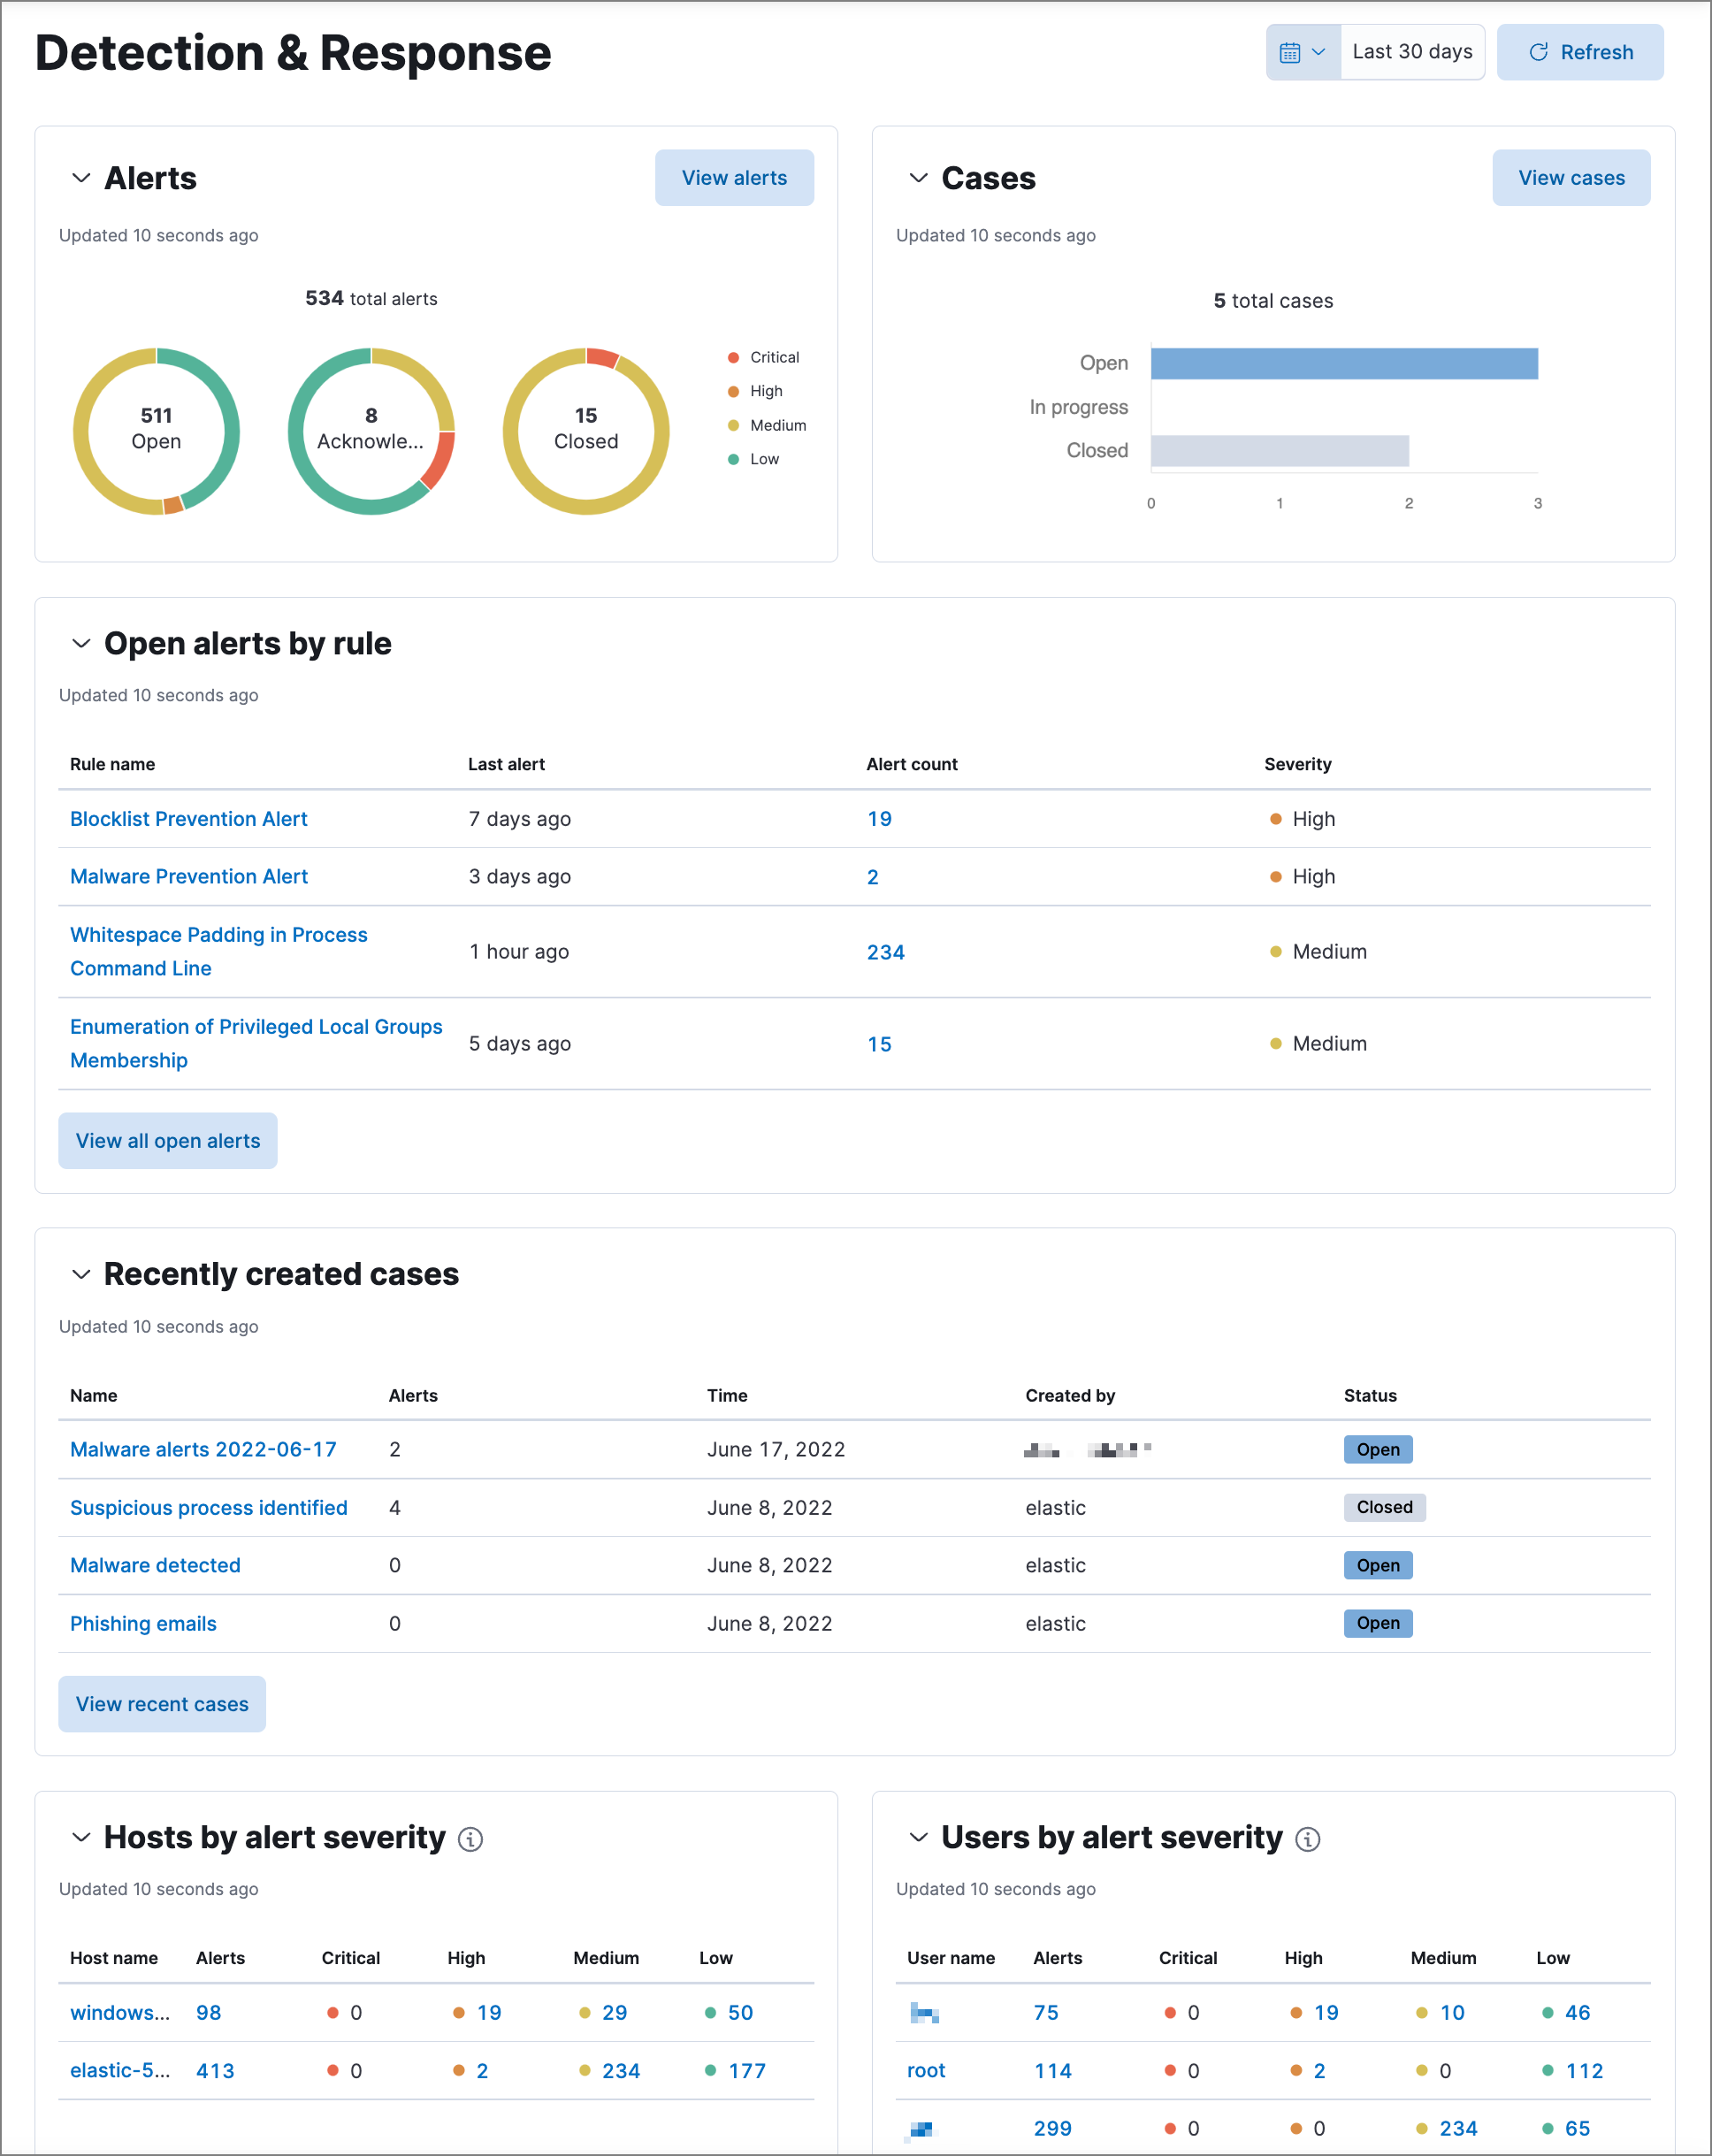
The Detection & Response dashboard provides focused visibility into the daily operations of your security environment. Use it to monitor recent and high priority detection alerts and cases, and identify the top hosts and users associated with the most alerts so you can triage effectively.
New integrations
editSeveral new integrations have been added, including ones for CIS Kubernetes Benchmark, AWS Security Hub, Cloudflare, Jamf, and Palo Alto Networks.
Technical preview features
editCloud Security Posture Management
Cloud Security Posture Management (CSPM) and Kubernetes security posture management (KSPM) help you compare your cloud and Kubernetes infrastructure to security best practices. Refer to our documentation for setup instructions.
User risk score
User risk score assigns a score to highlight risky users within your environment. It uses a transform with a scripted metric aggregation to calculate scores based on detection rule alerts within a 90-day window. The transform runs hourly to update the score as new detection rule alerts are generated. Each user risk score is normalized on a scale of 0 to 100.
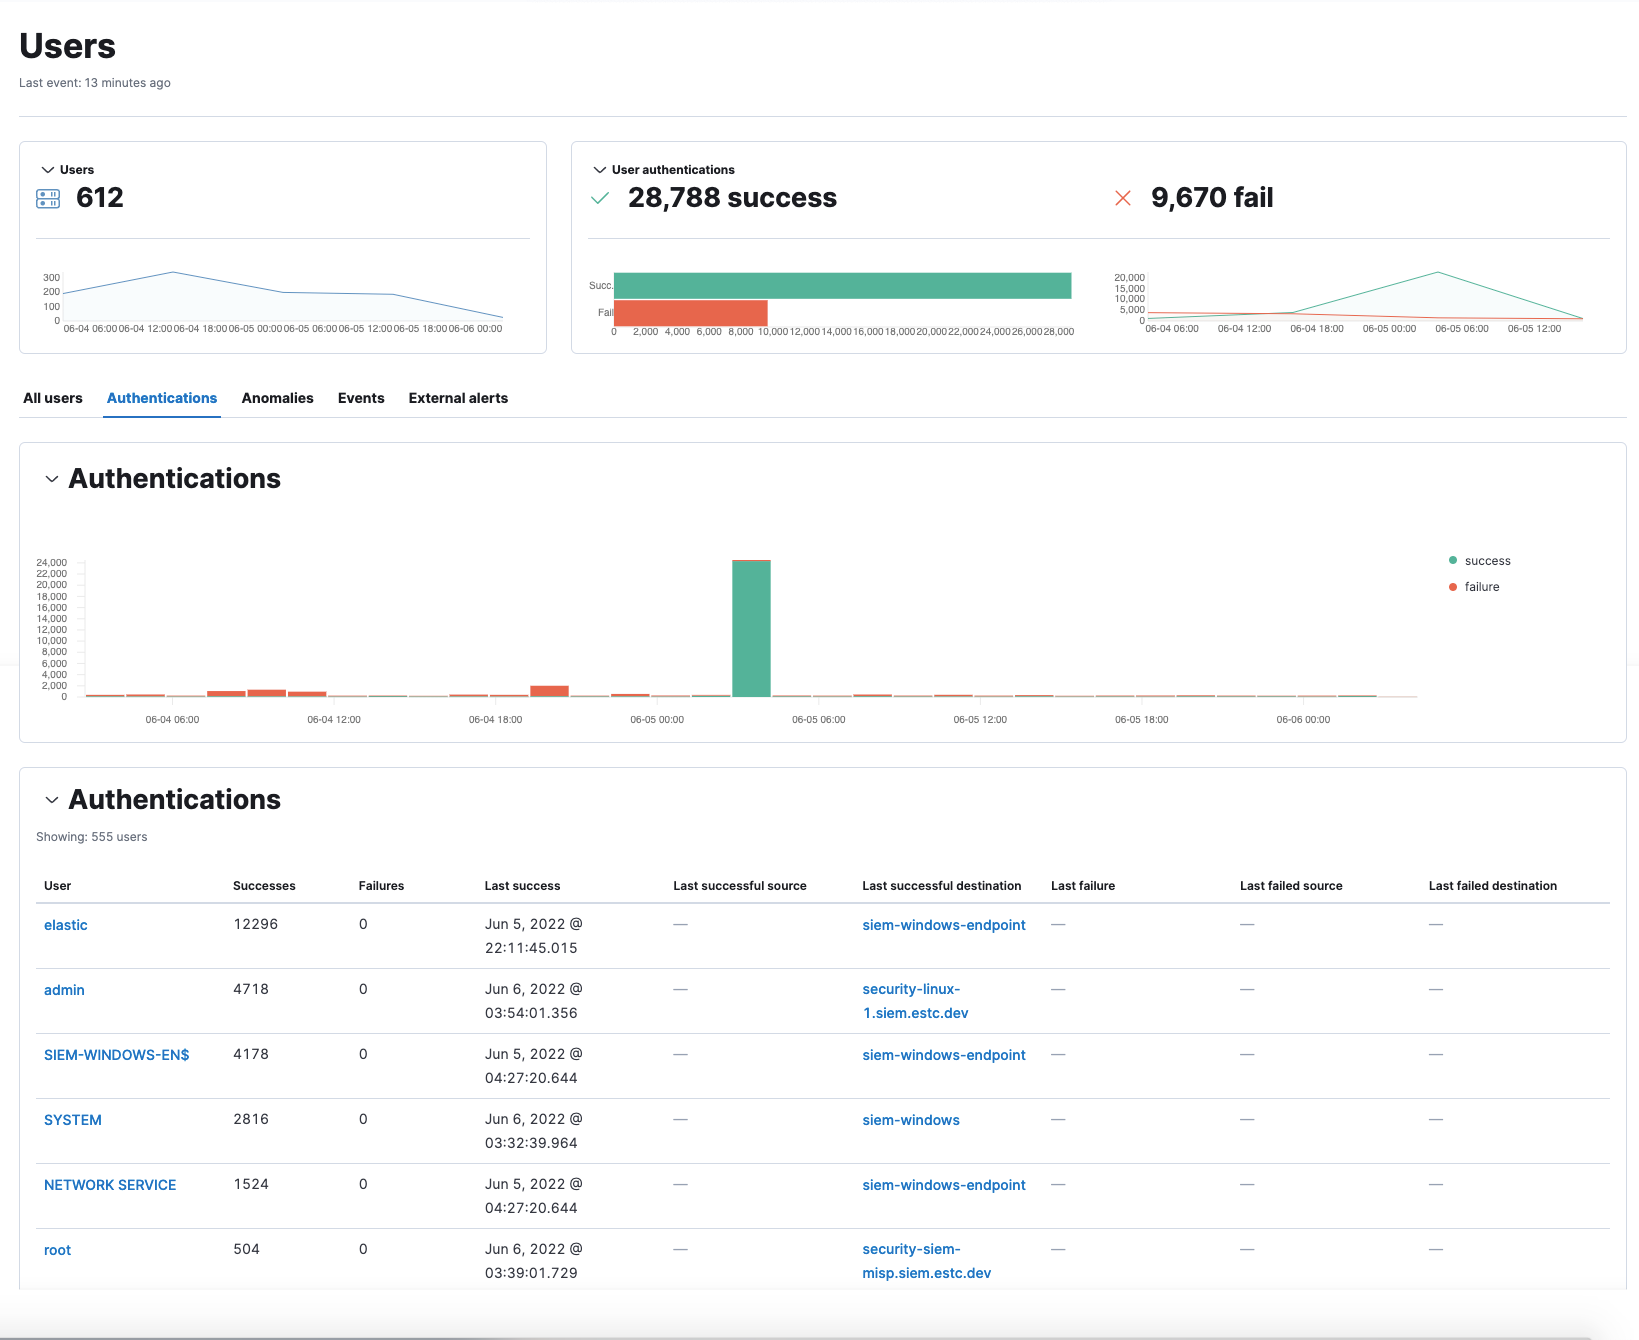
New Authentications tab added to Users page
editAn Authentications tab has been added to the Users page to show successful and failed authentication events per user.
Detection rules enhancements
editNew optional settings for event correlation rules
Event correlation rules now allow you to specify the following EQL fields: Event category, Tiebreaker, and Timestamp fields.
Machine learning rules upgraded to v3 machine learning jobs
Elastic prebuilt rules for some Windows and Linux anomalies have been updated with new v3 machine learning jobs. Refer to our documentation for information about how to upgrade and/or continue to use the old v1/v2 jobs.
New Actions column in rule execution logs table enables filtering
You can create a global search filter based on a specific rule execution by selecting the filter icon in the Actions column of the Rule execution logs tab on the rule details page. Enabling this filter replaces any previously applied filters.
New prebuilt rules
15 new prebuilt rules were added in 8.3.0.
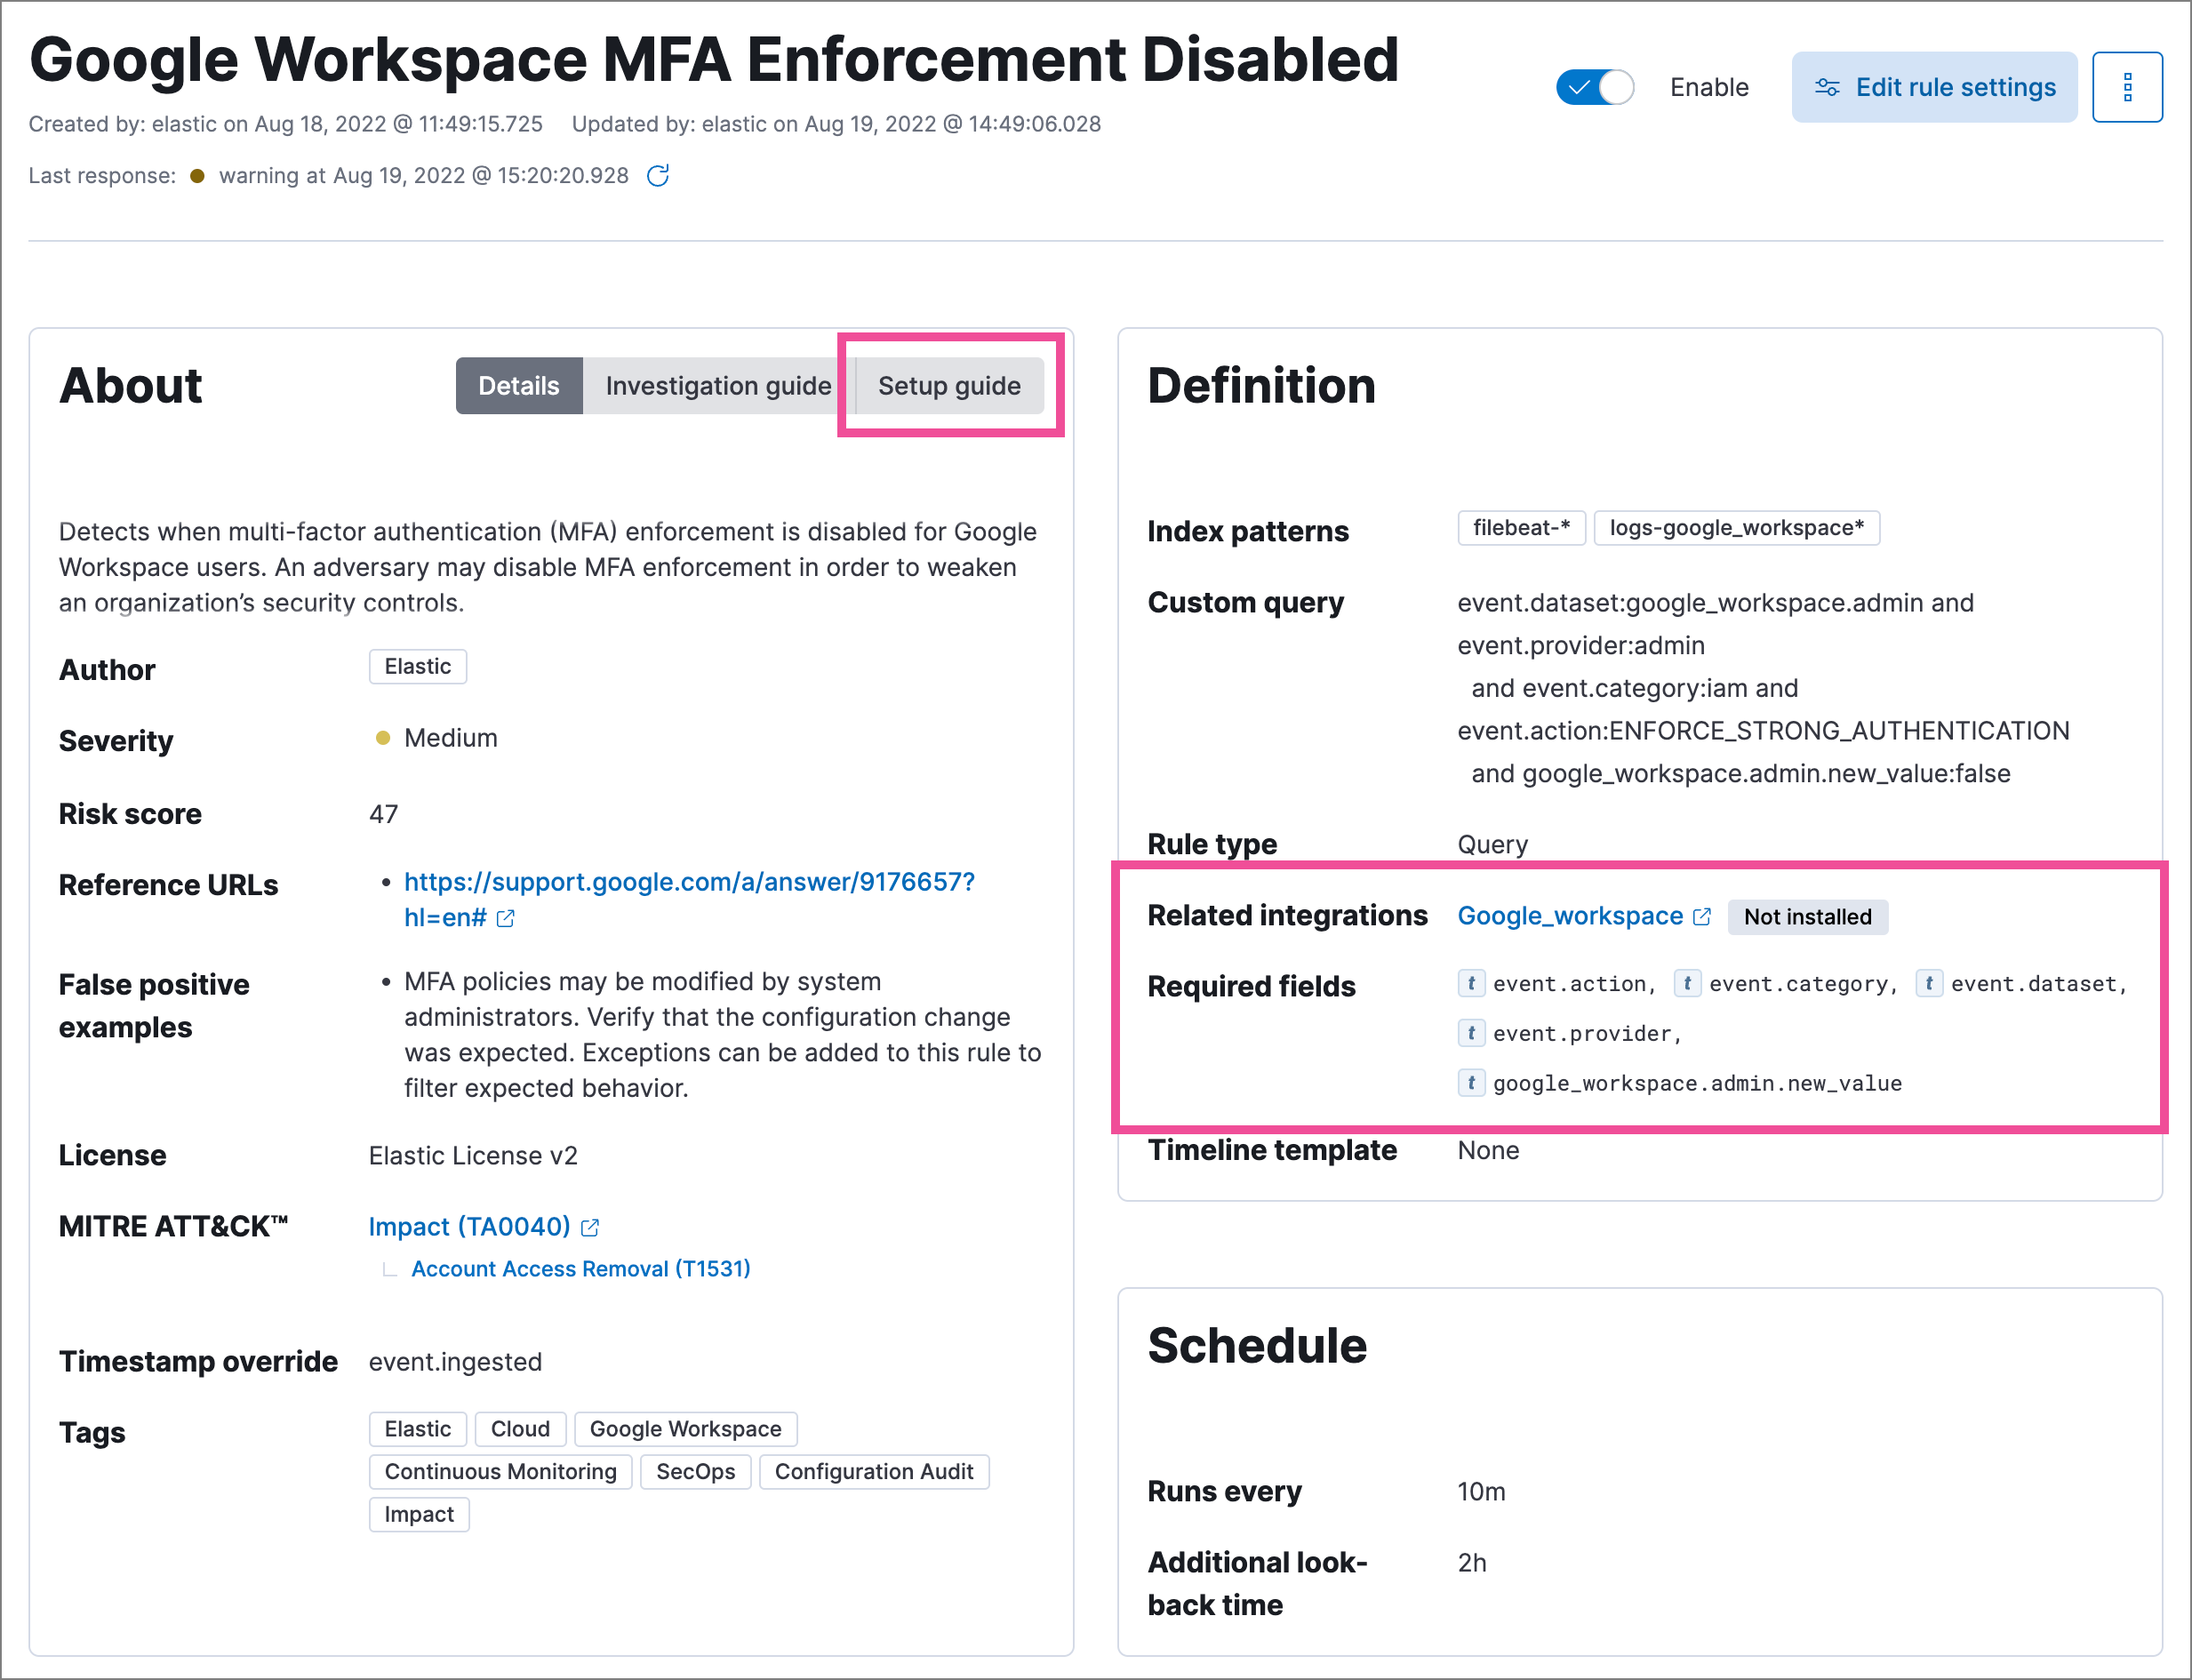
Prerequisites and setup guides for Elastic prebuilt rules
Elastic prebuilt rules now provide additional information to help you identify and meet their prerequisites. You can confirm these requirements in the Related integrations and Required fields sections of a rule’s details page, and consult its Setup guide for additional guidance.
Content for these new sections is delivered in a prebuilt rules update, independent of Elastic Stack release versioning.
OAuth support in ServiceNow connectors
editThe ServiceNow connectors now support open authentication (OAuth). For configuration details, refer to ServiceNow ITSM, ServiceNow SecOps, and ServiceNow ITOM connector.
Cases enhancements
editThe following enhancements have been added to Cases:
-
You can now assign severity levels to cases.
If you do not set a case’s severity, it defaults to Low.
- The Cases table now includes a Severity column and an option to filter the table by severity. It also now includes an "Average time to close" metric.
- You can now delete text comments, including those in Lens visualizations.
- You can now add multiple alerts to new and existing cases through the Bulk actions menu.
- A new Alerts tab has been added to the case details page. This allows you to view all alerts attached to a case.
Alert details enhancements
editThe following enhancements have been added to the alert details flyout:
-
Numerical values in the Alert prevalence column are now active links that send you to Timeline, where you can investigate related alerts.
- Session ID, a unique ID for Linux sessions, has been added to the Highlighted fields section. To collect session data from Linux hosts, you must enable session view data in an integration policy.
Osquery enhancements
editYou can now run Osquery from the More actions menu in the Alerts table.
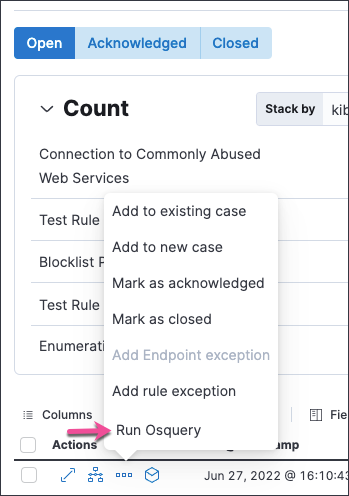
You can also investigate a single or all Osquery query results in Timeline. Refer to Run Osquery for more information.
For information about additional Osquery enhancements, check out the Kibana Osquery highlights.