Create a detection rule
editCreate a detection rule
editRules run periodically and search for source events, matches, sequences, or machine learning job anomaly results that meet their criteria. When a rule’s criteria are met, a detection alert is created.
You can create the following types of rules:
- Custom query: Query-based rule, which searches the defined indices and creates an alert when one or more documents match the rule’s query.
-
Machine learning: Machine learning rule, which creates an alert when a machine learning job discovers an anomaly above the defined threshold (see Anomaly Detection with Machine Learning).
For machine learning rules, the associated machine learning job must be running. If the machine learning job is not running, the rule will:
- Run and create alerts if existing anomaly results with scores above the defined threshold are discovered.
- Issue an error stating the machine learning job was not running when the rule executed.
-
Threshold: Searches the defined indices and creates a detections alert when the number of times the specified field’s value is present and meets the threshold during a single execution. When multiple values meet the threshold, an alert is generated for each value.
For example, if the threshold
fieldissource.ipand itsvalueis10, an alert is generated for every source IP address that appears in at least 10 of the rule’s search results. - Event correlation: Searches the defined indices and creates an alert when results match an Event Query Language (EQL) query.
-
Indicator match: Creates an alert when Elastic Security index field values match field values defined in the specified indicator index patterns. For example, you can create an indicator index for IP addresses and use this index to create an alert whenever an event’s
destination.ipequals a value in the index. Indicator index field mappings should be ECS-compliant. For information on creating Elasticsearch indices and field types, see Index some documents, Create index API, and Field data types. If you have indicators in a standard file format, such as CSV or JSON, you can also use the Machine Learning Data Visualizer to import your indicators into an indicator index. See https://www.elastic.co/guide/en/machine-learning/7.10/ml-gs-visualizer.html and use the Import Data option to import your indicators.
You can also use value lists as the indicator match index. See Use value lists with indicator match rules at the end of this topic for more information.
When modifying rules or managing detection alerts, you can add exceptions that prevent a rule from generating an alert even when its criteria are met. This is useful for reducing noise, such as preventing alerts from trusted processes and internal IP addresses. Rule exceptions and value lists describes how to add exceptions to a rule.
You can add exceptions to custom query, machine learning, event correlation, and indicator match rule types.
If you are creating a custom query, threshold, or event correlation rule, you can preview the rule beforehand to see what kind of results you can expect. See Preview your rule in this topic for more information.
For both prebuilt and custom rules, you can send notifications when alerts are created. Notifications can be sent via Jira, Microsoft Teams, PagerDuty, Slack, and others, and can be configured when you create or edit a rule.
Creating a new rule requires the following steps:
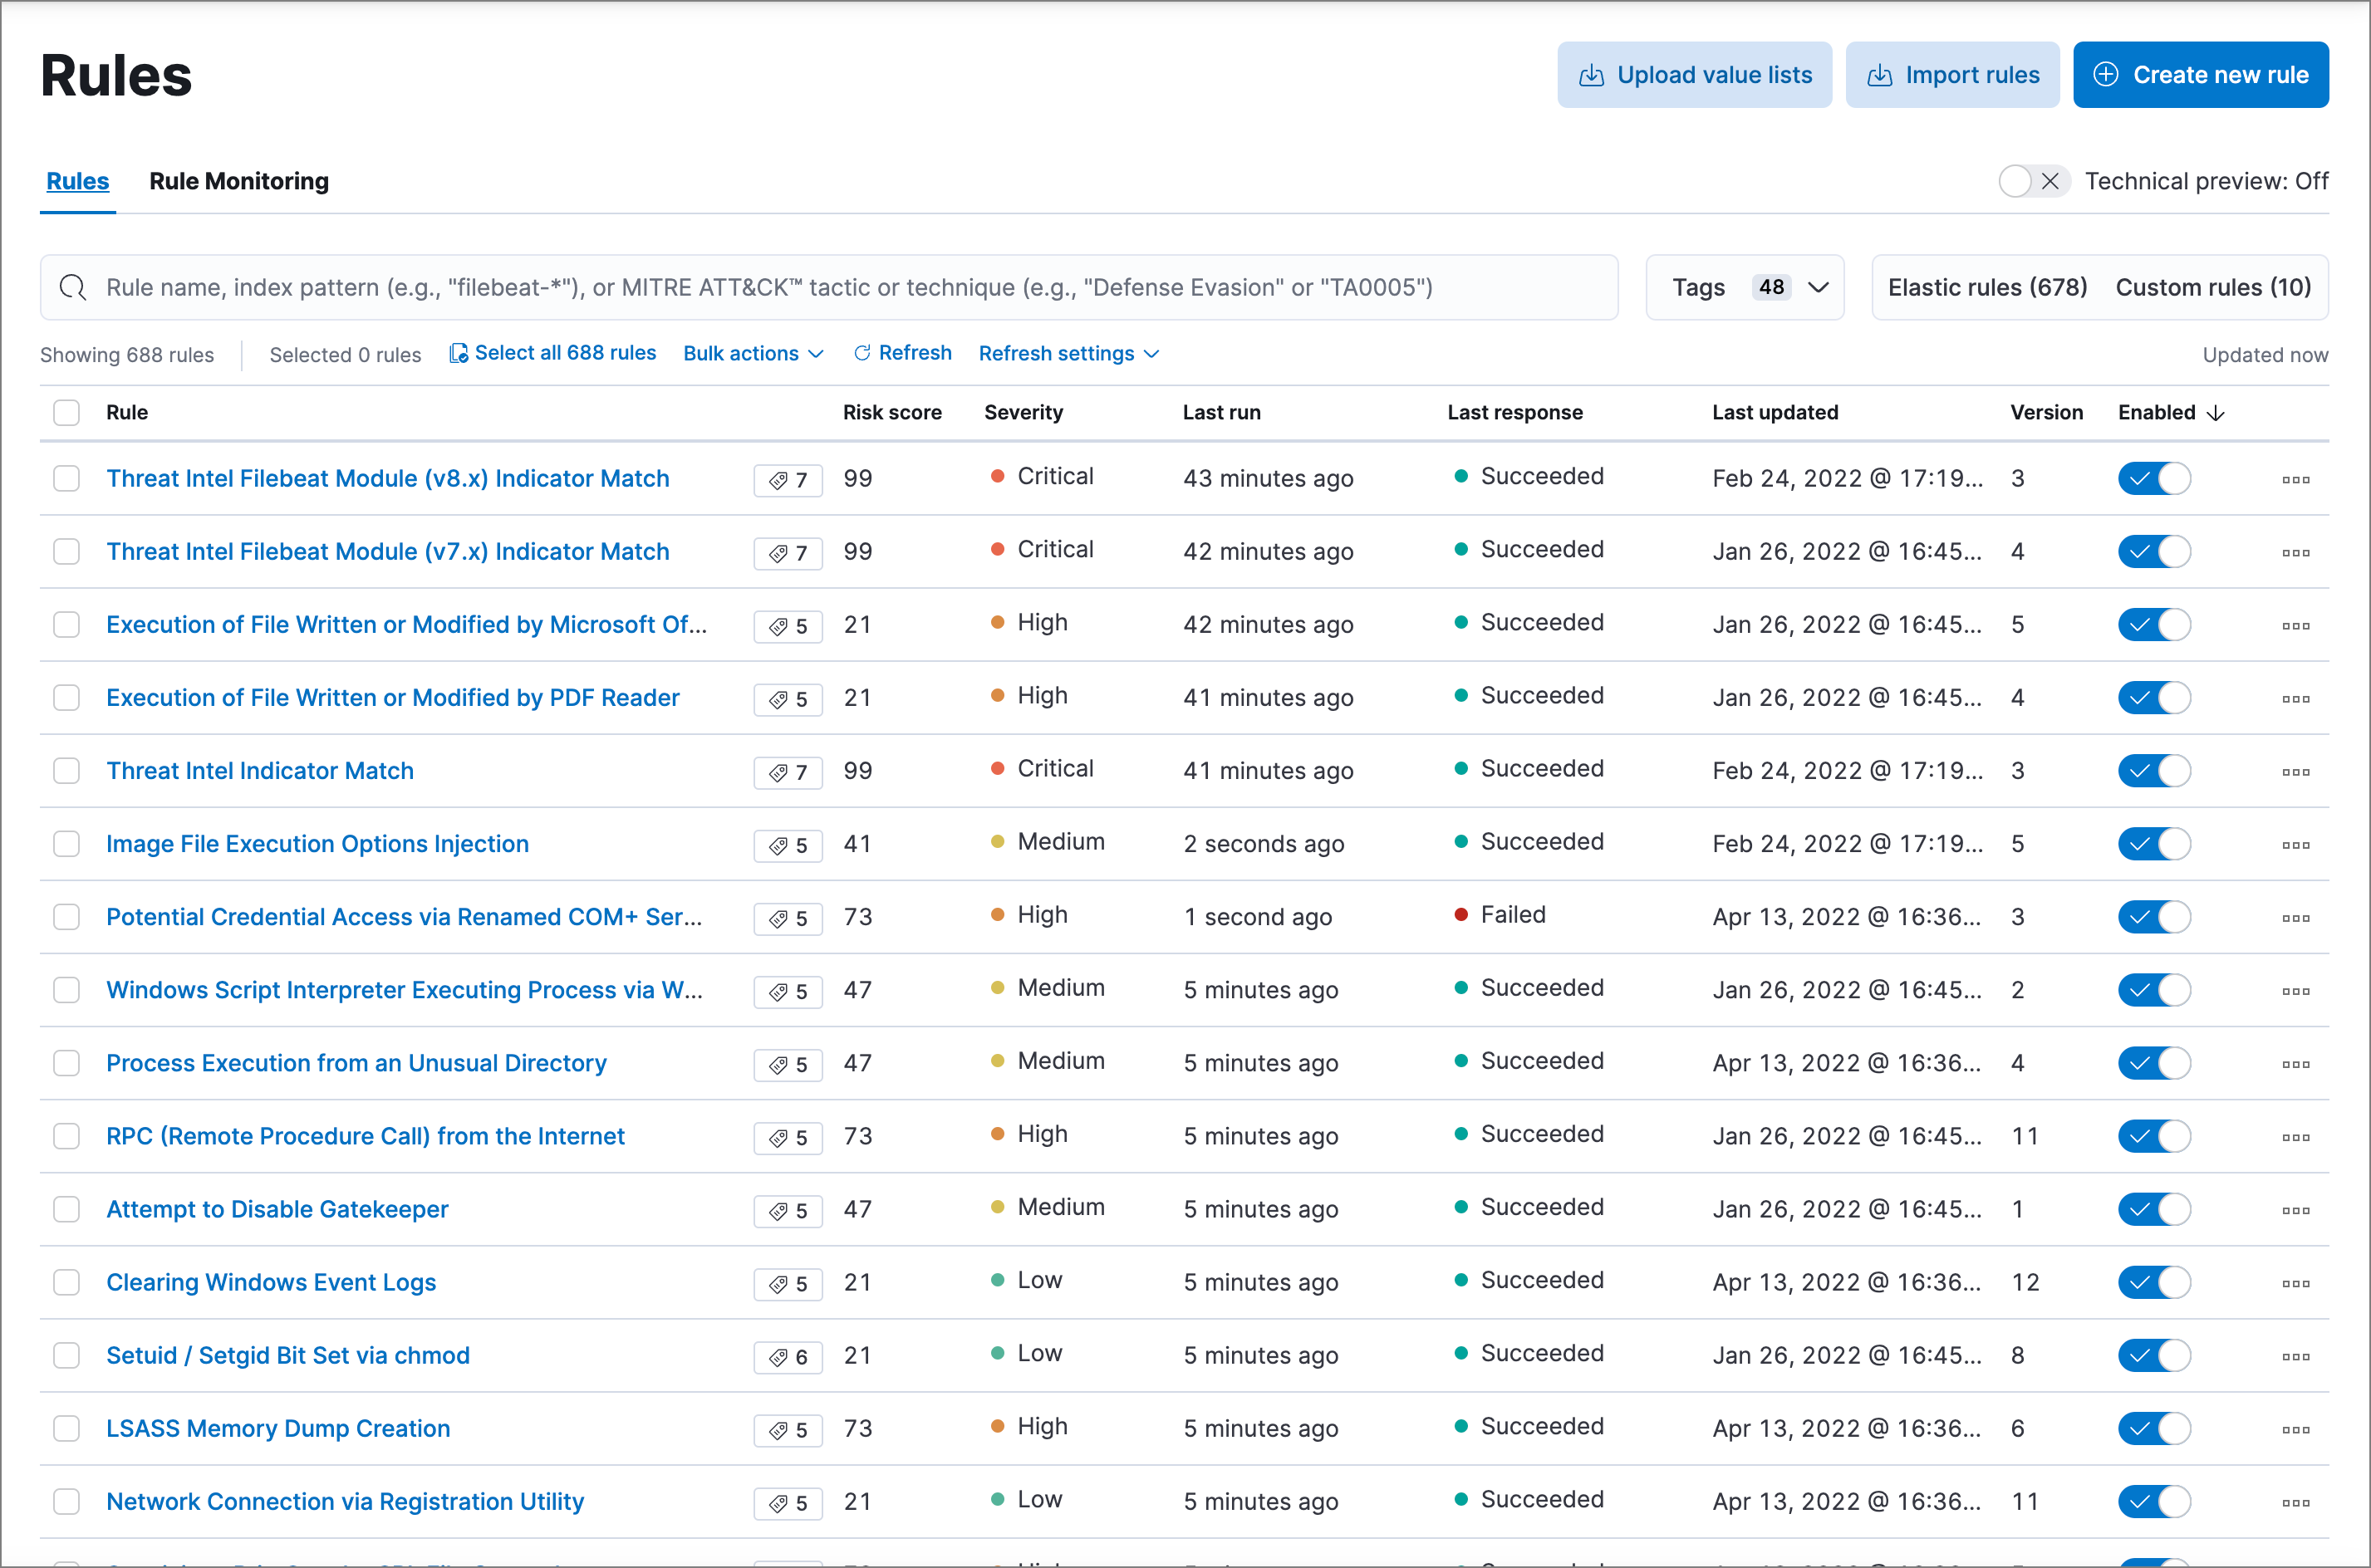
After you activate a rule, you can check if it is running as expected
using the Monitoring tab on the Rules page. If you see
values in the Gap column, you can Troubleshoot missing alerts.
When a rule fails to run, the Elastic Security app tries to rerun it at its next scheduled run time.
Authorization
editRules, including all background detection and the actions they generate, are authorized using an API key associated with the last user to edit the rule. Upon creating or modifying a rule, an API key is generated for that user, capturing a snapshot of their privileges. The API key is then used to run all background tasks associated with the rule including detection checks and executing actions.
If a rule requires certain privileges to run, such as index privileges, keep in mind that if a user without those privileges updates the rule, the rule will no longer function.
Select rule type and scope
edit-
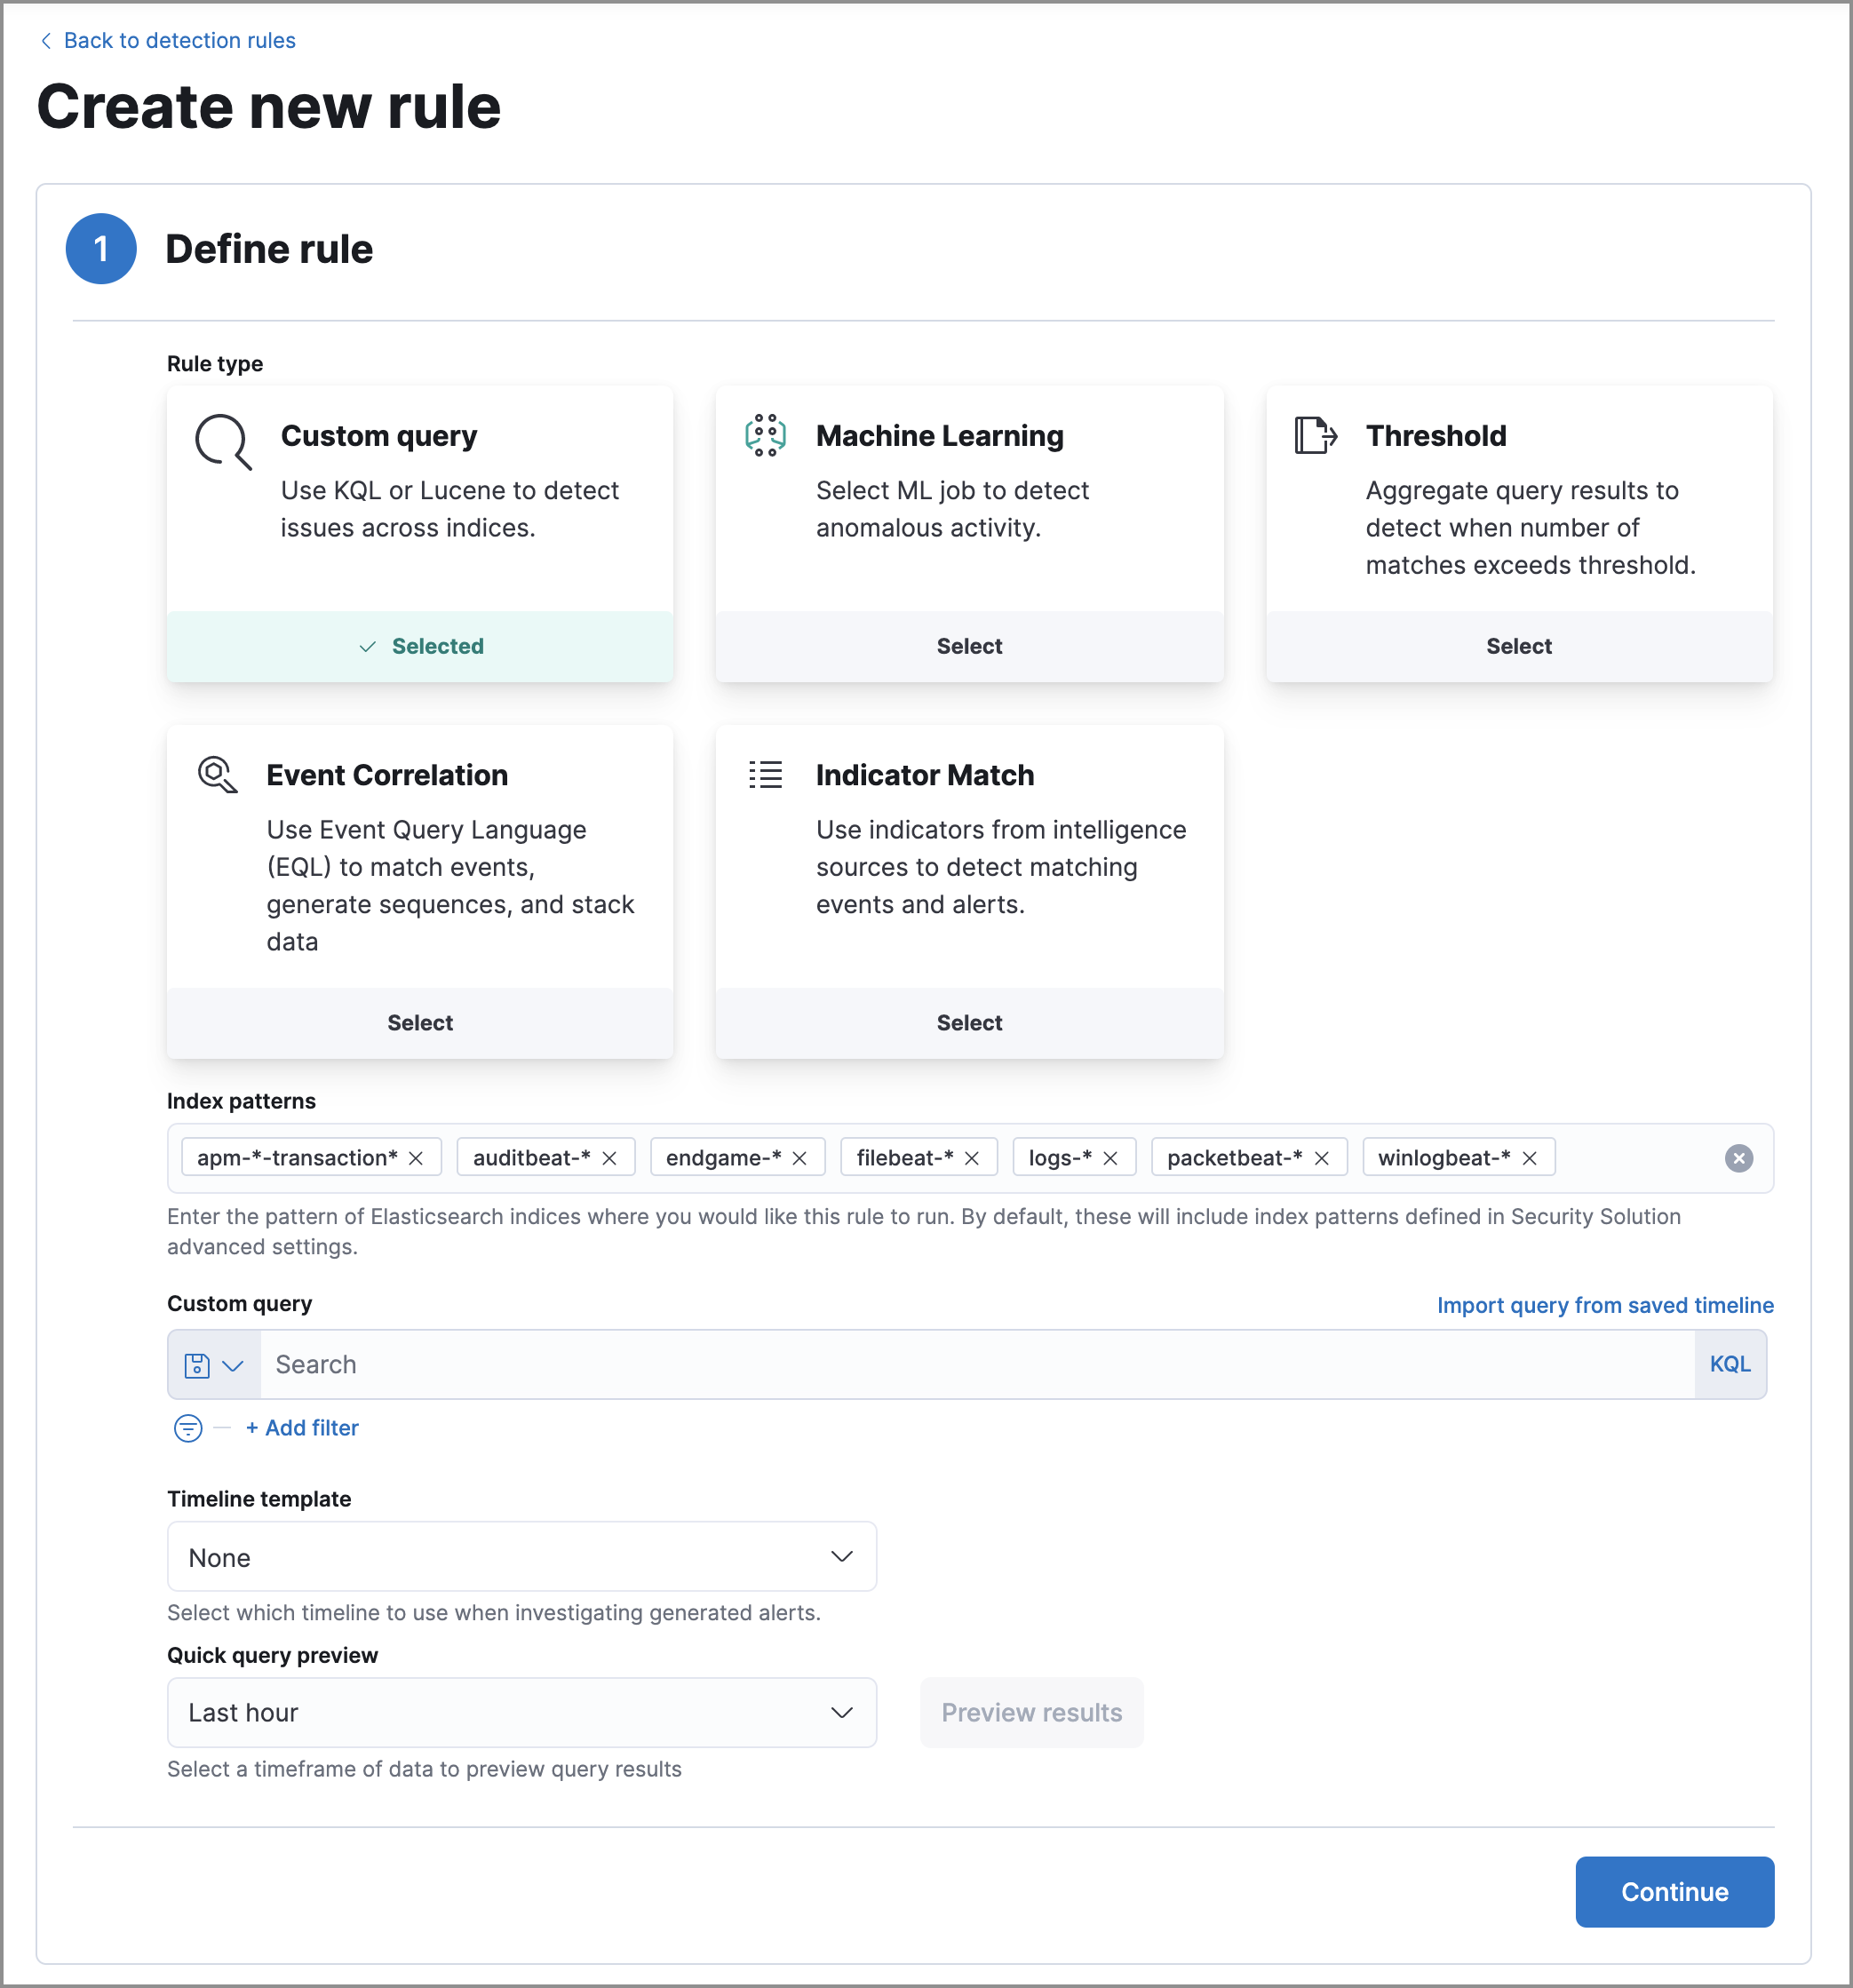
Go to Detect → Rules → Create new rule. The Create new rule page displays.
-
Select the type of rule you want to create, then follow the steps outlined in that section:
Create a machine learning rule
editTo create or edit machine learning rules, you must have the appropriate license or use a
cloud deployment. Additionally, you must have the machine_learning_admin user
role, and the selected machine learning job must be running for the rule to function correctly.
-
To create a rule based on a machine learning anomaly threshold, select Machine Learning, then select:
- The required machine learning job(s).
- The anomaly score threshold above which alerts are created.
-
Make sure that the machine learning jobs required for the rule are running. If a required machine learning job is not running, an alert is displayed.
- Select ML job settings in the upper-right corner of the page, then search for the required machine learning job.
-
Turn on the Run job switch for the required machine learning job.
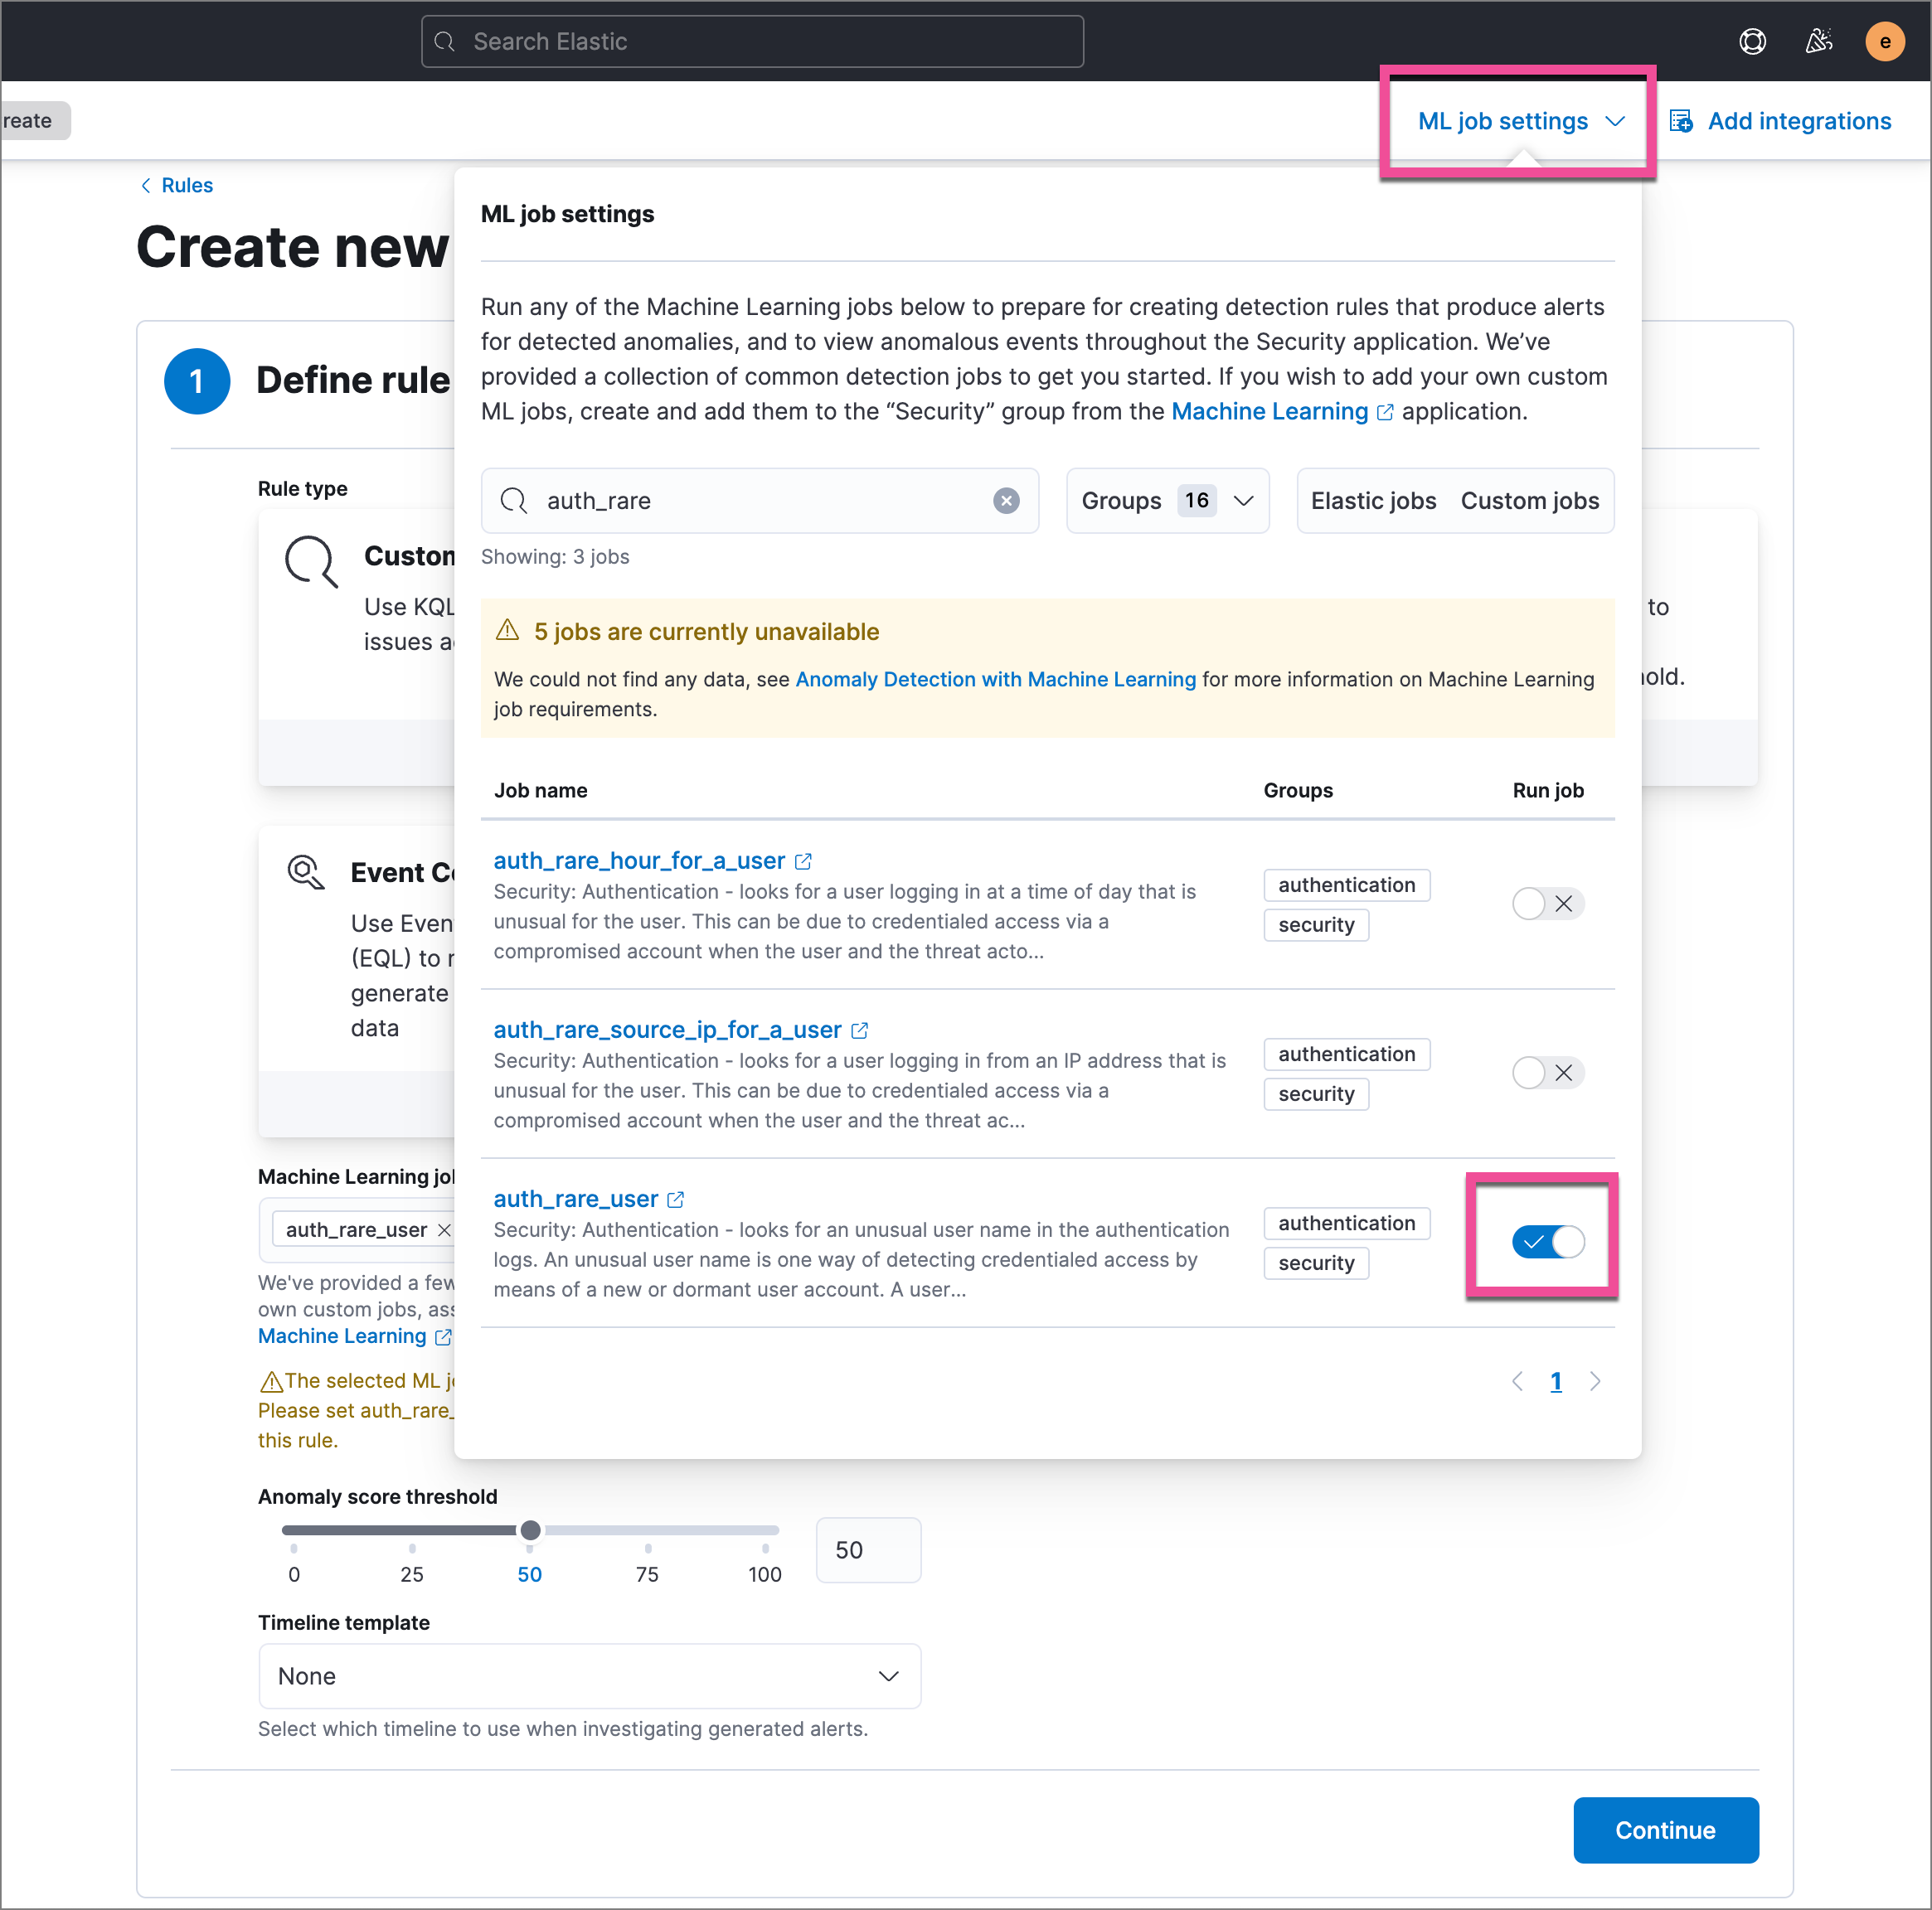
- Click Continue, then proceed with configuring basic rule settings.
Create a custom query rule
edit-
To create a rule based on a KQL or Lucene query, select Custom query, then:
- Define which Elasticsearch indices the rule searches for alerts.
-
Use the filter and query fields to create the criteria used for detecting alerts.
You can use Kibana saved queries (save icon) and queries from saved Timelines (
Import query from saved Timeline) as rule conditions.For example, the following rule detects when the
vssadmin delete shadowsWindows command is executed:-
Index patterns:
winlogbeat-*Winlogbeat ships Windows event logs to Elastic Security.
-
Custom query:
event.action:"Process Create (rule: ProcessCreate)" and process.name:"vssadmin.exe" and process.args:("delete" and "shadows")Searches the
winlogbeat-*indices forvssadmin.exeexecutions with thedeleteandshadowarguments, which are used to delete a volume’s shadow copies.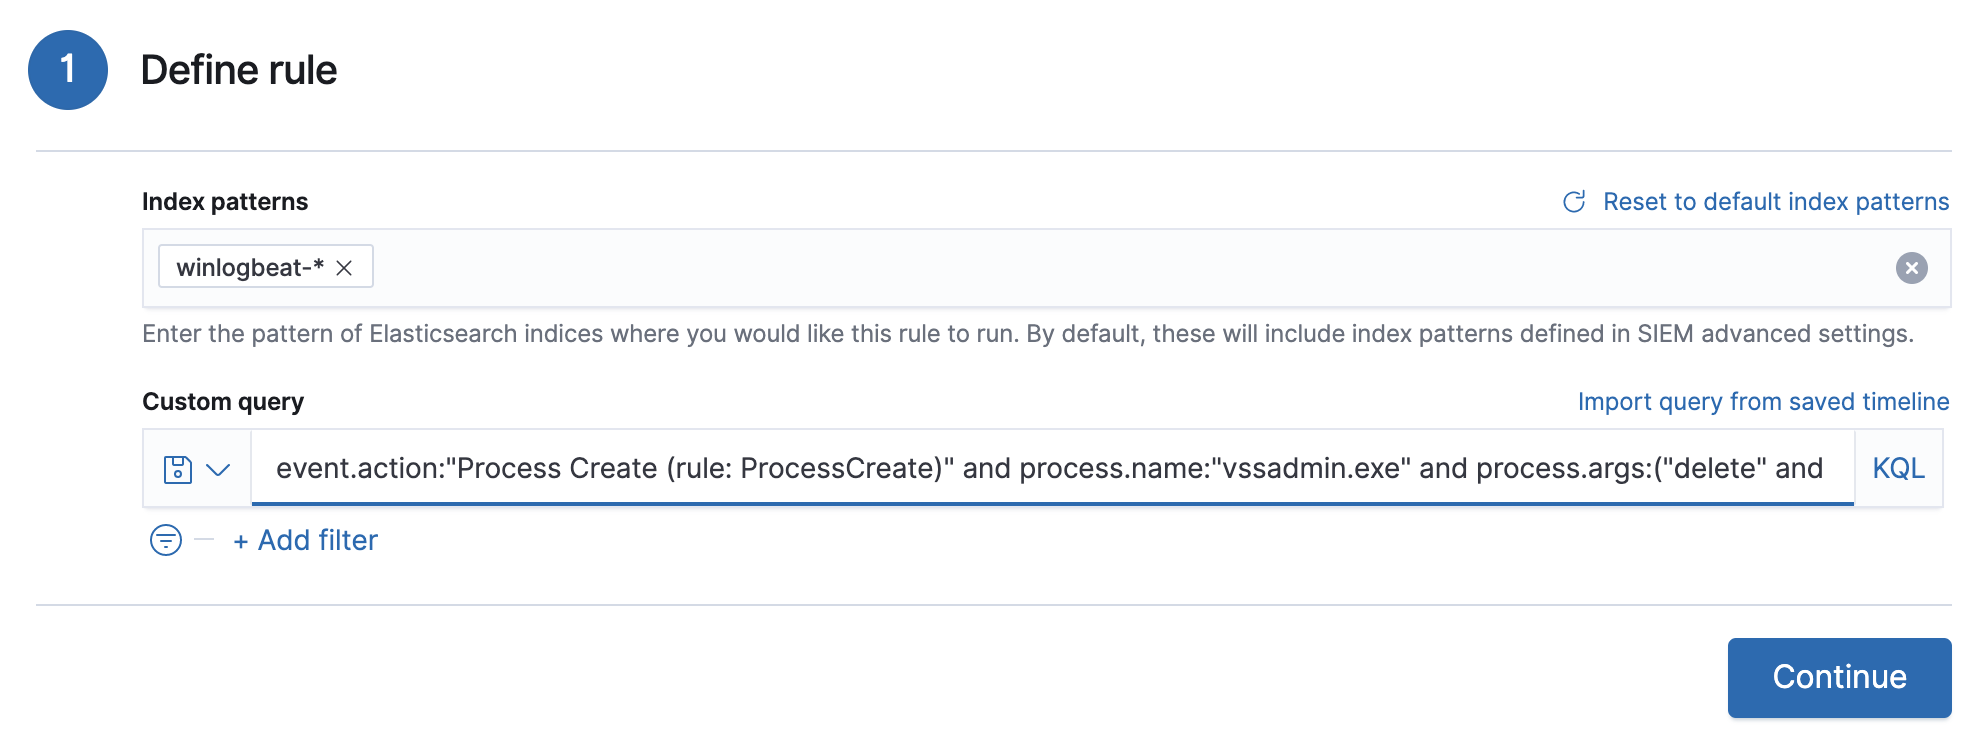
This example is based on the Volume Shadow Copy Deleted or Resized via VssAdmin prebuilt rule.
-
- Continue with previewing the rule (optional) or click Continue to configure basic rule settings.
Create a threshold rule
edit-
To create a rule based on a source event field threshold, select Threshold, then:
- Define which Elasticsearch indices the rule analyzes for alerts.
- Use the filter and query fields to create the criteria used for detecting alerts.
-
Use the
Group byandThresholdfields to determine which source event field is used as a threshold and the threshold’s value. -
Use the
Countfield to limit alerts by cardinality of a certain field.For example, if
Group byissource.ip,destination.ipand itsThresholdis10, an alert is generated for every pair of source and destination IP addresses that appear in at least 10 of the rule’s search results.You can also leave the
Group byfield undefined. The rule then creates an alert when the number of search results is equal to or greater than the threshold value. If you setCountto limit the results byprocess.name>= 2, an alert will only be generated for source/destination IP pairs that appear with at least 2 unique process names across all events.Alerts created by threshold rules are synthetic alerts that do not resemble the source documents. The alert itself only contains data about the fields that were aggregated over (the
Group byfields). Other fields are omitted, because they can vary across all source documents that were counted toward the threshold. Additionally, you can reference the actual count of documents that exceeded the threshold from thekibana.alert.threshold_result.countfield.
- Continue with previewing the rule (optional) or click Continue to configure basic rule settings.
Create an event correlation rule
edit-
To create an event correlation rule using EQL, select Event Correlation, then:
-
Define which Elasticsearch indices the rule searches for alerts.
Event correlation rules have a limitation that prevents them from querying multiple indices from different clusters (local and remote). To enable this, a user with the
superuserrole must modify the EQL rules that are configured to use cross-cluster search. This updates the rule’s API key to usesuperuserprivileges and allows the rule to use cross-cluster search. -
Add an EQL statement used to detect alerts.
For example, the following rule detects when
msxsl.exemakes an outbound network connection:-
Index patterns:
winlogbeat-*Winlogbeat ships Windows events to Elastic Security.
-
EQL query:
sequence by process.entity_id
  [process
    where event.type in ("start", "process_started")
    and process.name == "msxsl.exe"]
  [network
    where event.type == "connection"
    and process.name == "msxsl.exe"
    and network.direction == "outgoing"]
Searches the
winlogbeat-*indices for sequences of amsxsl.exeprocess start event followed by an outbound network connection event that was started by themsxsl.exeprocess.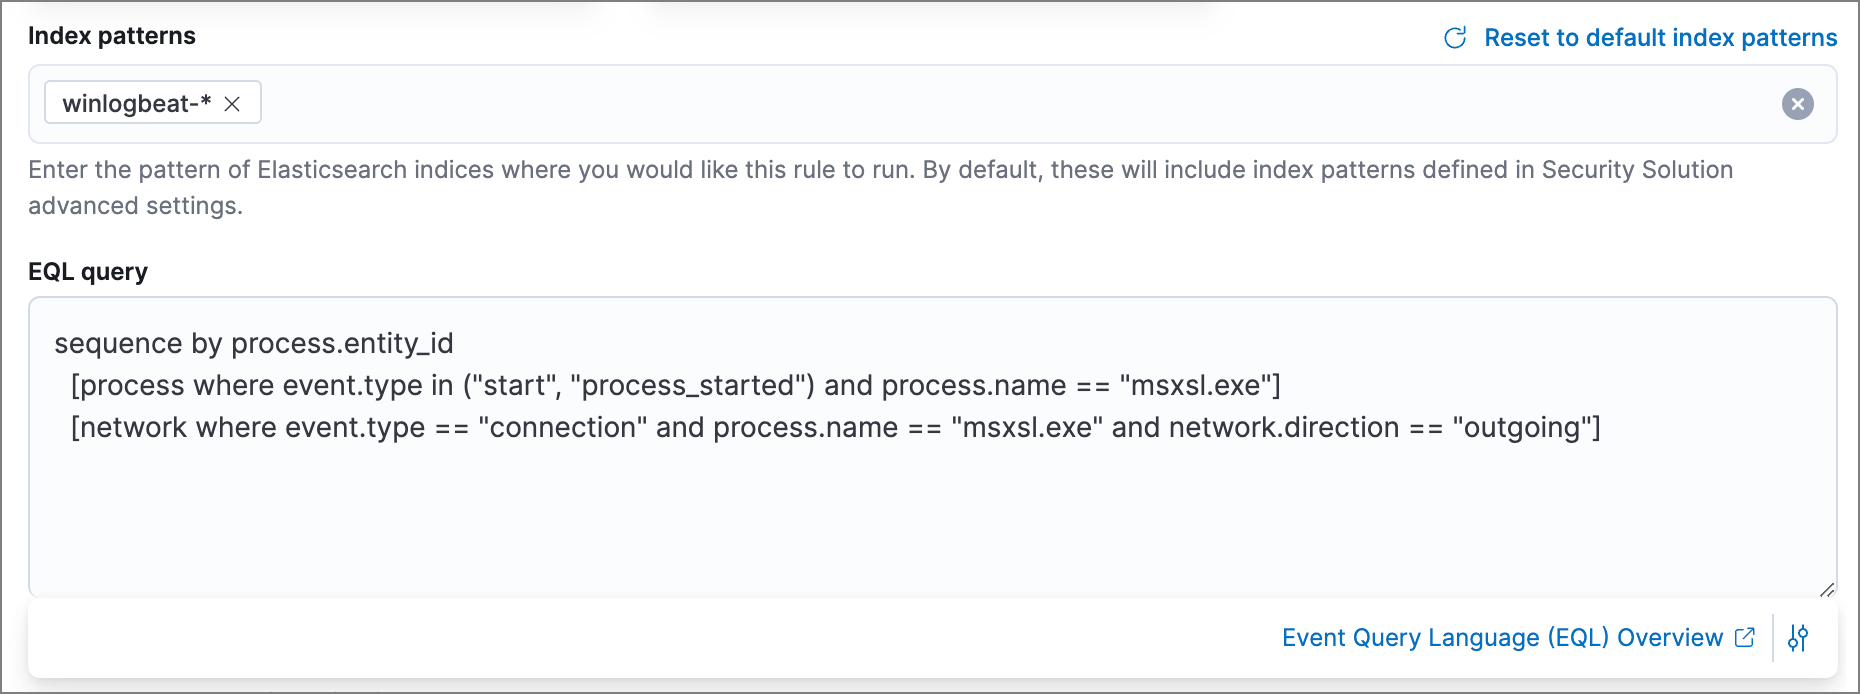
For sequence events, the Elastic Security app generates a single alert when all events listed in the sequence are detected. To see the matched sequence events in more detail, you can view the alert in the Timeline, and, if all events came from the same process, open the alert in Analyze Event view.
-
-
-
(Optional) Click the EQL settings icon (
 ) to configure additional fields used by EQL search:
-
Event category field: Contains the event classification, such as
process,file, ornetwork. This field is typically mapped as a field type in the keyword family. Defaults to theevent.categoryECS field. - Tiebreaker field: Sets a secondary field for sorting events (in ascending, lexicographic order) if they have the same timestamp.
-
Timestamp field: Contains the event timestamp used for sorting a sequence of events. This is different from the Timestamp override advanced setting, which is used for querying events within a range. Defaults to the
@timestampECS field.
-
Event category field: Contains the event classification, such as
- Continue with previewing the rule (optional) or click Continue to configure basic rule settings.
Create an indicator match rule
editElastic Security provides limited support for indicator match rules. See Limited support for indicator match rules for more information.
-
To create an indicator match rule that searches for events whose specified field value matches the specified indicator field value in the indicator index patterns, select Indicator Match, then fill in the following fields:
- Index patterns: The Elastic Security event indices on which the rule runs.
-
Custom query: The query and filters used to retrieve the required results from the Elastic Security event indices. For example, if you want to match documents that only contain a
destination.ipaddress field, adddestination.ip : *.If you want the rule to check every field in the indices, use this wildcard expression:
*:*. -
Indicator index patterns: The indicator index patterns containing field values for which you want to generate alerts. This field is automatically populated with indices specified in the
securitySolution:defaultThreatIndexadvanced setting. For more information, see Update default Elastic Security threat intelligence indices.Data in indicator indices must be ECS compatible, and so it must contain a
@timestampfield. -
Indicator index query: The query and filters used to filter the fields from
the indicator index patterns. The default query
@timestamp > "now-30d/d"searches specified indicator indices for indicators ingested during the past 30 days and rounds the start time down to the nearest day (resolves to UTC00:00:00). -
Indicator mapping: Compares the values of the specified event and indicator fields, and generates an alert if the values are identical.
Only single-value fields are supported.
To define which field values are compared from the indices add the following:
- Field: The field used for comparing values in the Elastic Security event indices.
- Indicator index field: The field used for comparing values in the indicator indices.
-
You can add
ANDandORclauses to define when alerts are generated.For example, to create a rule that generates alerts when
host.nameanddestination.ipfield values in thelogs-*orpacketbeat-*Elastic Security indices are identical to the corresponding field values in themock-threat-listindicator index, enter the rule parameters seen in the following image: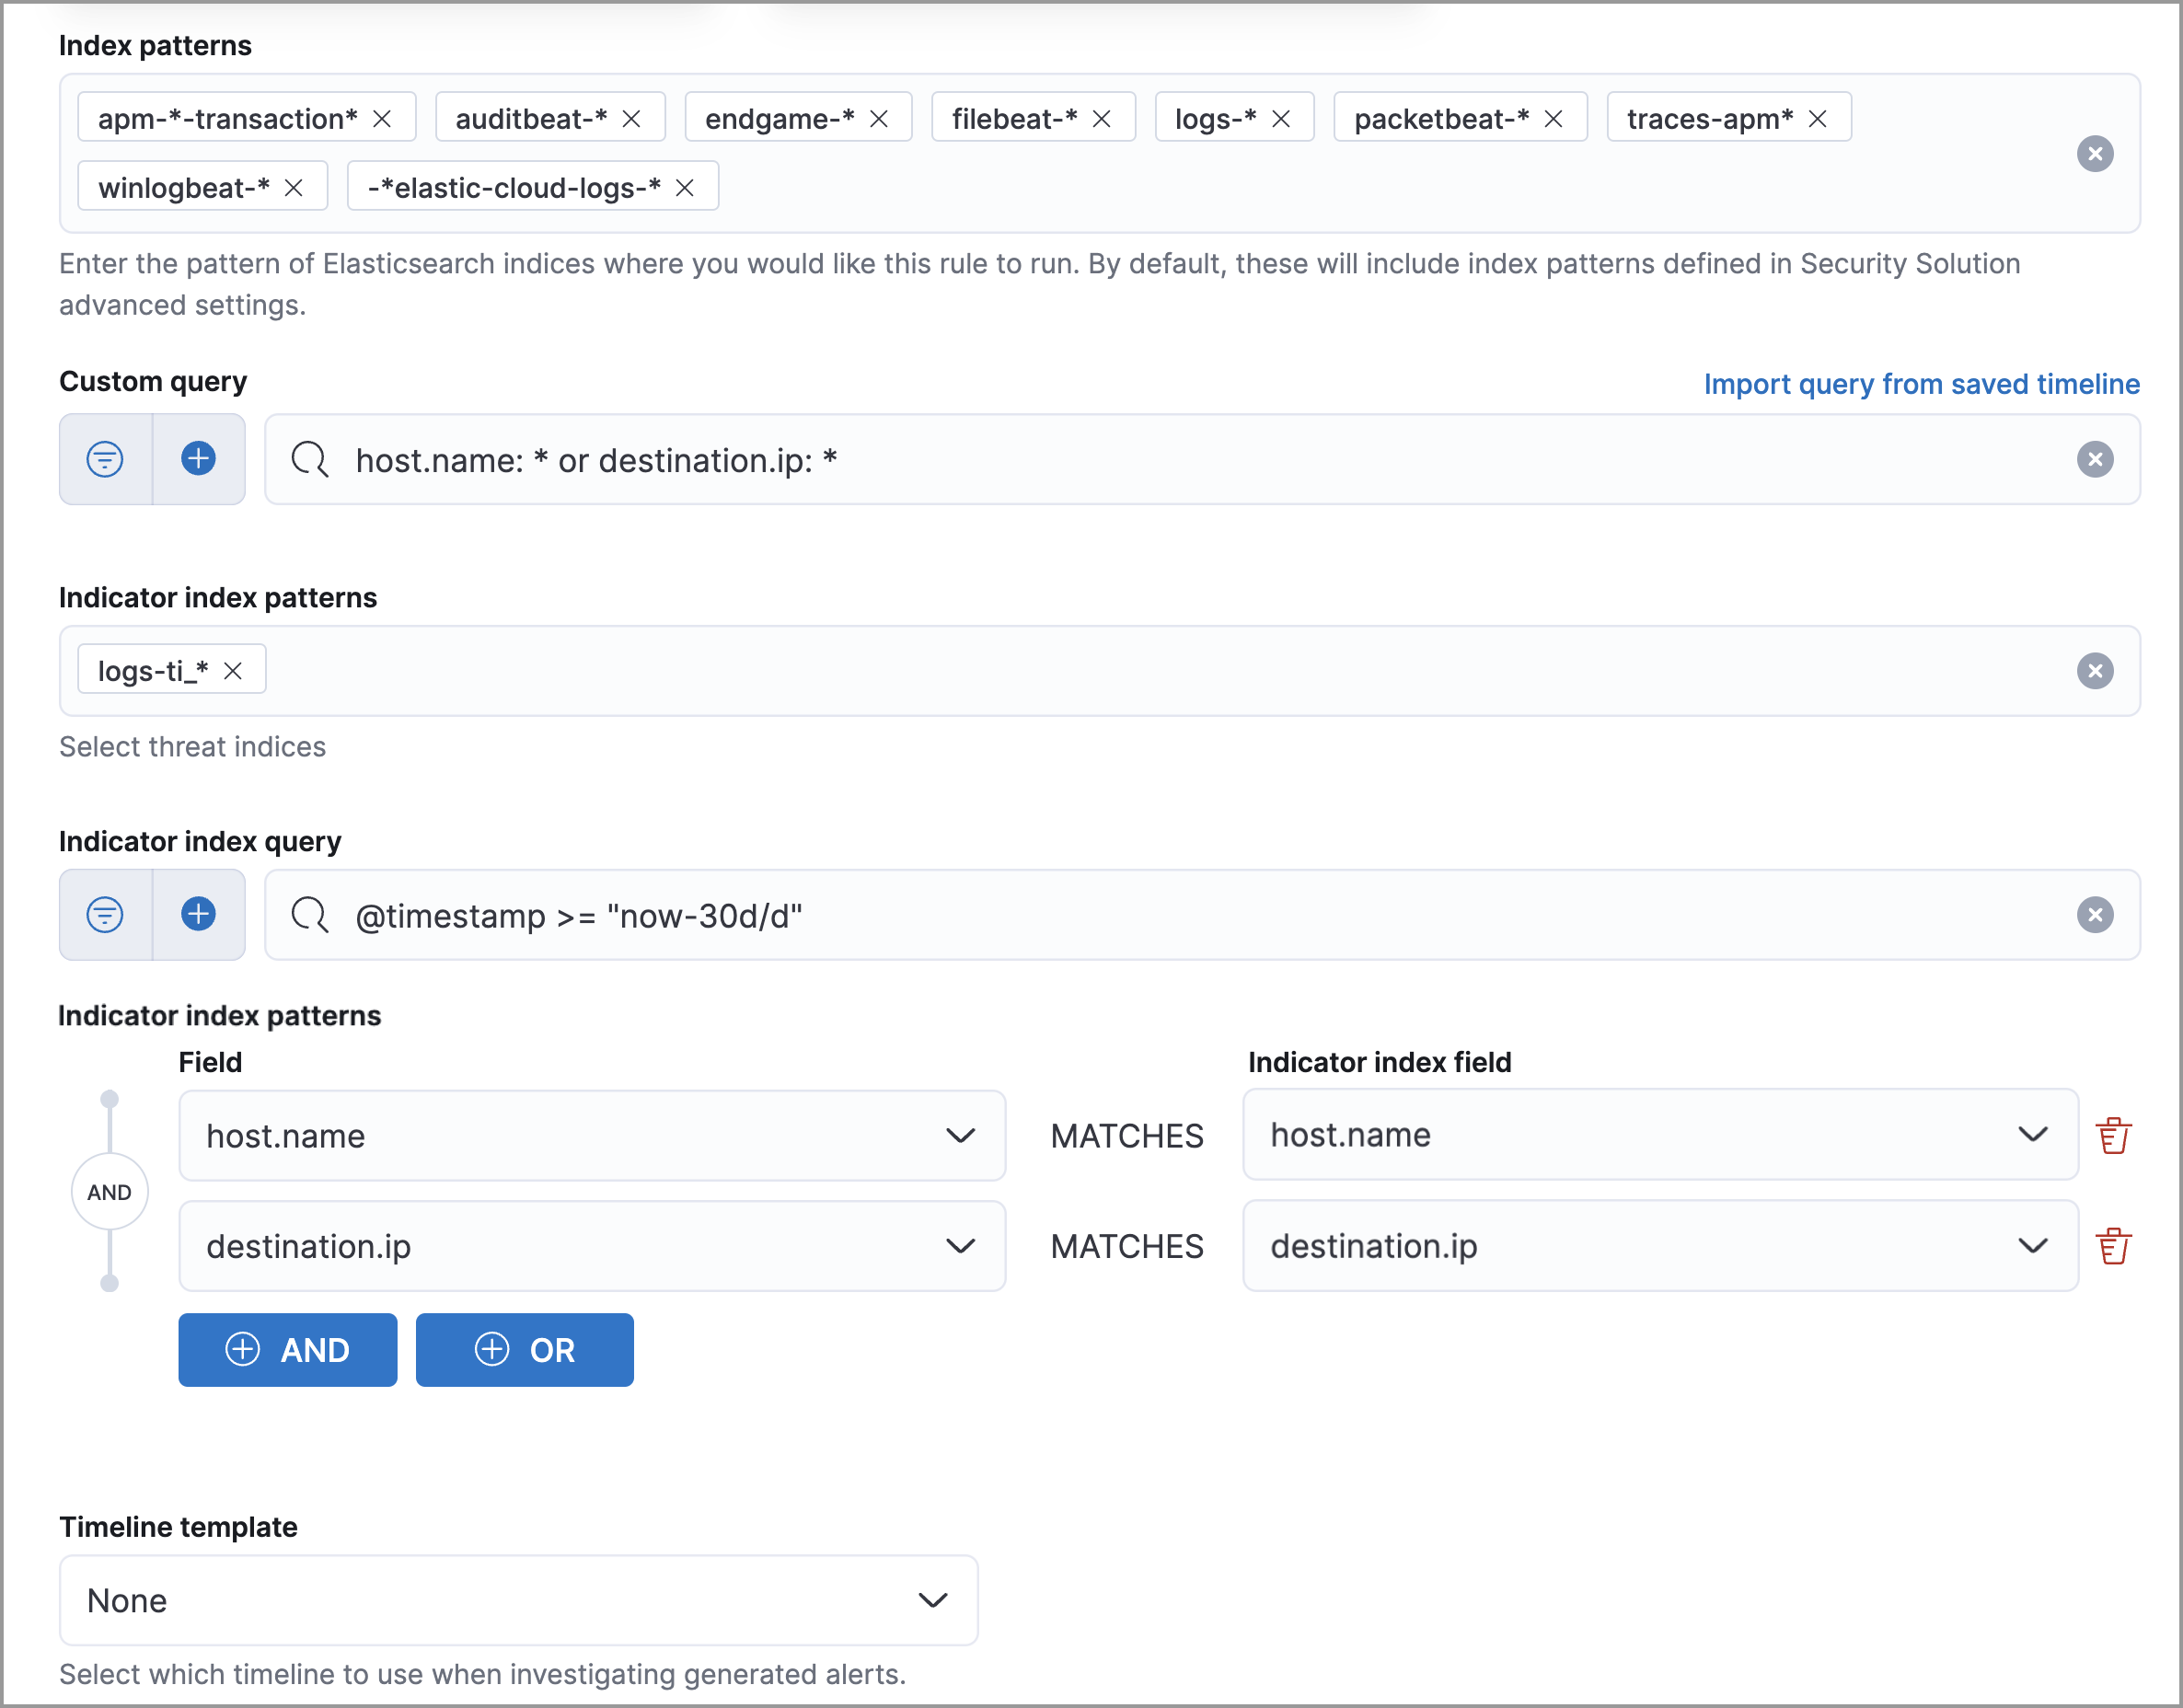
Before you create rules, create Timeline templates so they can be selected here. When alerts generated by the rule are investigated in the Timeline, Timeline query values are replaced with their corresponding alert field values.
- Continue with previewing the rule (optional) or click Continue to configure basic rule settings.
Preview your rule (optional)
editYou can preview any rule to learn how noisy it will be before saving it. If necessary, you can then adjust the rule’s query.
To preview rules, you need the read privilege for the .preview.alerts-security.alerts-<space-id> and .internal.preview.alerts-security.alerts-<space-id>-* indices, plus All privileges for the Security feature. Refer to Detections prerequisites and requirements for more information.
To preview a rule:
- Write the rule query.
-
Select a timeframe of data to preview query results — Last hour, Last day, or Last month — from the Quick query preview drop-down.
Some rules have timeframe limitations:
- Threshold rules: You can only preview query results from the last hour.
- Event correlation rules: You can only preview query results from the last hour and the last day.
-
Click Preview results. The rule preview shows a histogram and alerts table with the alerts you can expect, based on the defined rule parameters and historical events in your indices. You can view the details of a particular alert by clicking the View details button in the alerts table.
The preview excludes the effects of rule exceptions and timestamp overrides. In the preview histogram, alerts are stacked by
event.category(orhost.namefor machine learning rules), and events with multiple values are counted more than once.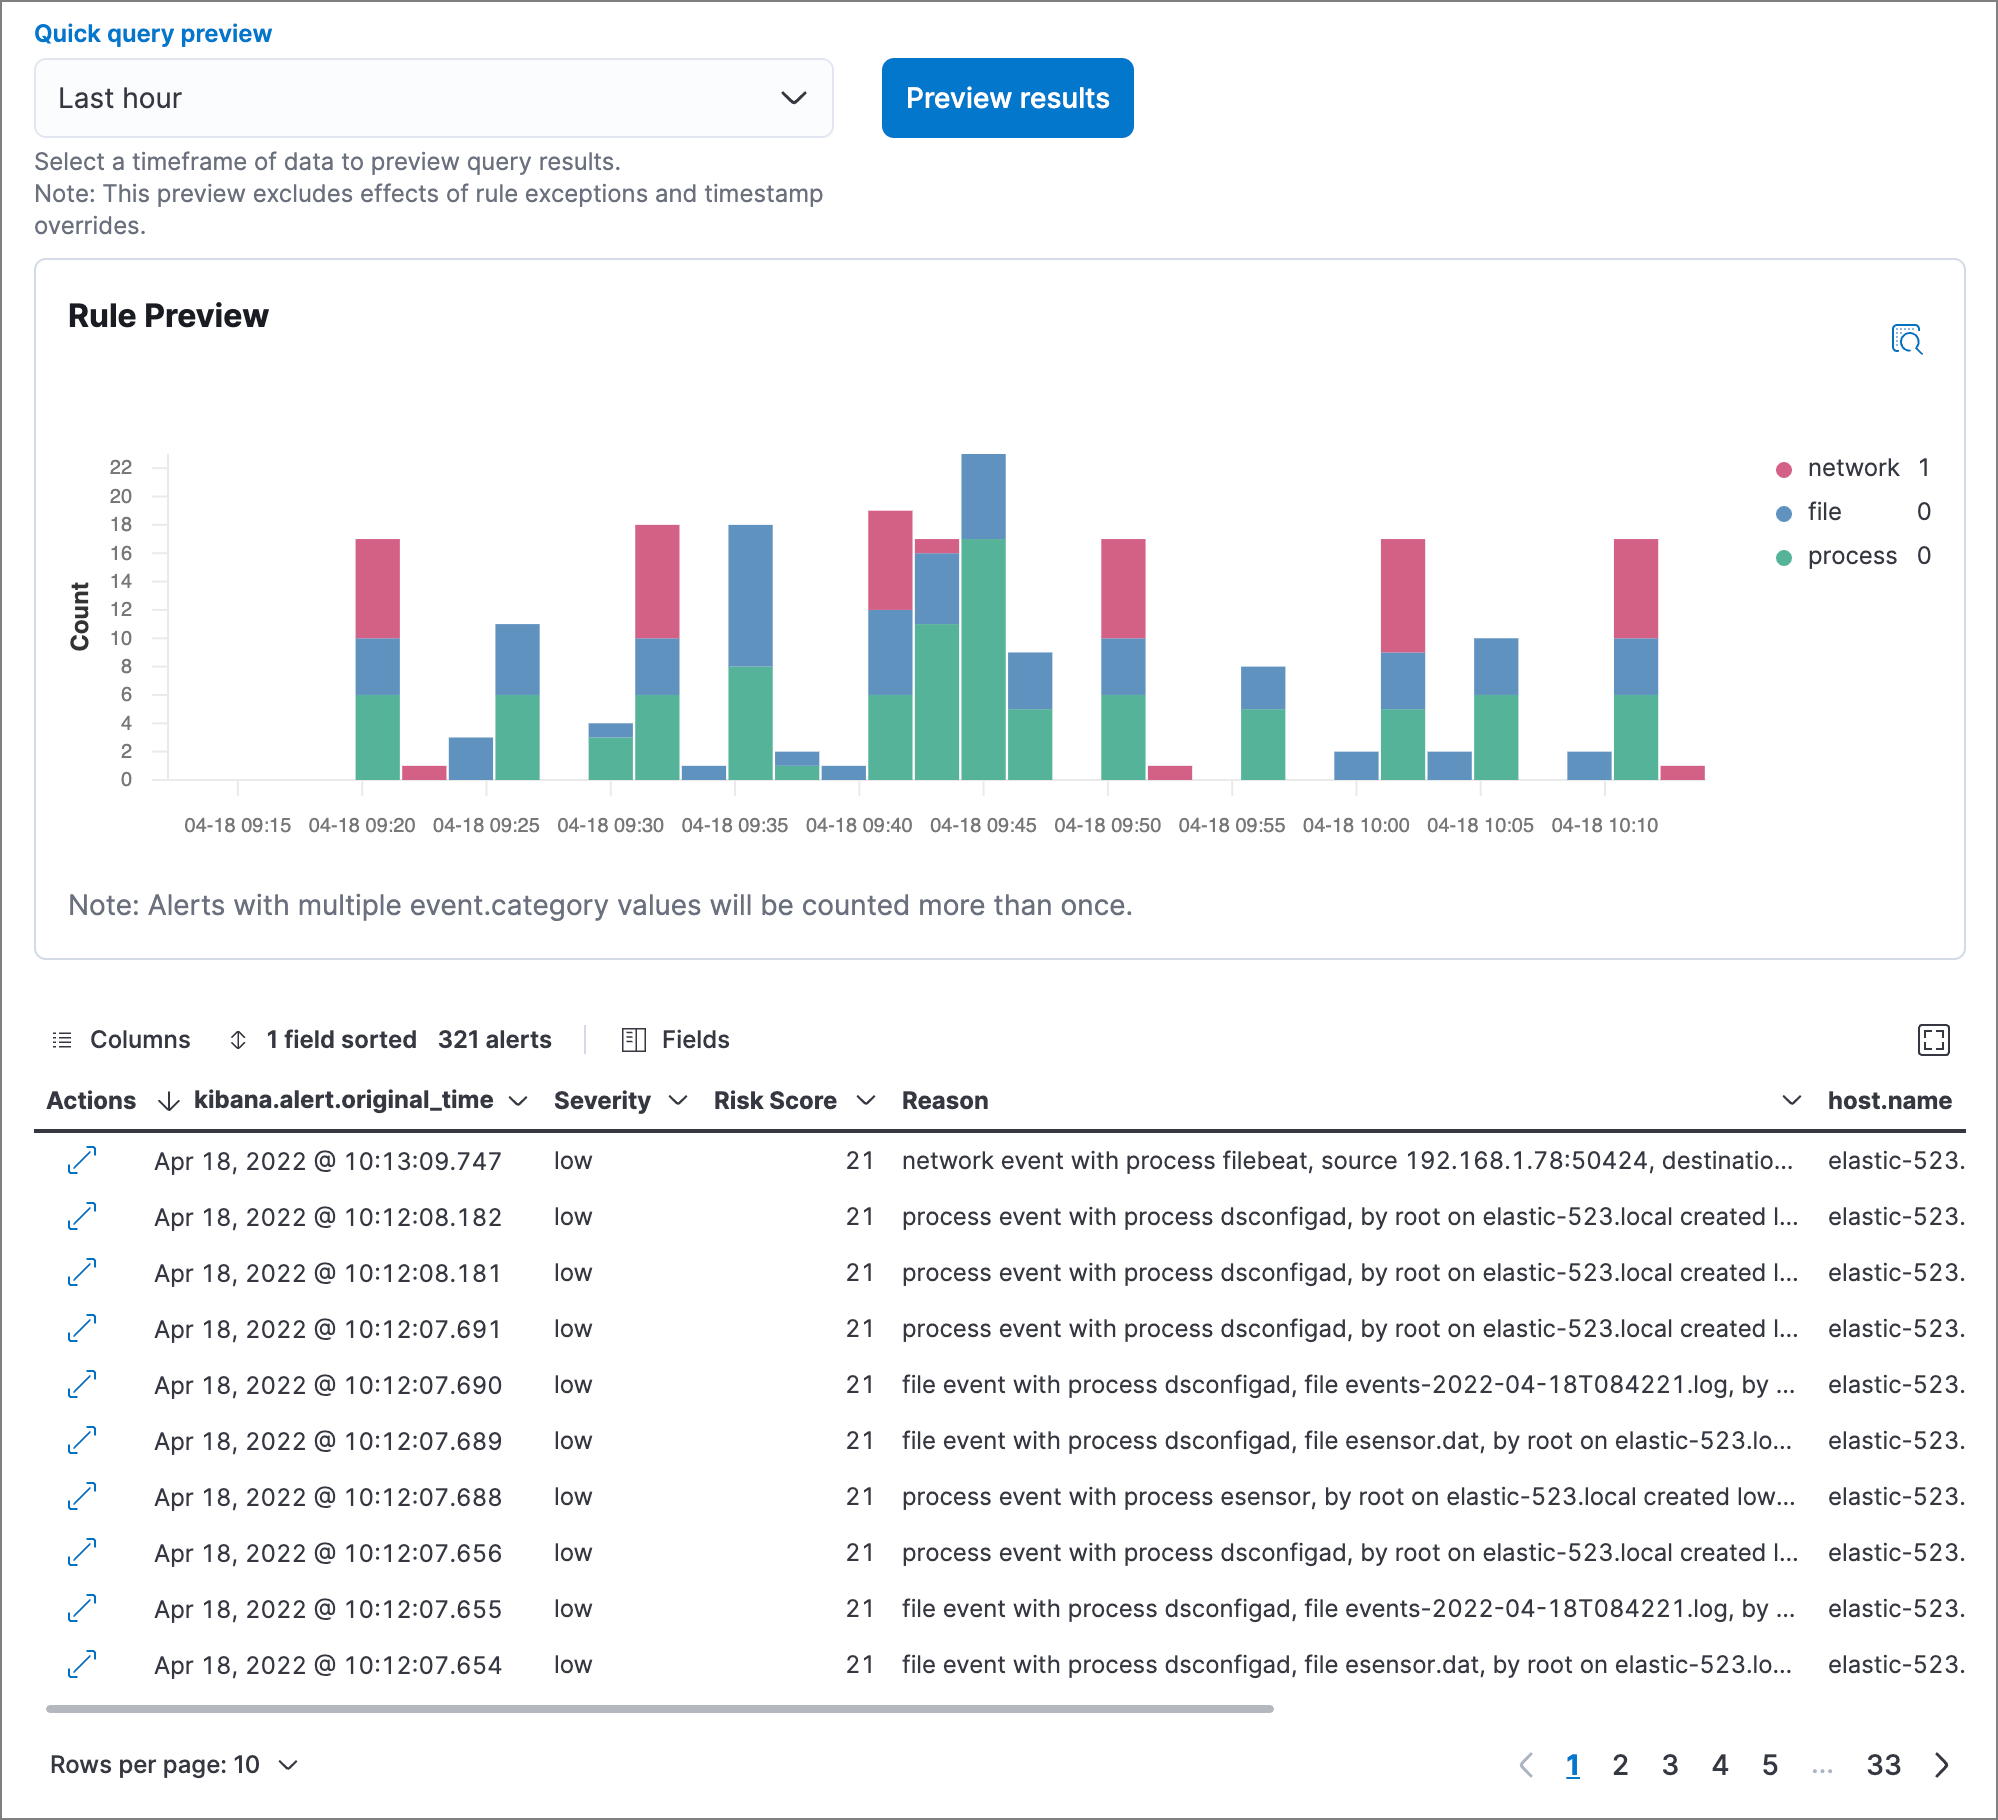
Configure basic rule settings
edit-
In the About rule pane, fill in the following fields:
- Name: The rule’s name.
- Description: A description of what the rule does.
-
Default severity: Select the severity level of alerts created by the rule:
- Low: Alerts that are of interest but generally are not considered to be security incidents. Sometimes a combination of low severity alerts can indicate suspicious activity.
- Medium: Alerts that require investigation.
- High: Alerts that require an immediate investigation.
- Critical: Alerts that indicate it is highly likely a security incident has occurred.
-
Severity override (optional): Select to use source event values to override the Default severity in generated alerts. When selected, a UI component is displayed where you can map the source event field values to severity levels. The following example shows how to map severity levels to
host.namevalues: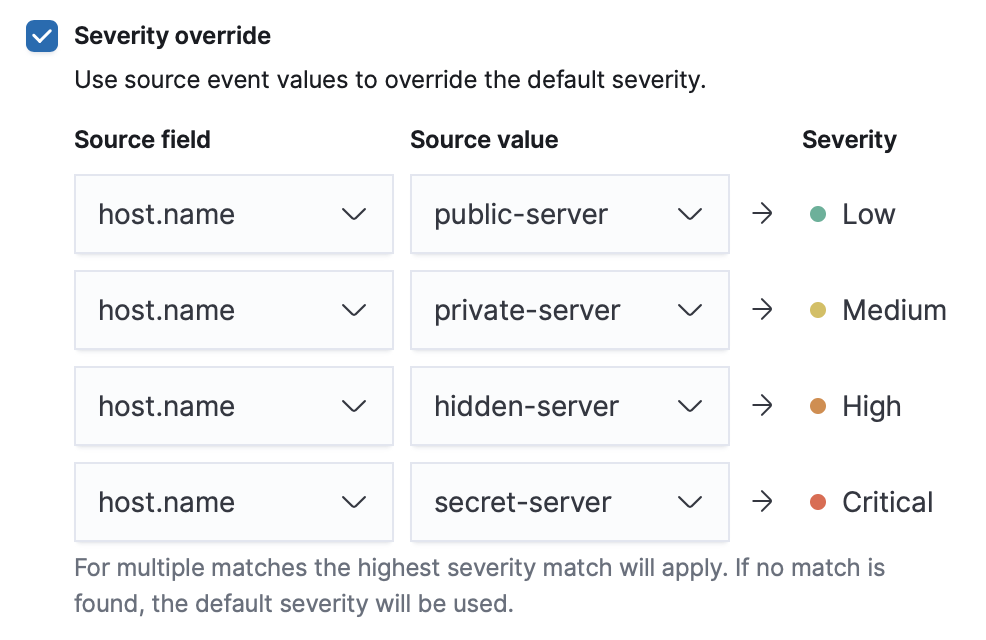
For threshold rules, not all source event values can be used for overrides; only the fields that were aggregated over (the
Group byfields) will contain data. Please also note that overrides are not supported for event correlation rules. -
Default risk score: A numerical value between 0 and 100 that indicates the risk of events detected by the rule. This setting changes to a default value when you change the Severity level, but you can adjust the risk score as needed. General guidelines are:
-
0-21represents low severity. -
22-47represents medium severity. -
48-73represents high severity. -
74-100represents critical severity.
-
-
Risk score override (optional): Select to use a source event value to override the Default risk score in generated alerts. When selected, a UI component is displayed to select the source field used for the risk score. For example, if you want to use the source event’s risk score in alerts:
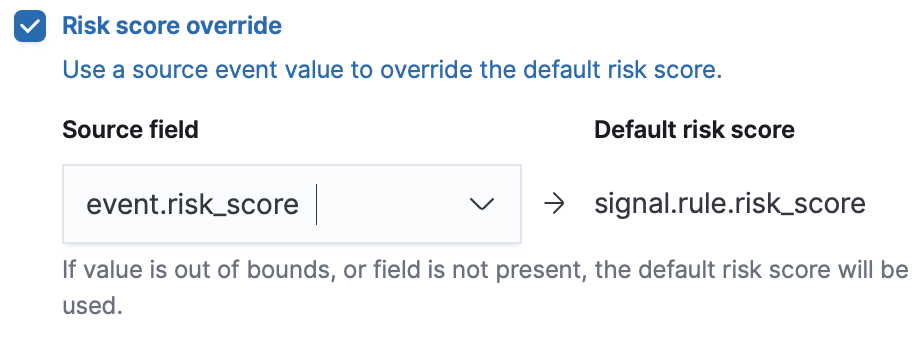
For threshold rules, not all source event values can be used for overrides; only the fields that were aggregated over (the
Group byfields) will contain data. - Tags (optional): Words and phrases used to categorize, filter, and search the rule.
-
Continue with one of the following:
Configure advanced rule settings (optional)
edit-
Click Advanced settings and fill in the following fields where applicable:
- Reference URLs (optional): References to information that is relevant to the rule. For example, links to background information.
- False positive examples (optional): List of common scenarios that may produce false-positive alerts.
- MITRE ATT&CKTM threats (optional): Add relevant MITRE framework tactics, techniques, and subtechniques.
- Investigation guide (optional): Information for analysts investigating alerts created by the rule.
- Author (optional): The rule’s authors.
- License (optional): The rule’s license.
-
Elastic endpoint exceptions (optional): Adds all Elastic Endpoint Security rule exceptions to this rule (see Rule exceptions and value lists).
If you select this option, you can add Endpoint exceptions on the Rule details page. Additionally, all future exceptions added to the Elastic Endpoint Security rule also affect this rule.
- Building block (optional): Select to create a building-block rule. By default, alerts generated from a building-block rule are not displayed in the UI. See About building block rules for more information.
-
Indicator prefix override: Define the location of indicator data within the structure of indicator documents. When the indicator match rule executes, it queries specified indicator indices and references this setting to locate fields with indicator data. This data is used to enrich indicator match alerts with metadata about matched threat indicators. The default value for this setting is
threat.indicator.If your threat indicator data is at a different location, update this setting accordingly to ensure alert enrichment can still be performed.
-
Rule name override (optional): Select a source event field to use as the rule name in the UI (Alerts table). This is useful for exposing, at a glance, more information about an alert. For example, if the rule generates alerts from Suricata, selecting
event.actionlets you see what action (Suricata category) caused the event directly in the Alerts table.For threshold rules, not all source event values can be used for overrides; only the fields that were aggregated over (the
Group byfields) will contain data. -
Timestamp override (optional): Select a source event timestamp field. When selected, the rule’s query uses the selected field, instead of the default
@timestampfield, to search for alerts. This can help reduce missing alerts due to network or server outages. Specifically, if your ingest pipeline adds a timestamp when events are sent to Elasticsearch, this avoids missing alerts due to ingestion delays.These Filebeat modules have an
event.ingestedtimestamp field that can be used instead of the default@timestampfield: Microsoft and Google Workspace.
-
Click Continue. The Schedule rule pane is displayed.
- Continue with setting the rule’s schedule.
Set the rule’s schedule
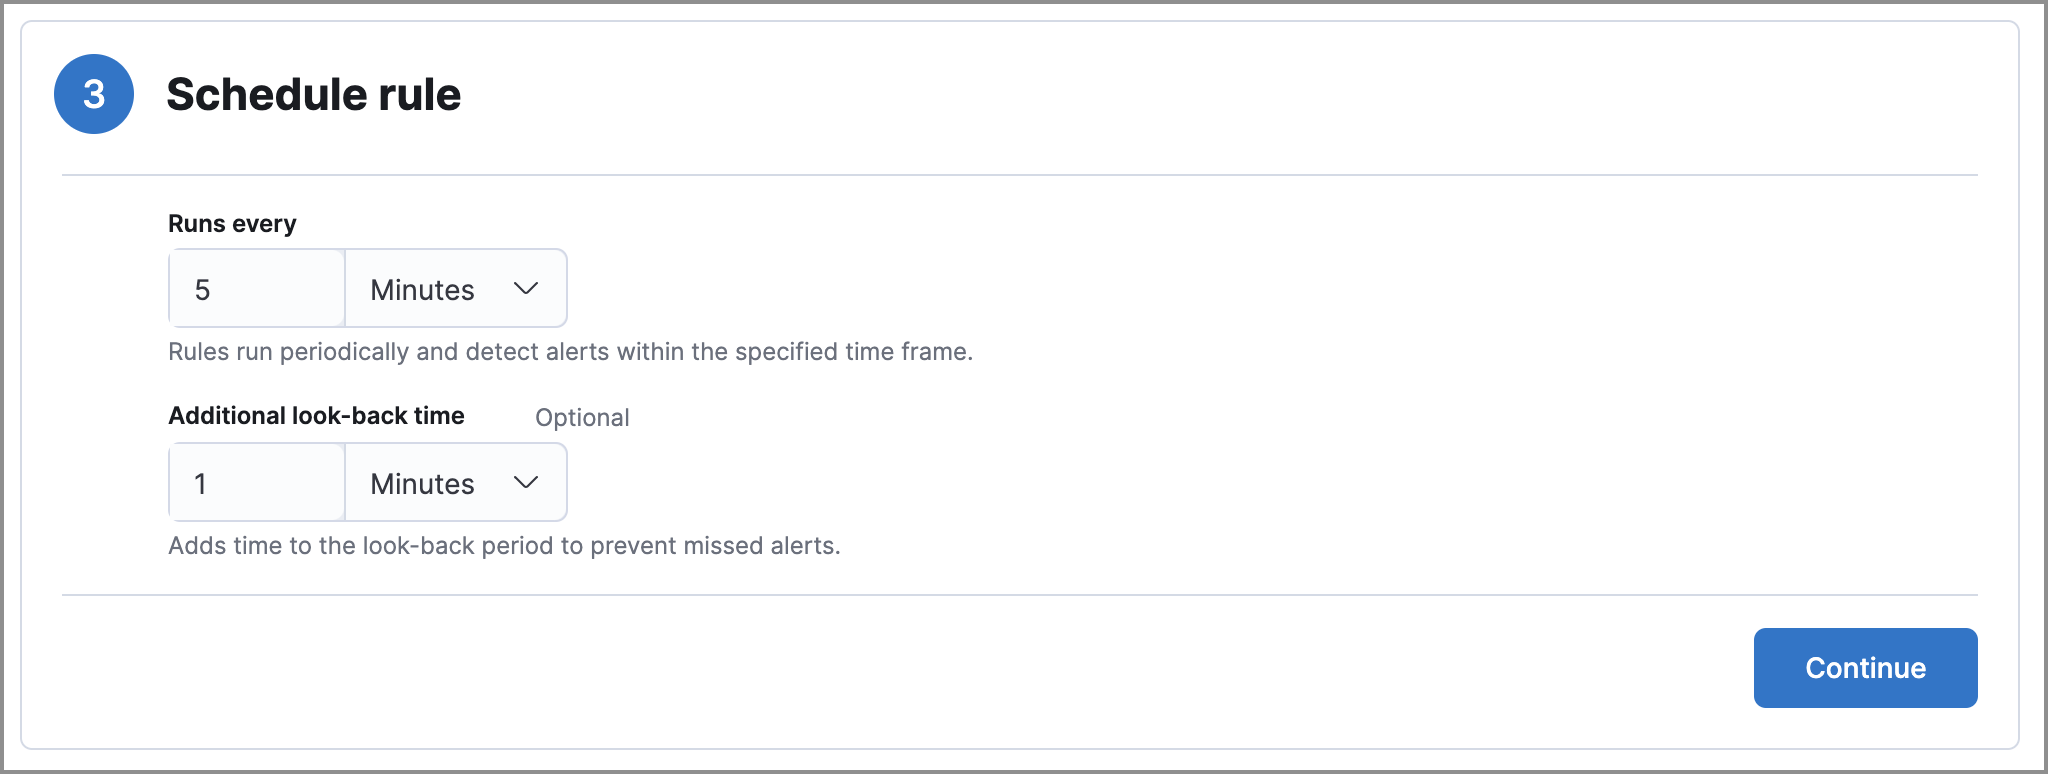
edit- Select how often the rule runs.
-
Optionally, add
Additional look-back timeto the rule. When defined, the rule searches indices with the additional time.For example, if you set a rule to run every 5 minutes with an additional look-back time of 1 minute, the rule runs every 5 minutes but analyzes the documents added to indices during the last 6 minutes.
It is recommended to set the
Additional look-back timeto at least 1 minute. This ensures there are no missing alerts when a rule does not run exactly at its scheduled time.Elastic Security prevents duplication. Any duplicate alerts that are discovered during the
Additional look-back timeare not created. -
Click Continue. The Rule actions pane is displayed.
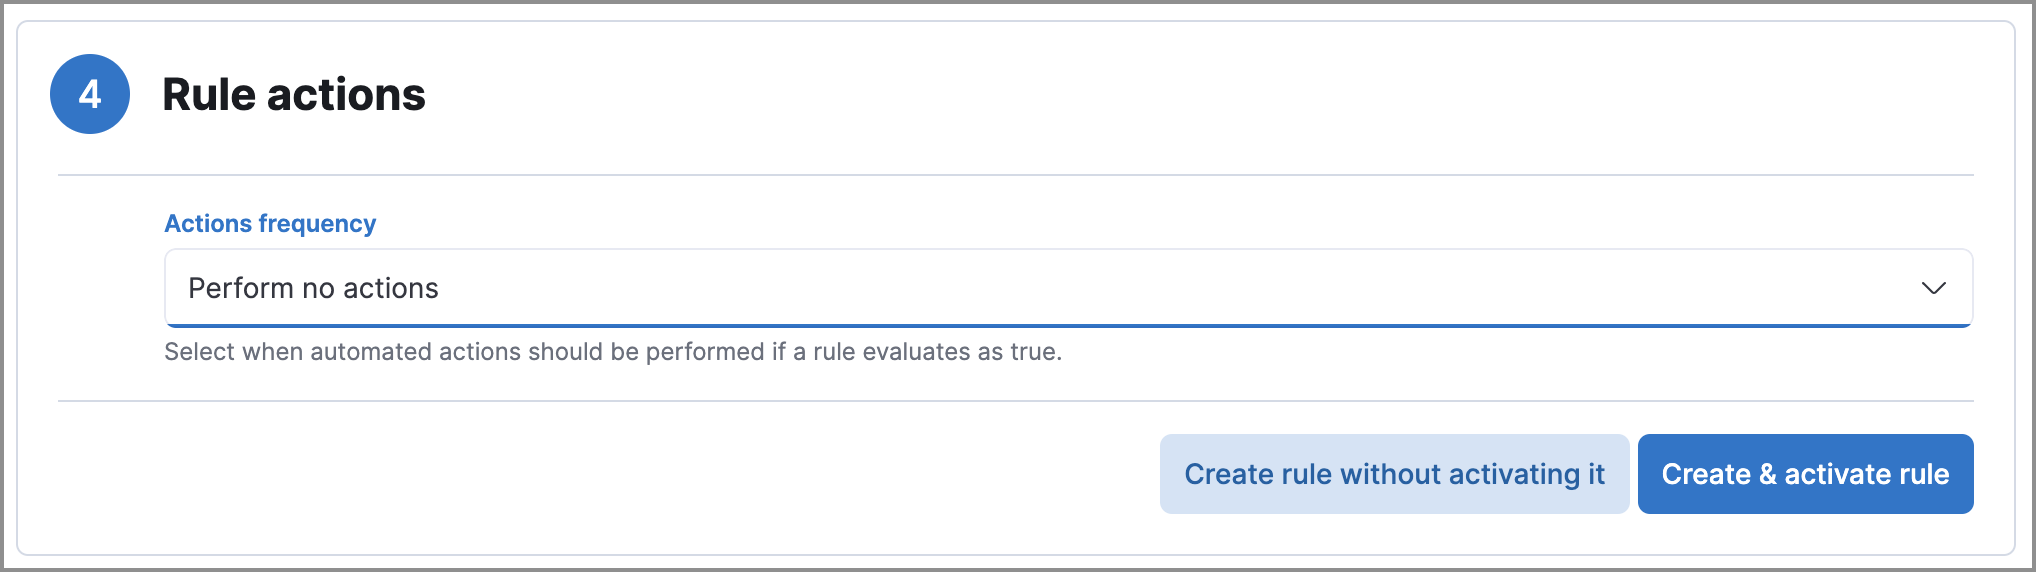
-
Do one of the following:
- Continue with setting up alert notifications (optional).
- Create the rule (with or without activation).
Set up alert notifications (optional)
editUse Kibana Actions to set up notifications sent via other systems when alerts are generated.
To use Kibana Actions for alert notifications, you need the appropriate license and your role needs All privileges for the Action and Connectors feature. For more information, see Cases prerequisites.
-
Set when to send notifications:
- On each rule execution: Sends a notification every time new alerts are generated.
- Hourly: Sends a notification every hour.
- Daily: Sends a notification every day.
-
Weekly: Sends a notification every week.
Notifications are sent only when new alerts are generated.
The available connector types are displayed.
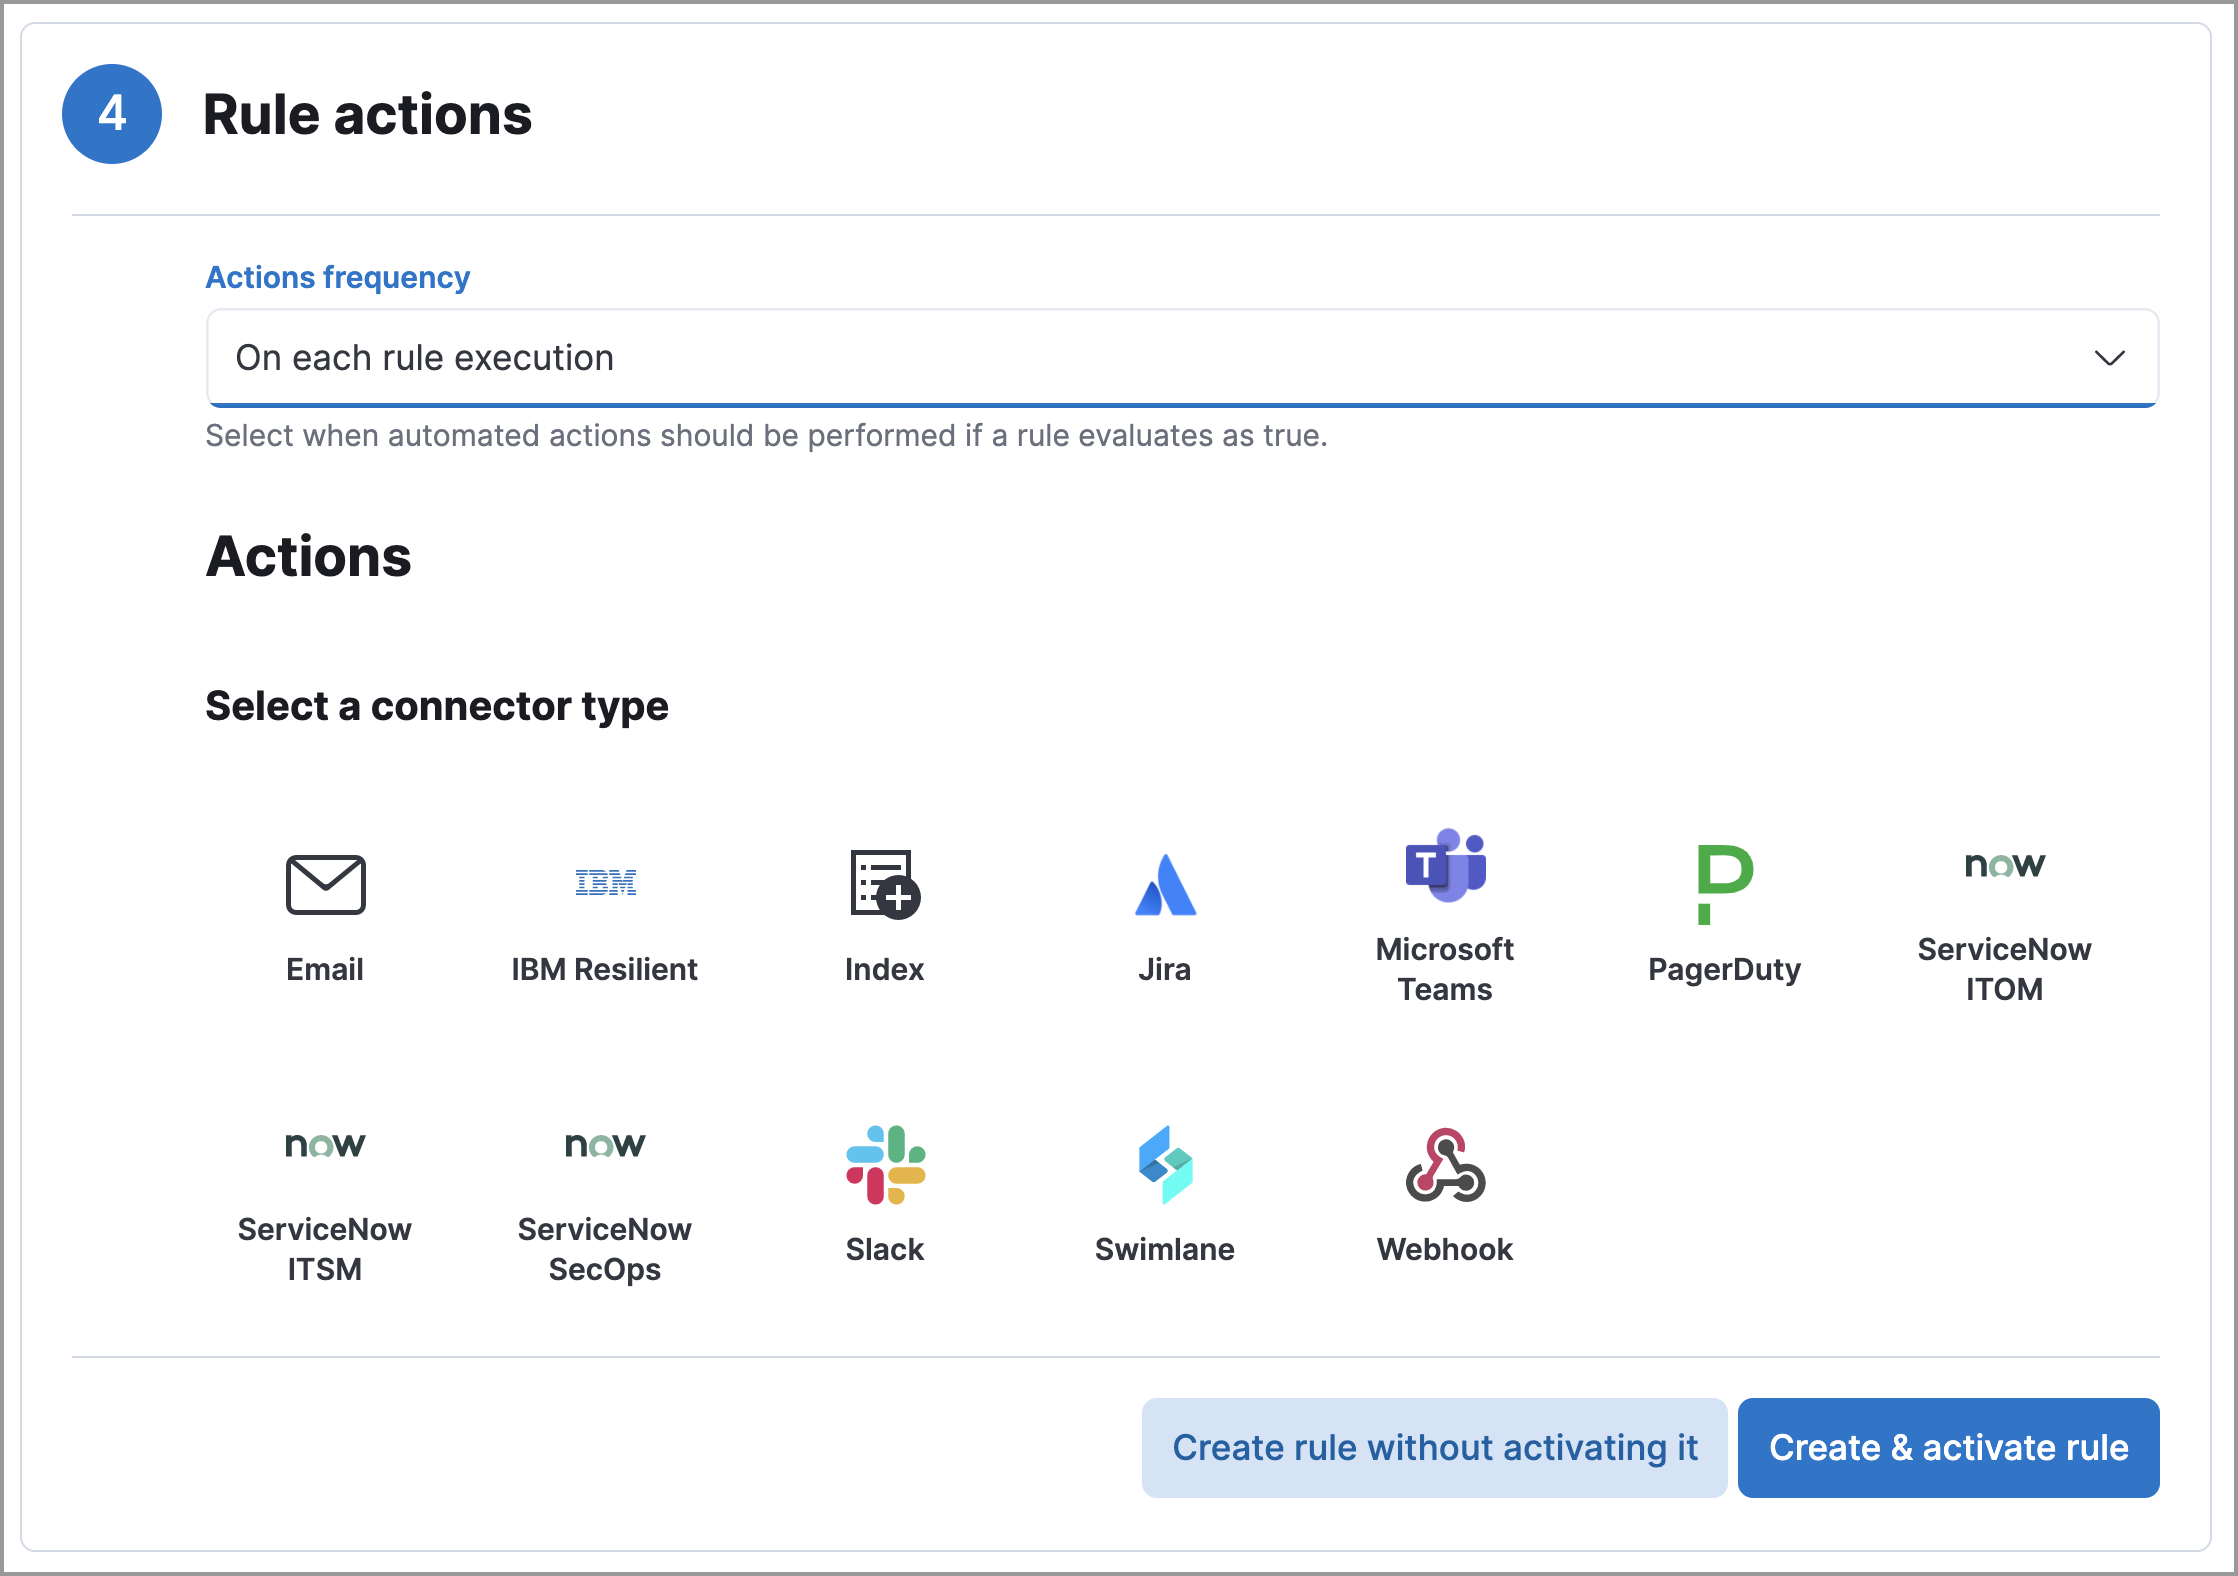
-
Select the required connector type, which determines how notifications are sent. For example, if you select the Jira connector, notifications are sent to your Jira system.
Each action type requires a connector. Connectors store the information required to send the notification from the external system. You can configure connectors while creating the rule or on the Kibana Rules and Connectors page (Stack Management → Rules and Connectors → Connectors). For more information, see Action and connector types.
The selected connector type fields are displayed (Jira example).
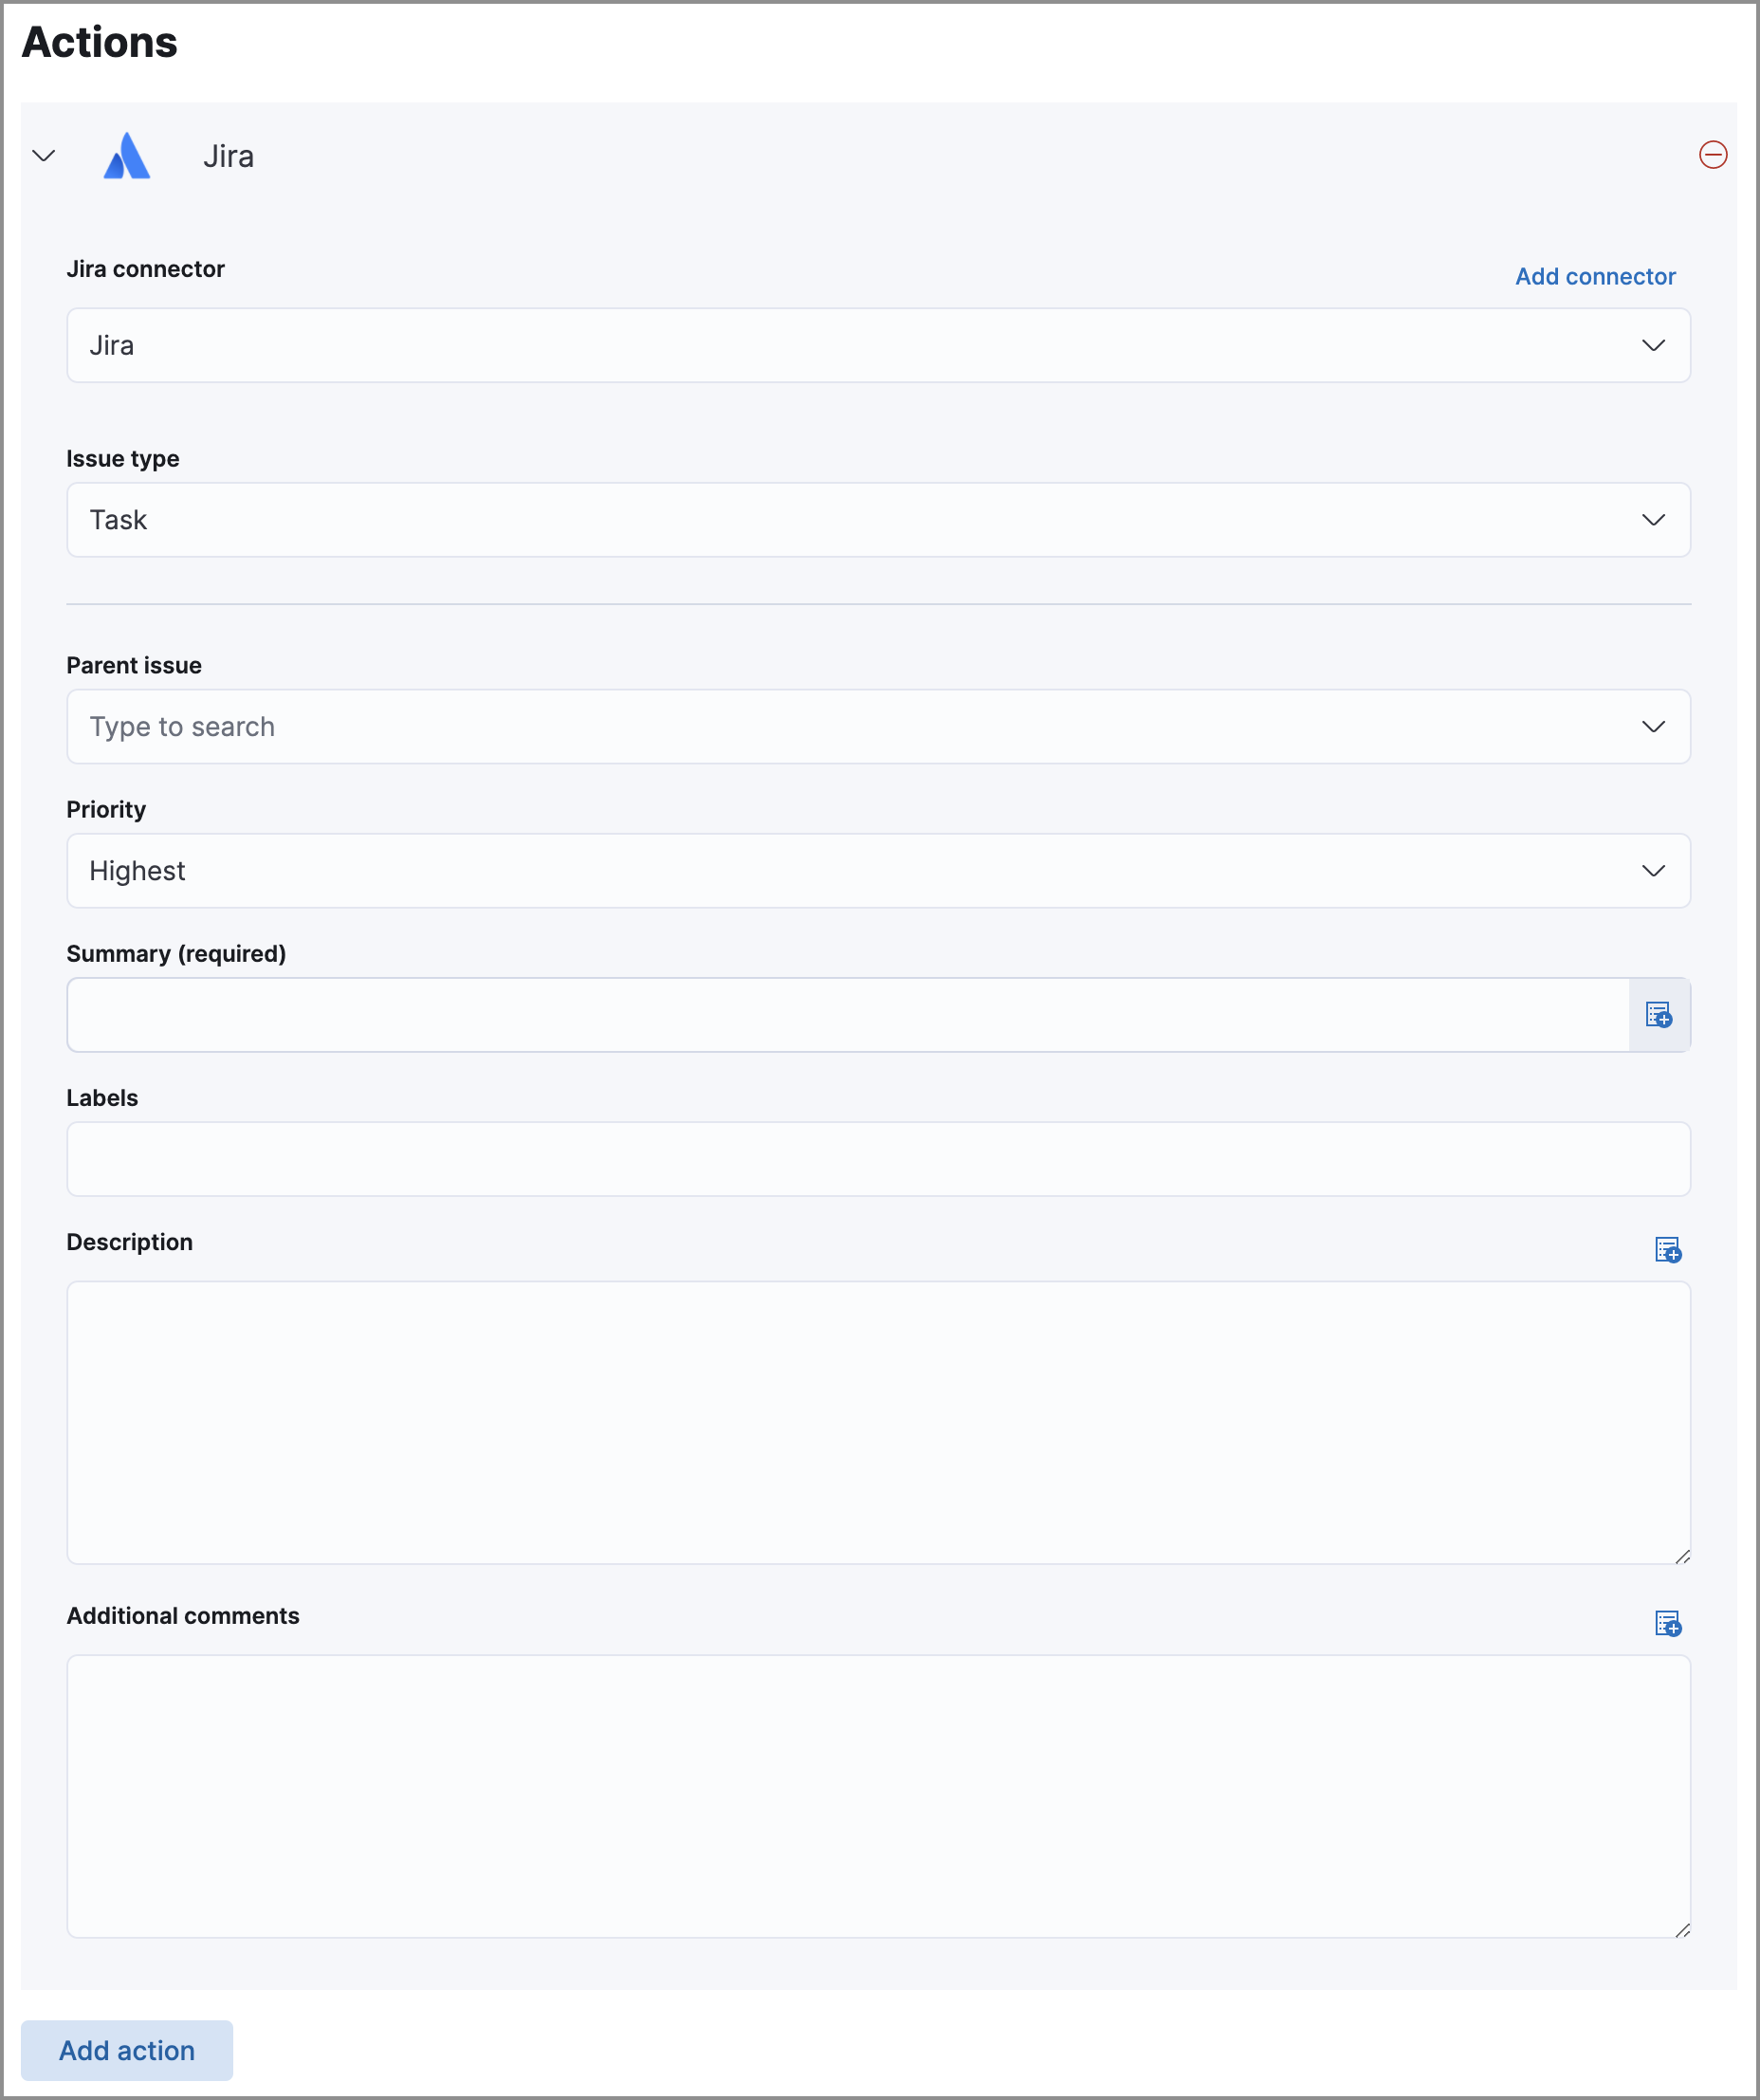
-
Fill in the fields for the selected connector types. For all connector types, click
the icon above the
Messagefield to add placeholders for rule and alert details to the notifications. -
Create the rule with or without activation.
When you activate a rule, it is queued, and its schedule is determined by its initial run time. For example, if you activate a rule that runs every 5 minutes at 14:03 but it does not run until 14:04, it will run again at 14:09.
Alert notification placeholders
editYou can use mustache syntax to add the following placeholders to rule action fields:
-
{{alert.actionGroup}}: Action group of the alert that scheduled actions for the rule -
{{alert.actionGroupName}}: Human readable name of the action group of the alert that scheduled actions for the rule -
{{alert.actionSubgroup}}: Action subgroup of the alert that scheduled actions for the rule -
{{alert.id}}: ID of the alert that scheduled actions for the rule -
{{context.alerts}}: Array of detected alerts -
{{{context.results_link}}}: URL to the alerts in Kibana -
{{context.rule.anomaly_threshold}}: Anomaly threshold score above which alerts are generated (machine learning rules only) -
{{context.rule.description}}: Rule description -
{{context.rule.false_positives}}: Rule false positives -
{{context.rule.filters}}: Rule filters (query rules only) -
{{context.rule.id}}: Unique rule ID returned after creating the rule -
{{context.rule.index}}: Indices rule runs on (query rules only) -
{{context.rule.language}}: Rule query language (query rules only) -
{{context.rule.machine_learning_job_id}}: ID of associated machine learning job (machine learning rules only) -
{{context.rule.max_signals}}: Maximum allowed number of alerts per rule execution -
{{context.rule.name}}: Rule name -
{{context.rule.query}}: Rule query (query rules only) -
{{context.rule.references}}: Rule references -
{{context.rule.risk_score}}: Default rule risk score -
{{context.rule.rule_id}}: Generated or user-defined rule ID that can be used as an identifier across systems -
{{context.rule.saved_id}}: Saved search ID -
{{context.rule.severity}}: Default rule severity -
{{context.rule.threat}}: Rule threat framework -
{{context.rule.threshold}}: Rule threshold values (threshold rules only) -
{{context.rule.timeline_id}}: Associated Timeline ID -
{{context.rule.timeline_title}}: Associated Timeline name -
{{context.rule.type}}: Rule type -
{{context.rule.version}}: Rule version -
{{date}}`: Date the rule scheduled the action -
{{kibanaBaseUrl}}: Configuredserver.publicBaseUrlvalue, or empty string if not configured -
{{rule.id}}: ID of the rule -
{{rule.name}}: Name of the rule -
{{rule.spaceId}}: Space ID of the rule -
{{rule.tags}}: Tags of the rule -
{{rule.type}}: Type of rule -
{{state.signals_count}}: Number of alerts detected
The {{context.rule.severity}} and {{context.rule.risk_score}}
placeholders contain the rule’s default values even when the Severity override
and Risk score override options are used.
Alert placeholder examples
editTo understand which fields to parse, see the Detections API to view the JSON representation of rules.
Example using {{context.rule.filters}} to output a list of filters:
{{#context.rule.filters}}
{{^meta.disabled}}{{meta.key}} {{#meta.negate}}NOT {{/meta.negate}}{{meta.type}} {{^exists}}{{meta.value}}{{meta.params.query}}{{/exists}}{{/meta.disabled}}
{{/context.rule.filters}}
Example using {{context.alerts}} as an array, which contains each alert generated since the last time the action was executed:
{{#context.alerts}}
Detection alert for user: {{user.name}}
{{/context.alerts}}
Example using the mustache "current element" notation {{.}} to output all the rule references in the signal.rule.references array:
{{#signal.rule.references}} {{.}} {{/signal.rule.references}}
Use value lists with indicator match rules
editWhile there are numerous ways you can add data into indicator indices, you can use value lists as the indicator match index in an indicator match rule. Take the following scenario, for example:
You uploaded a value list of known ransomware domains, and you want to be notified if any of those domains matches a value contained in a domain field in your security event index pattern.
- Upload a value list of indicators.
-
Create an indicator match rule and fill in the following fields:
- Index patterns: The Elastic Security event indices on which the rule runs.
-
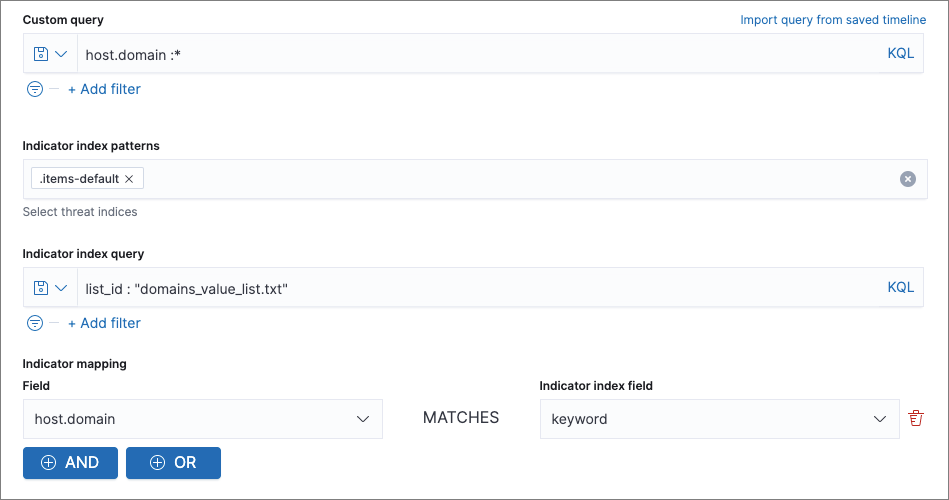
Custom query: The query and filters used to retrieve the required results from the Elastic Security event indices (e.g.,
host.domain :*). -
Indicator index patterns: Value lists are stored in a hidden index called
.items-<Kibana space>. Enter the name of the Kibana space in which this rule will run in this field. -
Indicator index query: Enter the value
list_id :, followed by the name of the value list you want to use as your indicator index (uploaded in Step 1 above). -
Indicator mapping
- Field: Enter the field from the Elastic Security event indices to be used for comparing values.
-
Indicator index field: Enter the type of value list you created (i.e.,
keyword,text, orIP).If you don’t remember this information, go to Detect → Rules > Upload value lists. Locate the appropriate value list and note the field in the corresponding
Typecolumn. (Examples include keyword, text, and IP.)