Run Osquery
editRun Osquery
editOsquery allows you to run live queries against an alert’s host to learn more about your infrastructure and operating systems. For example, with Osquery, you can search your system for indicators of compromise that might have contributed to the alert. You can then use this data to form your investigation and alert triage efforts.
You must complete the following to access Osquery and run searches against your hosts:
- Enable the Osquery manager integration on the host associated with the alert.
- Update your role’s privileges to allow access to Osquery.
- Verify that Elastic Agent’s status is Healthy. Refer to Fleet Troubleshooting if it is not.
-
Do one of the following from the Alerts table:
- Click the View details button to open the Alert details flyout, then click Take action → Run Osquery.
- Select the More actions menu (…), then select Run Osquery.
-
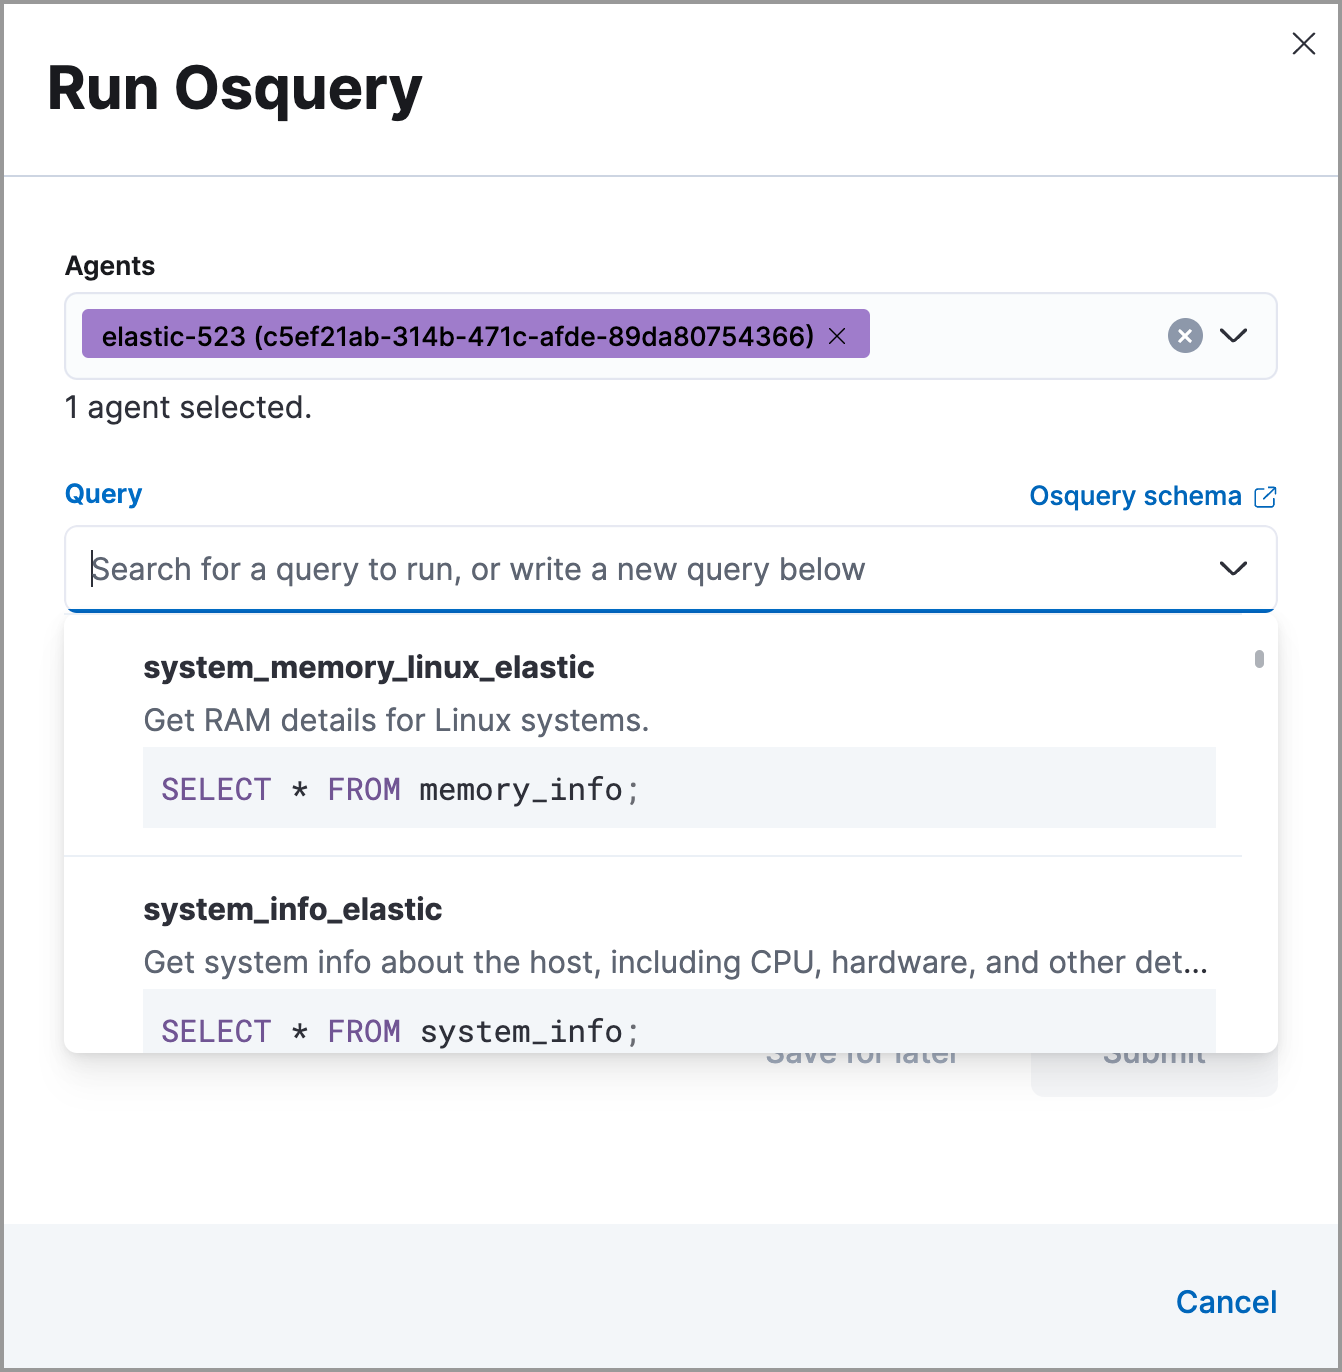
Select one or more Elastic Agents or groups to query. Start typing in the search field to get suggestions for Elastic Agents by name, ID, platform, and policy.
The host associated with the alert is automatically selected. You can specify additional hosts to query.
-
Enter a new query or select a saved query.
- (Optional) Expand the Advanced section to view or set mapped ECS fields included in the results from the live query.
-
Click Submit.
To save the query for future use, click Save for later and define the ID, description, and other details.
-
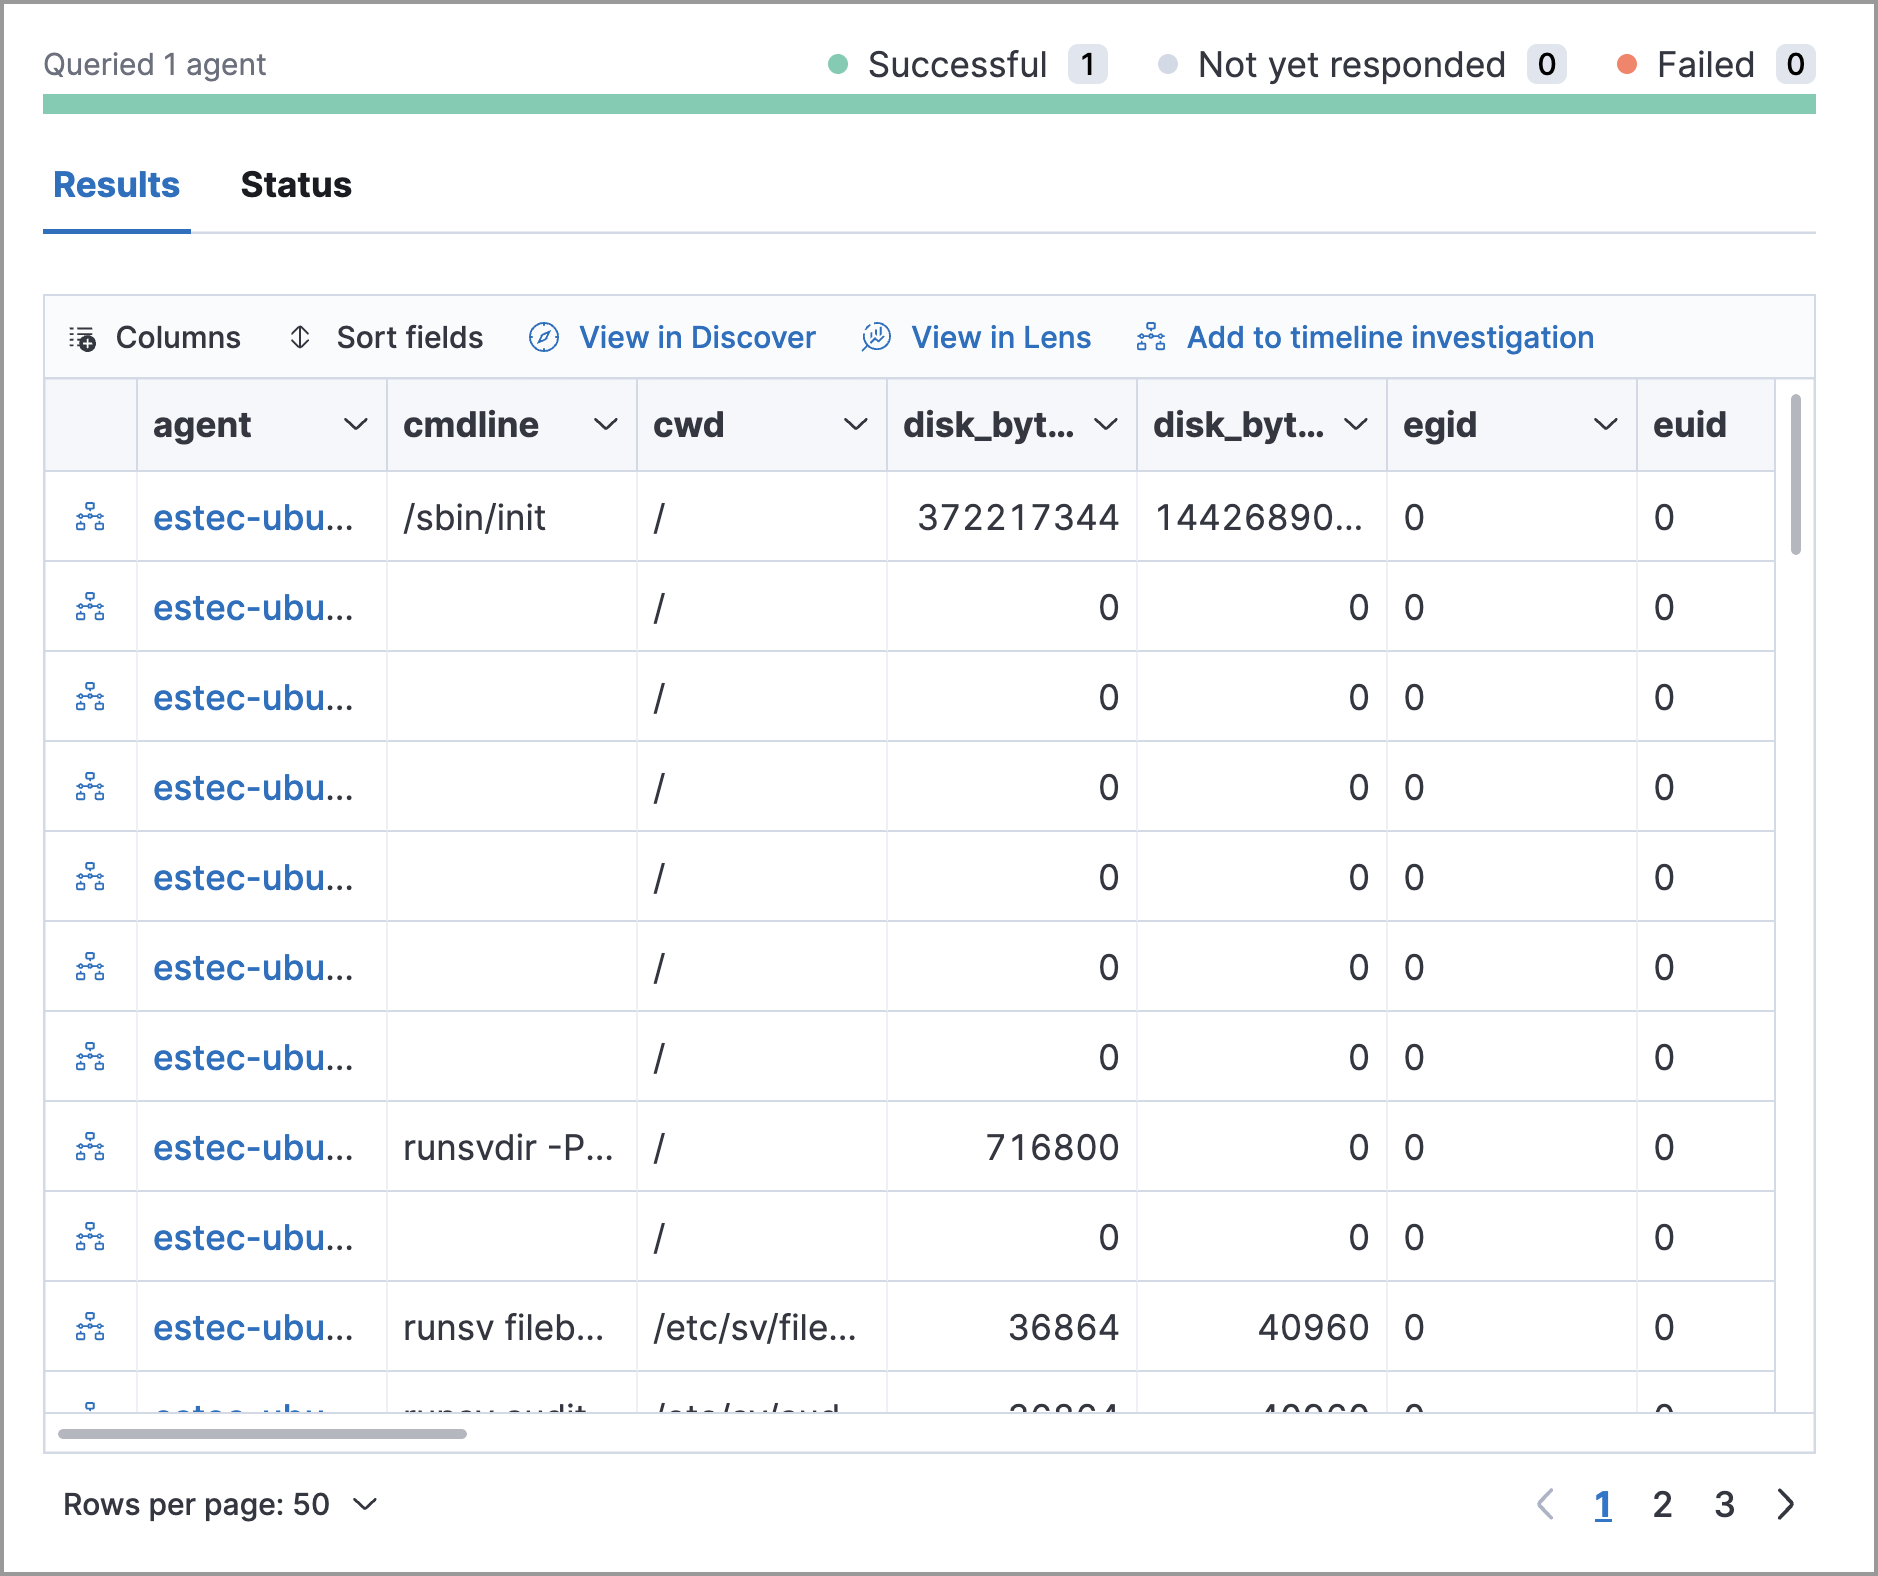
Review the results in the table. You can also:
- Navigate to Discover to dive deeper into the response.
- Use the drag-and-drop Lens editor to create visualizations.
-
Click the Timeline button (
 ) to investigate a single query result in Timeline or Add to timeline investigation to investigate all results.
An
action_IDis generated when you run an Osquery query. Theaction_IDfield and value pair is passed to the Timeline’s KQL filter when you select the option to open all results in Timeline. -
To view more information about the request, such as failures, open the Status tab in the results table.