Visual event analyzer
editVisual event analyzer
editElastic Security allows any event detected by Elastic Endpoint to be analyzed using a process-based visual analyzer, which shows a graphical timeline of processes that led up to the alert and the events that occurred immediately after. Viewing events in the visual event analyzer is useful to determine the origin of potentially malicious activity and other areas in your environment that may be compromised. It also enables security analysts to drill down into all related hosts, processes, and other events to aid in their investigations.
Find events to analyze
editYou can only visualize events triggered by hosts configured with the Endpoint and Cloud Security integration or any sysmon data from winlogbeat.
In KQL, this translates to any event with the agent.type set to either:
-
endpoint -
winlogbeatwithevent.moduleset tosysmon
To find events that can be visually analyzed:
-
First, view a list of events by doing one of the following:
- Go to Explore → Hosts, then select the Events tab. A list of all your hosts' events appears at the bottom of the page.
- Go to Detect → Alerts, then scroll down to view the Alerts table.
-
Filter events that can be visually analyzed by entering either of the following queries in the KQL search bar, then selecting Enter:
-
agent.type:"endpoint" and process.entity_id :*Or
-
agent.type:"winlogbeat" and event.module: "sysmon" and process.entity_id : *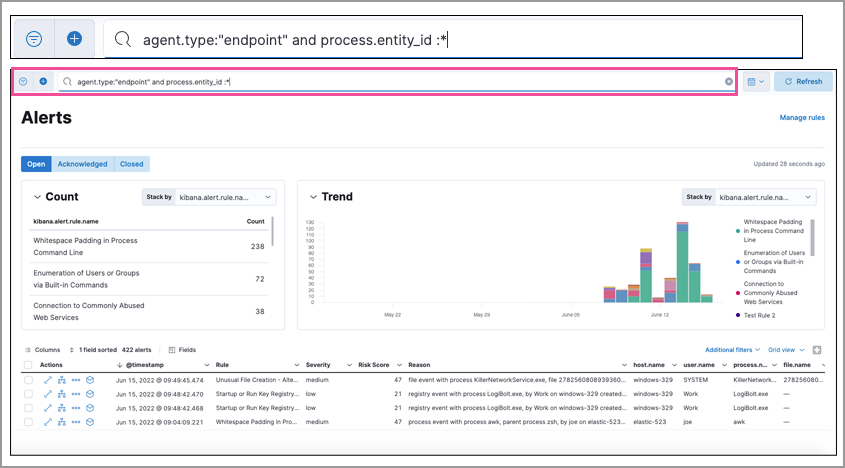
-
- Events that can be visually analyzed are denoted by a cubical Analyze event icon. Select this option to open the event in the visual analyzer.
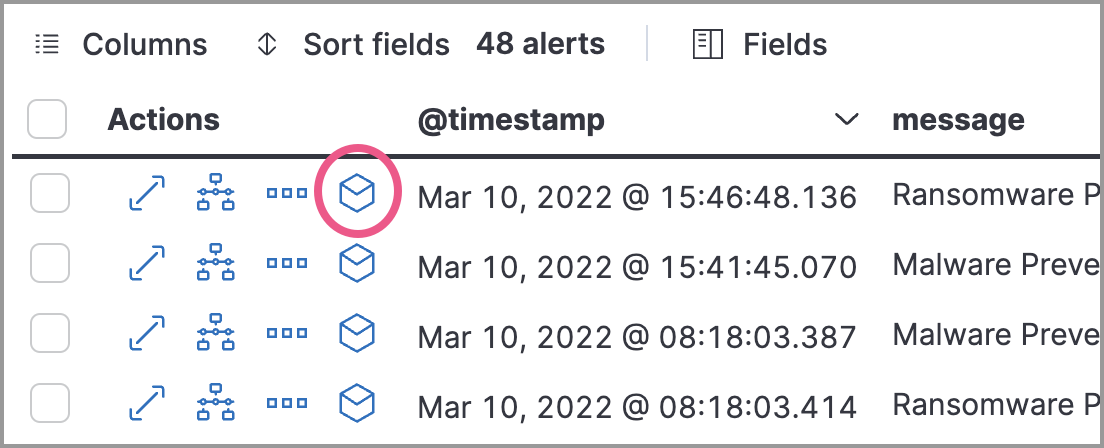
Events that cannot be analyzed will not have the Analyze event option available. This might occur if the event has incompatible field mappings.
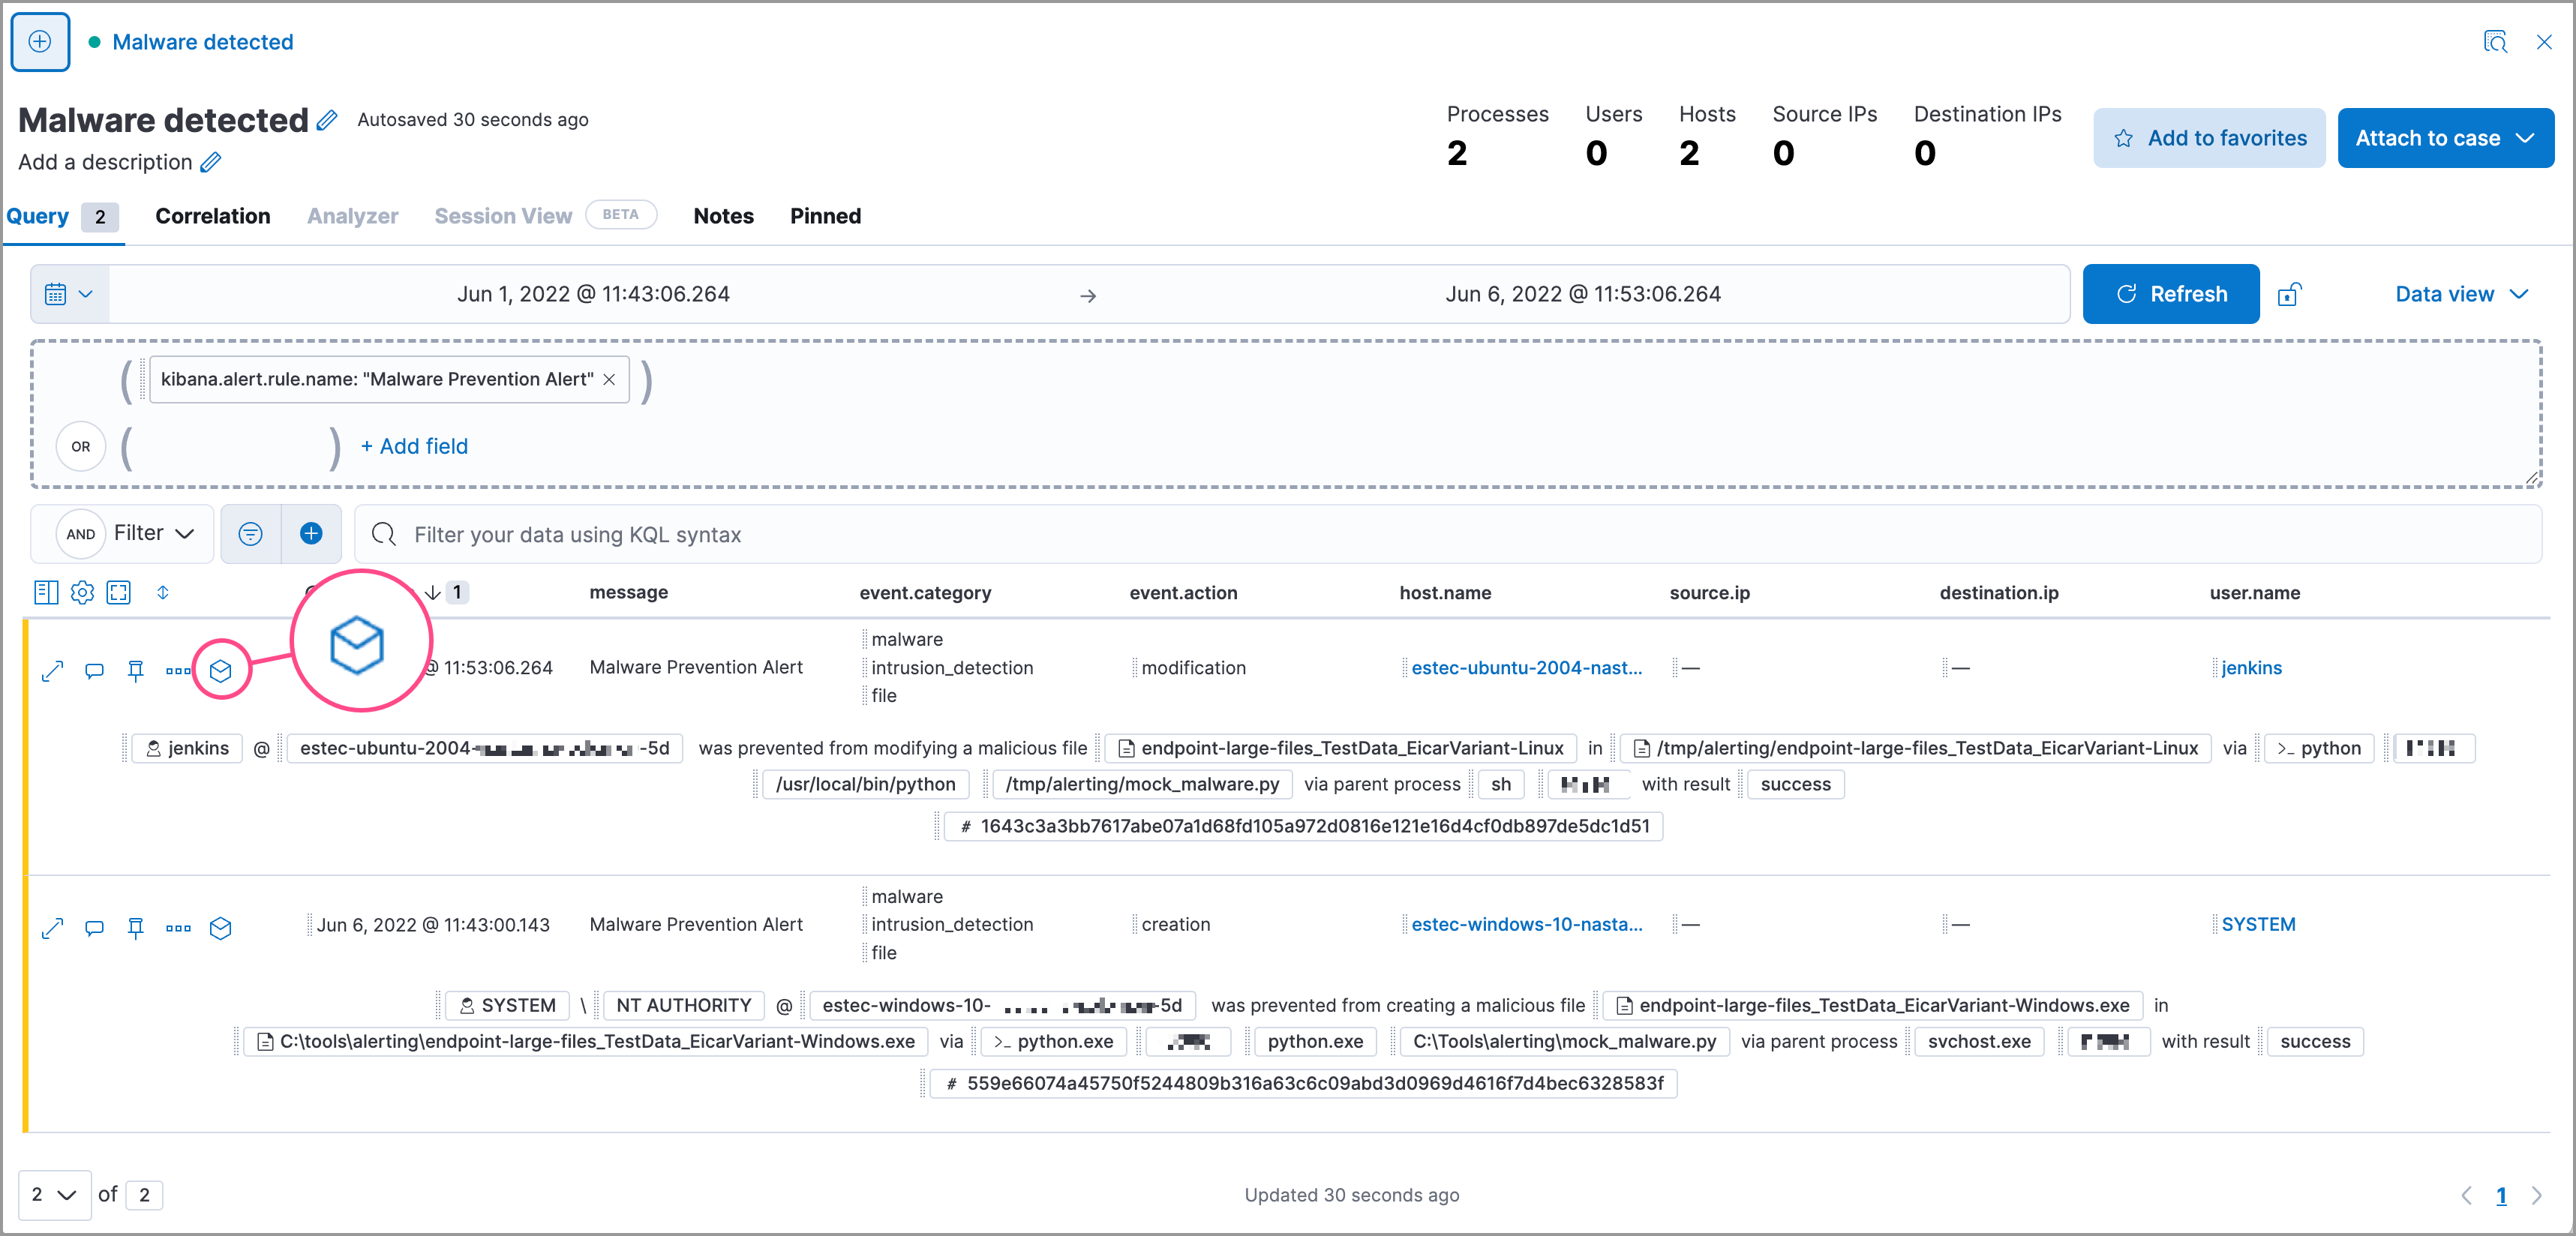
You can also analyze events from Timelines.
Visual event analyzer UI
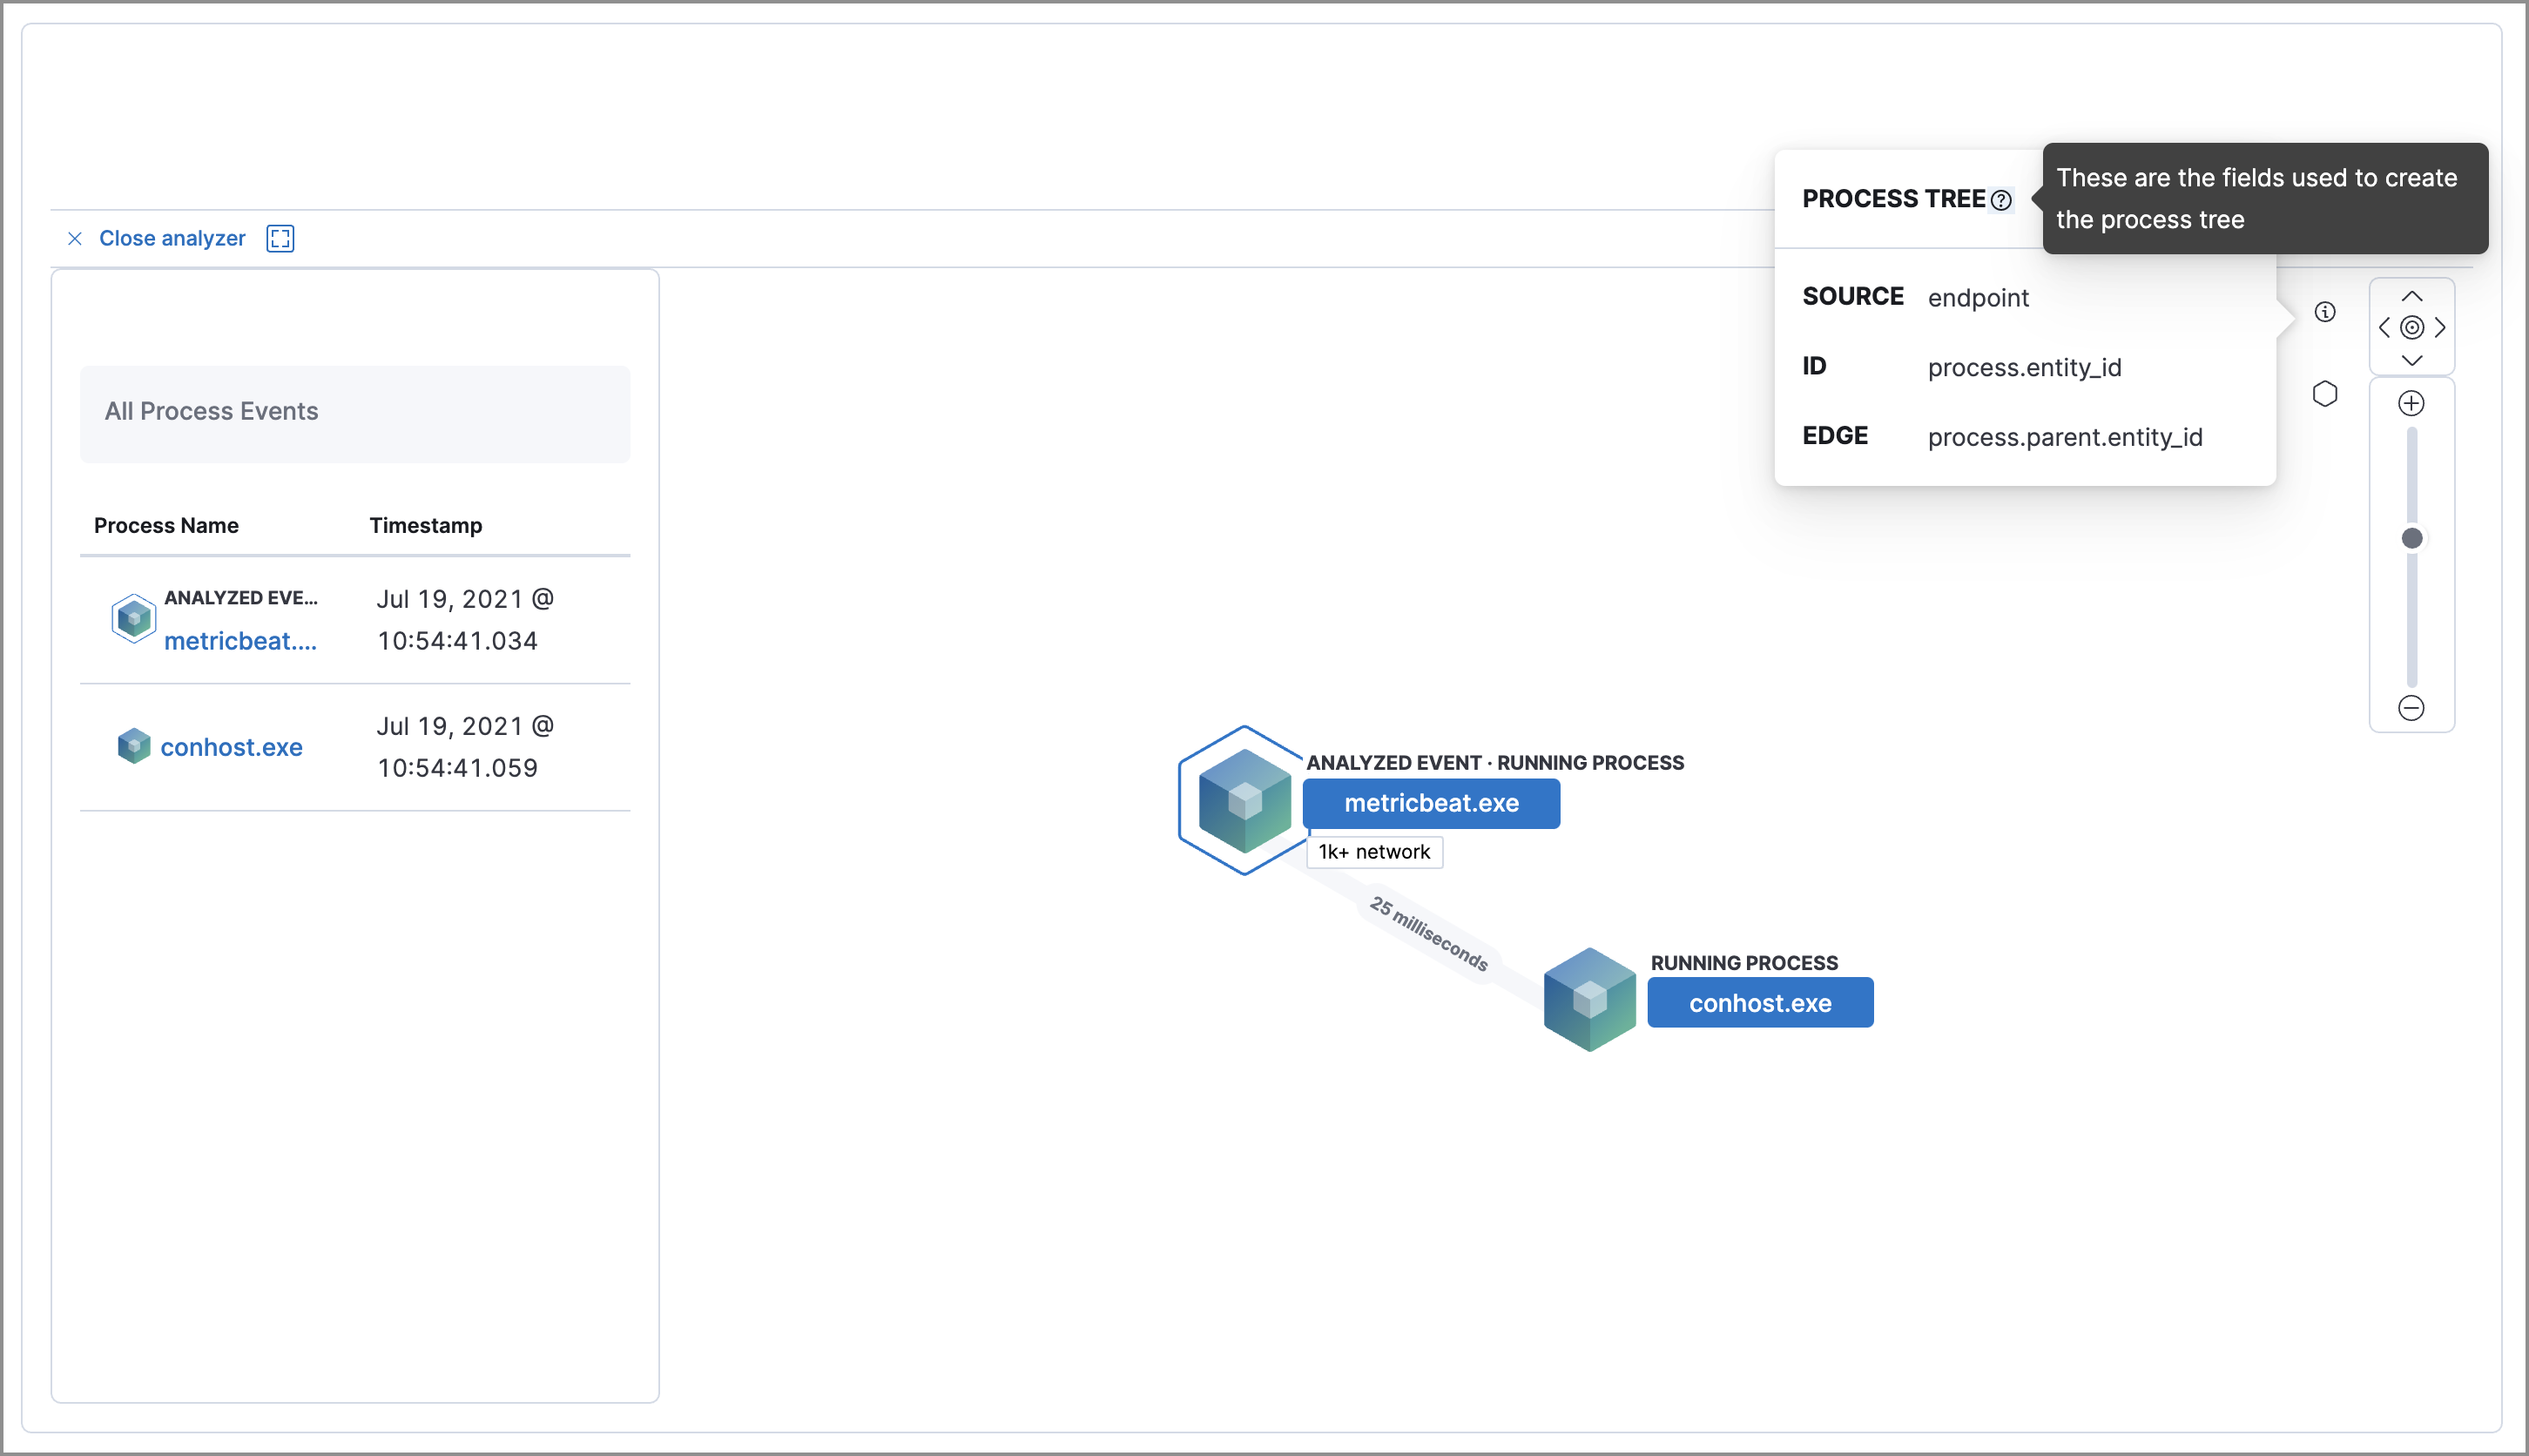
editWithin the visual analyzer, each cube represents a process, such as an executable file or network event. Click and drag in the analyzer to explore the hierarchy of all process relationships.
To understand what fields were used to create the process, select the Process Tree to view the schema that created the graphical view. The fields included are:
-
SOURCE: Can be eitherendpointorwinlogbeat -
ID: Event field that uniquely identifies a node -
EDGE: Event field which indicates the relationship between two nodes
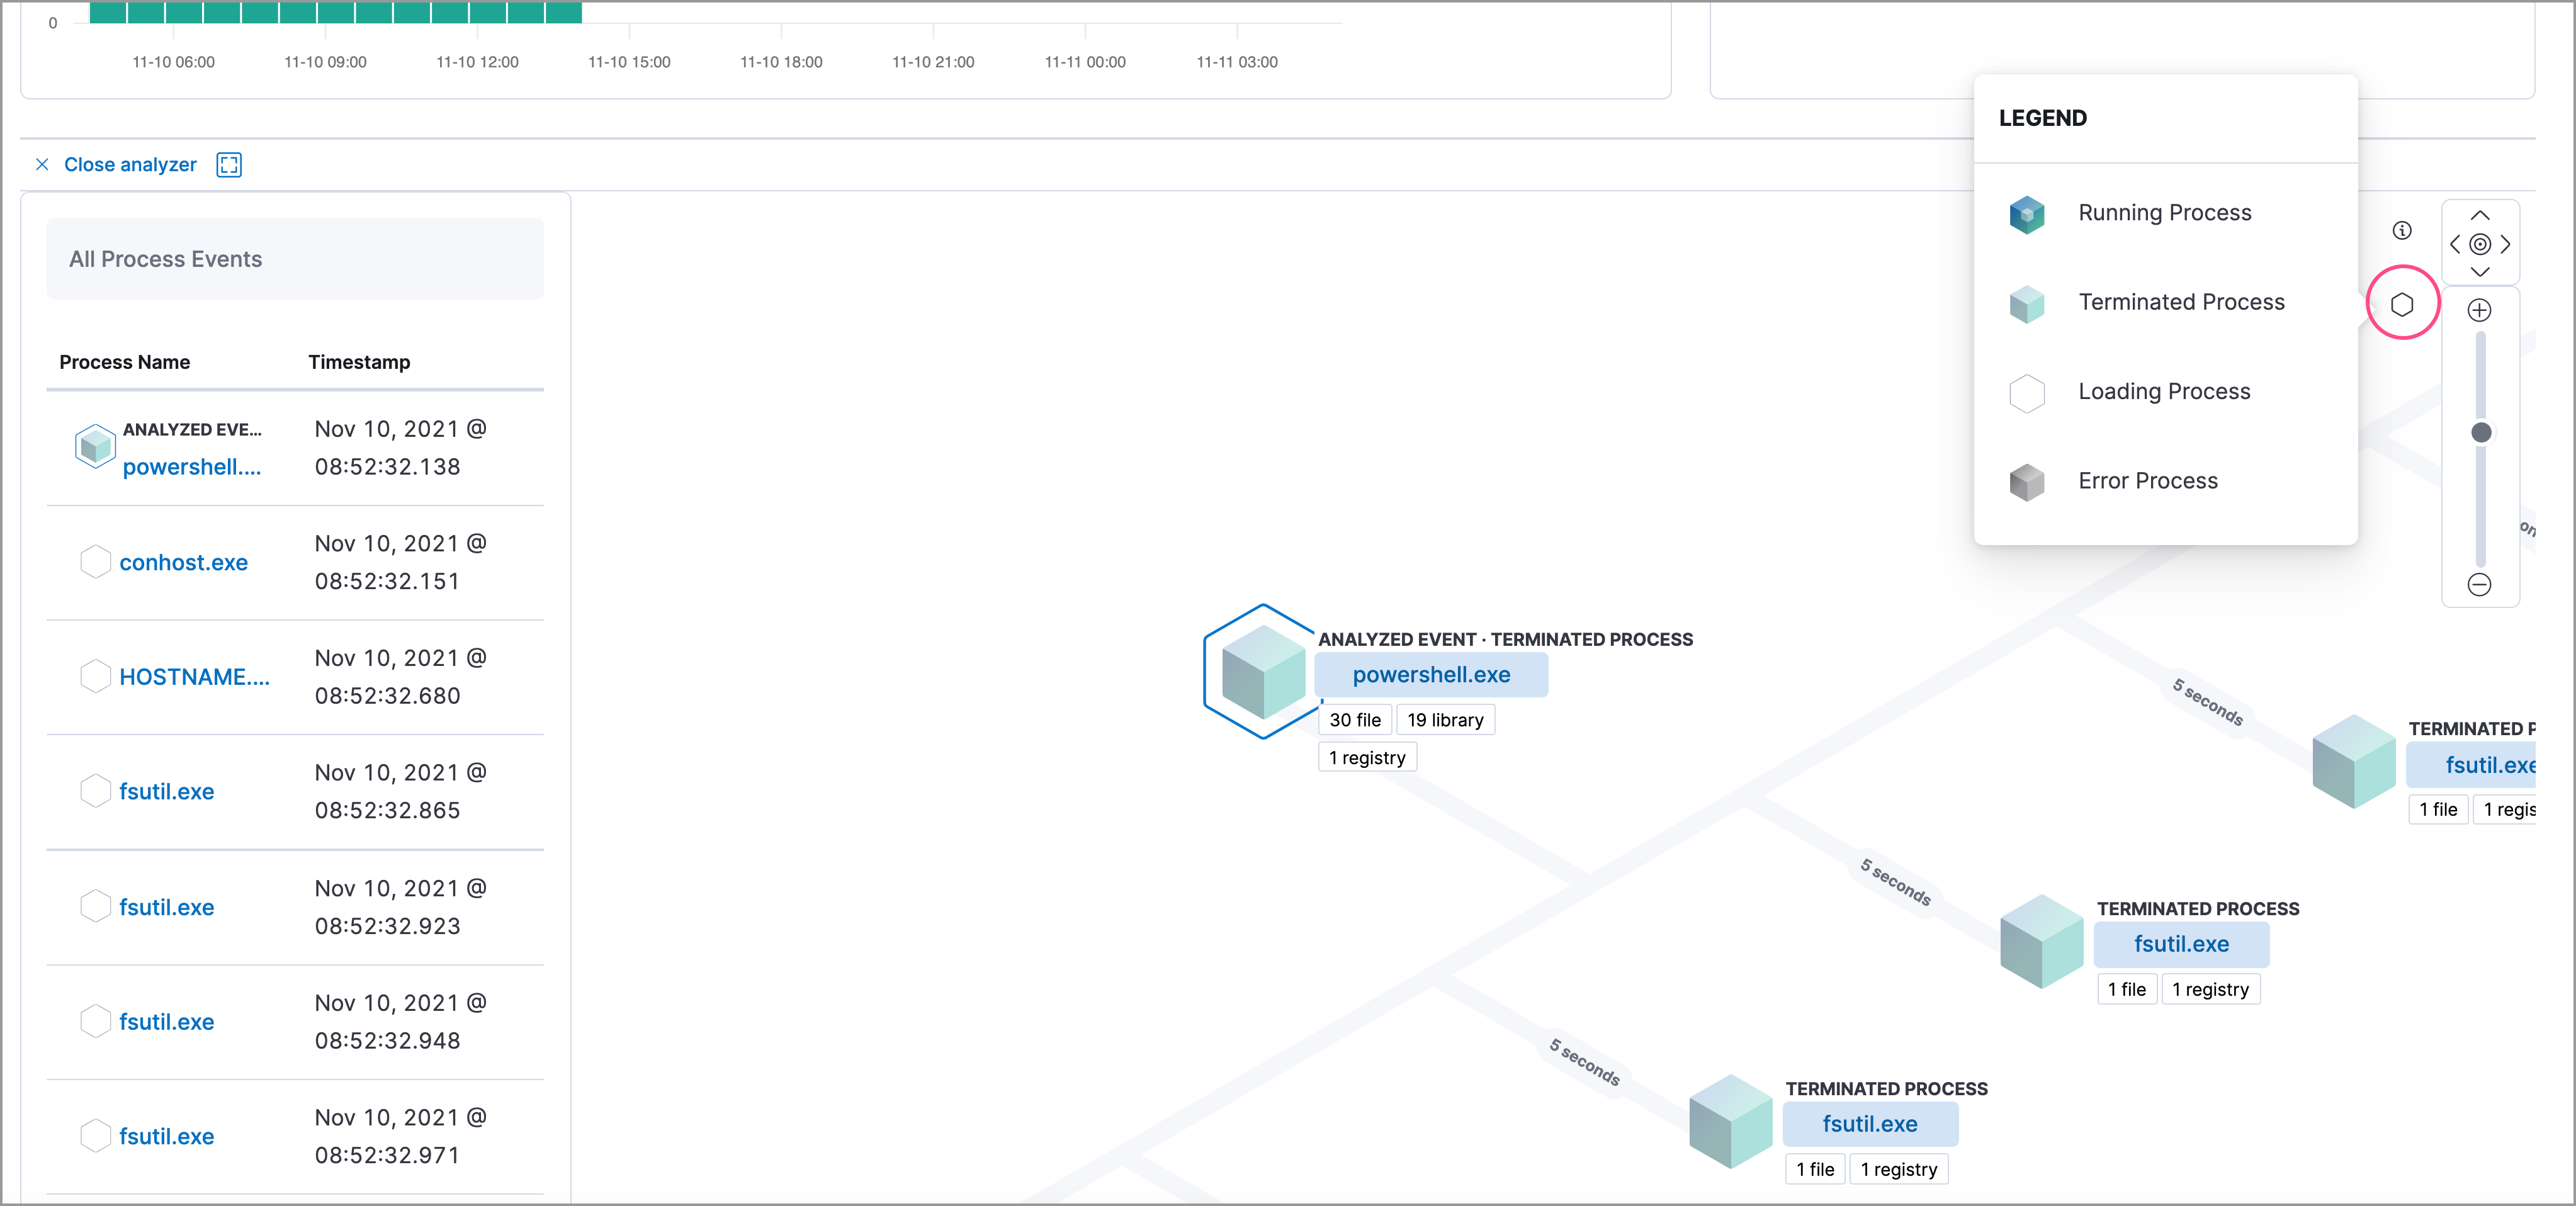
View the Legend to understand the state of each process node.
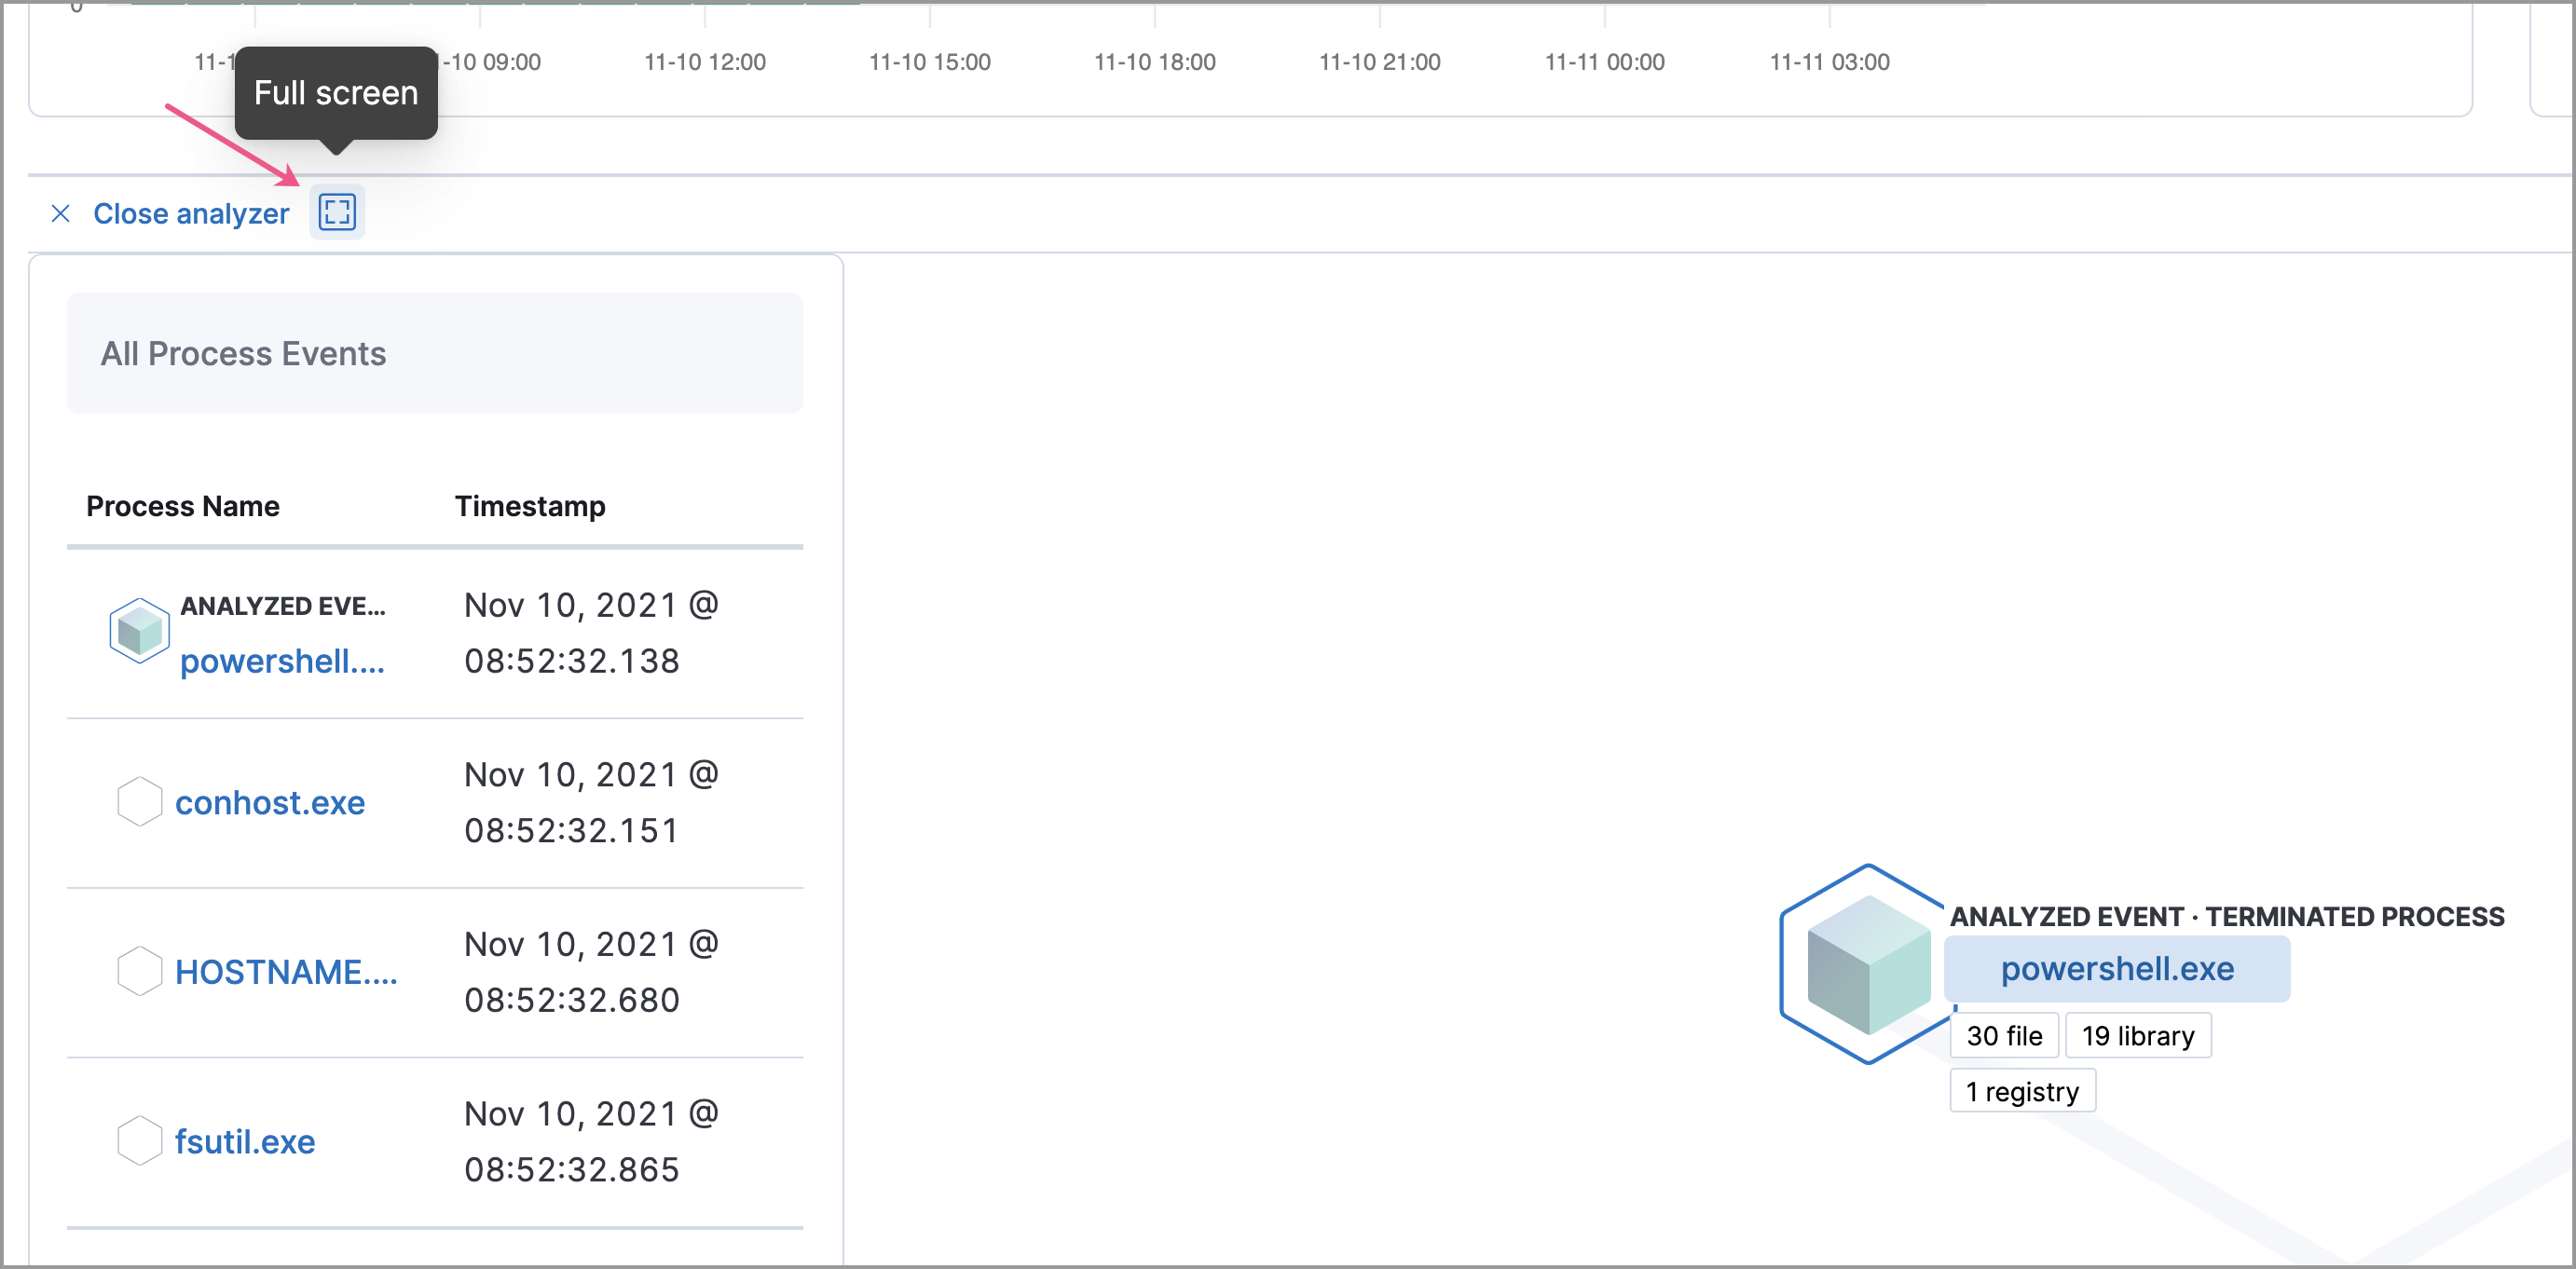
To expand the analyzer to a full screen, select the Full Screen icon above the left panel.
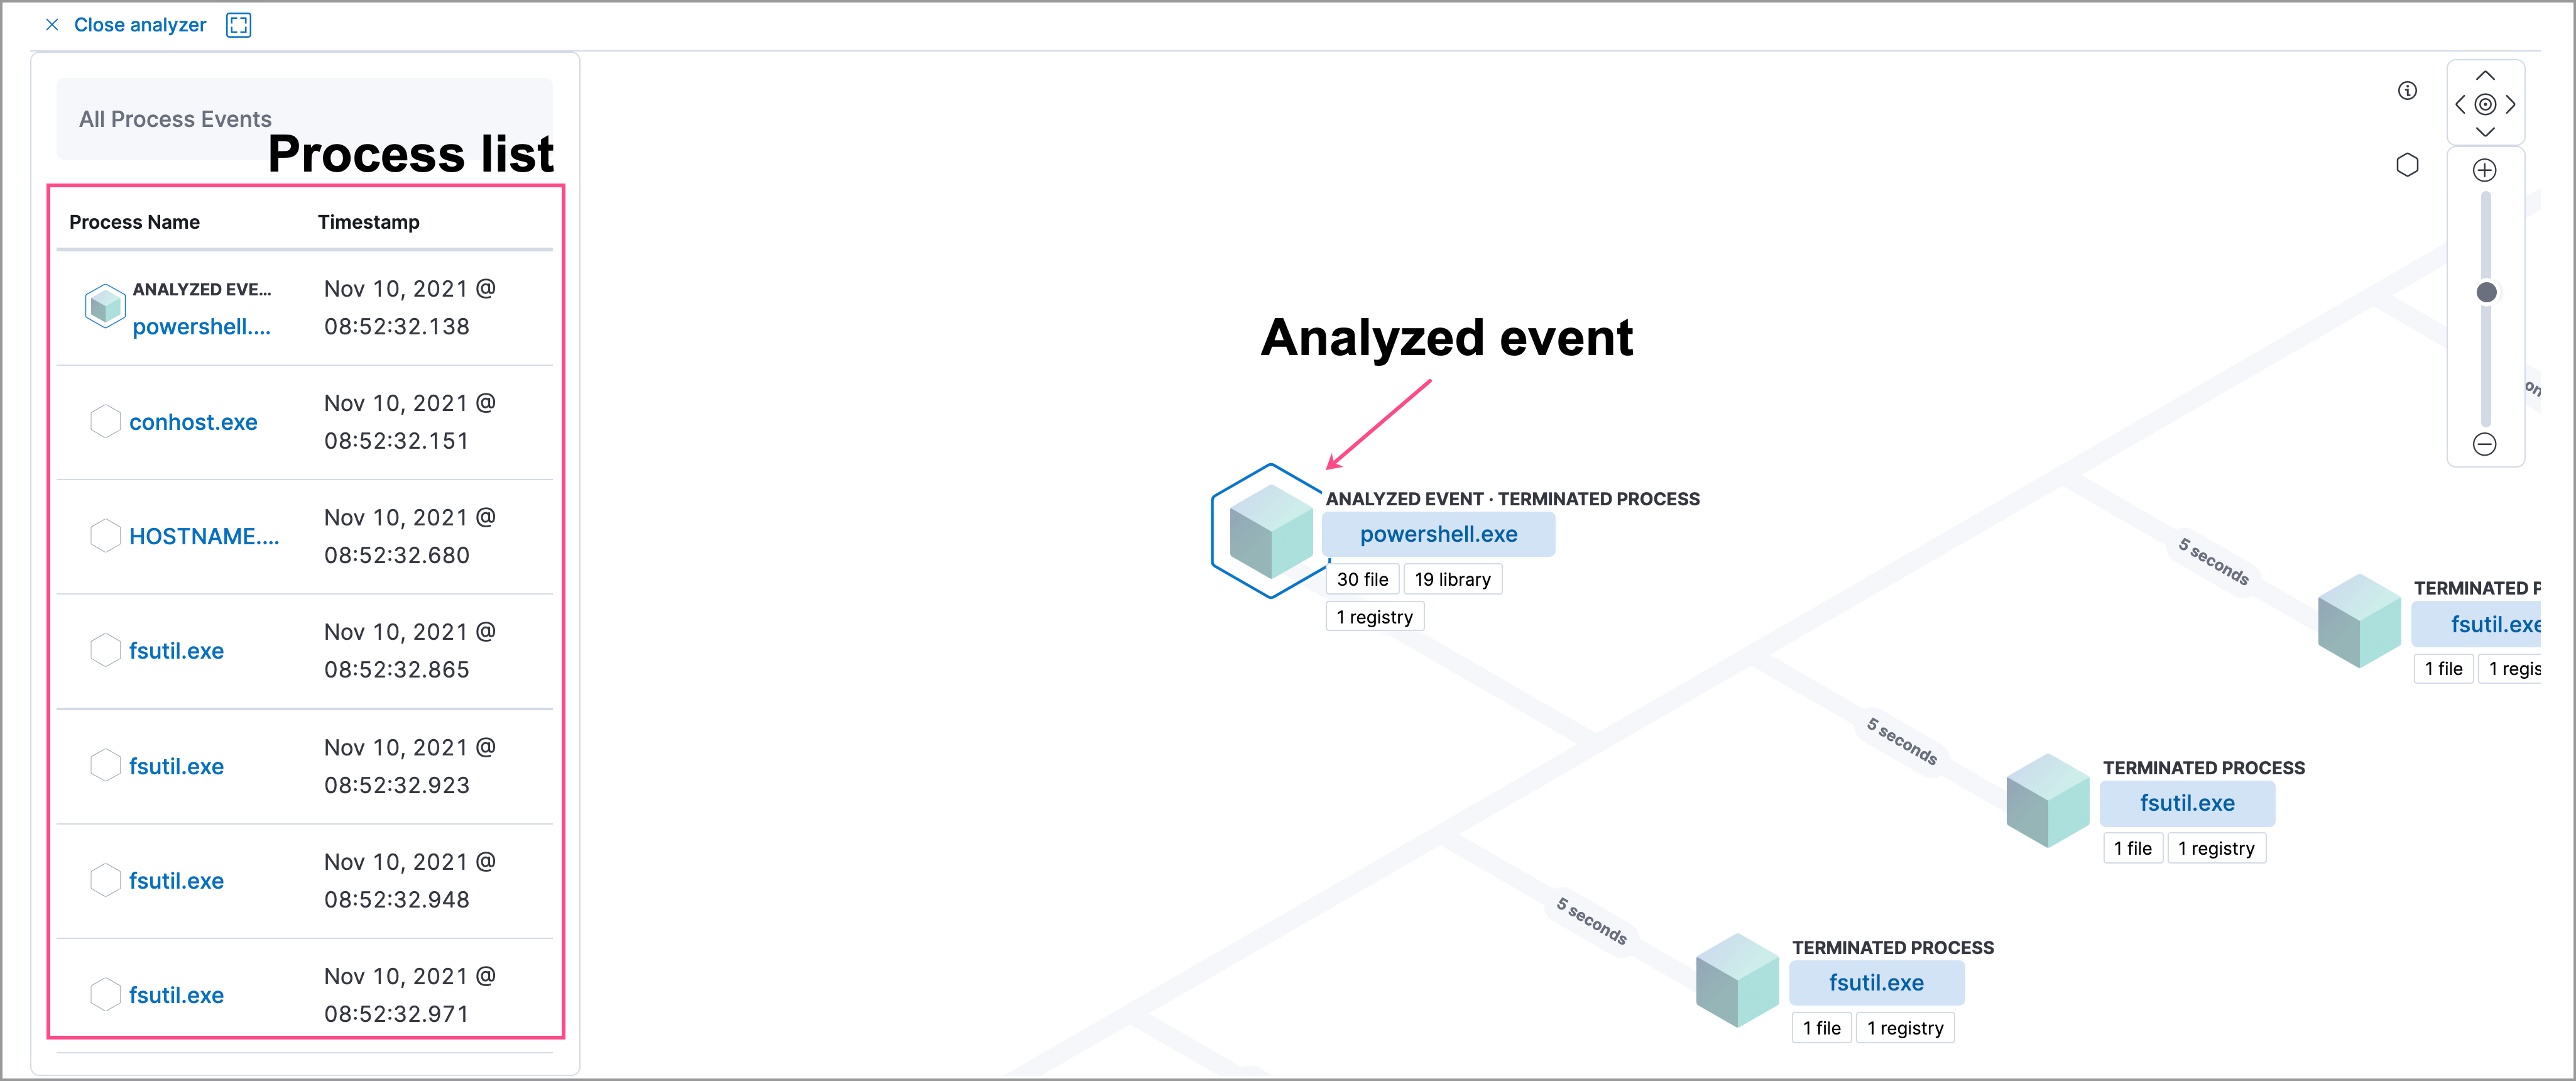
The left panel contains a list of all processes related to the event, starting with the event chain’s first process. Analyzed Events — the event you selected to analyze from the events list or Timeline — are highlighted with a light blue outline around the cube.
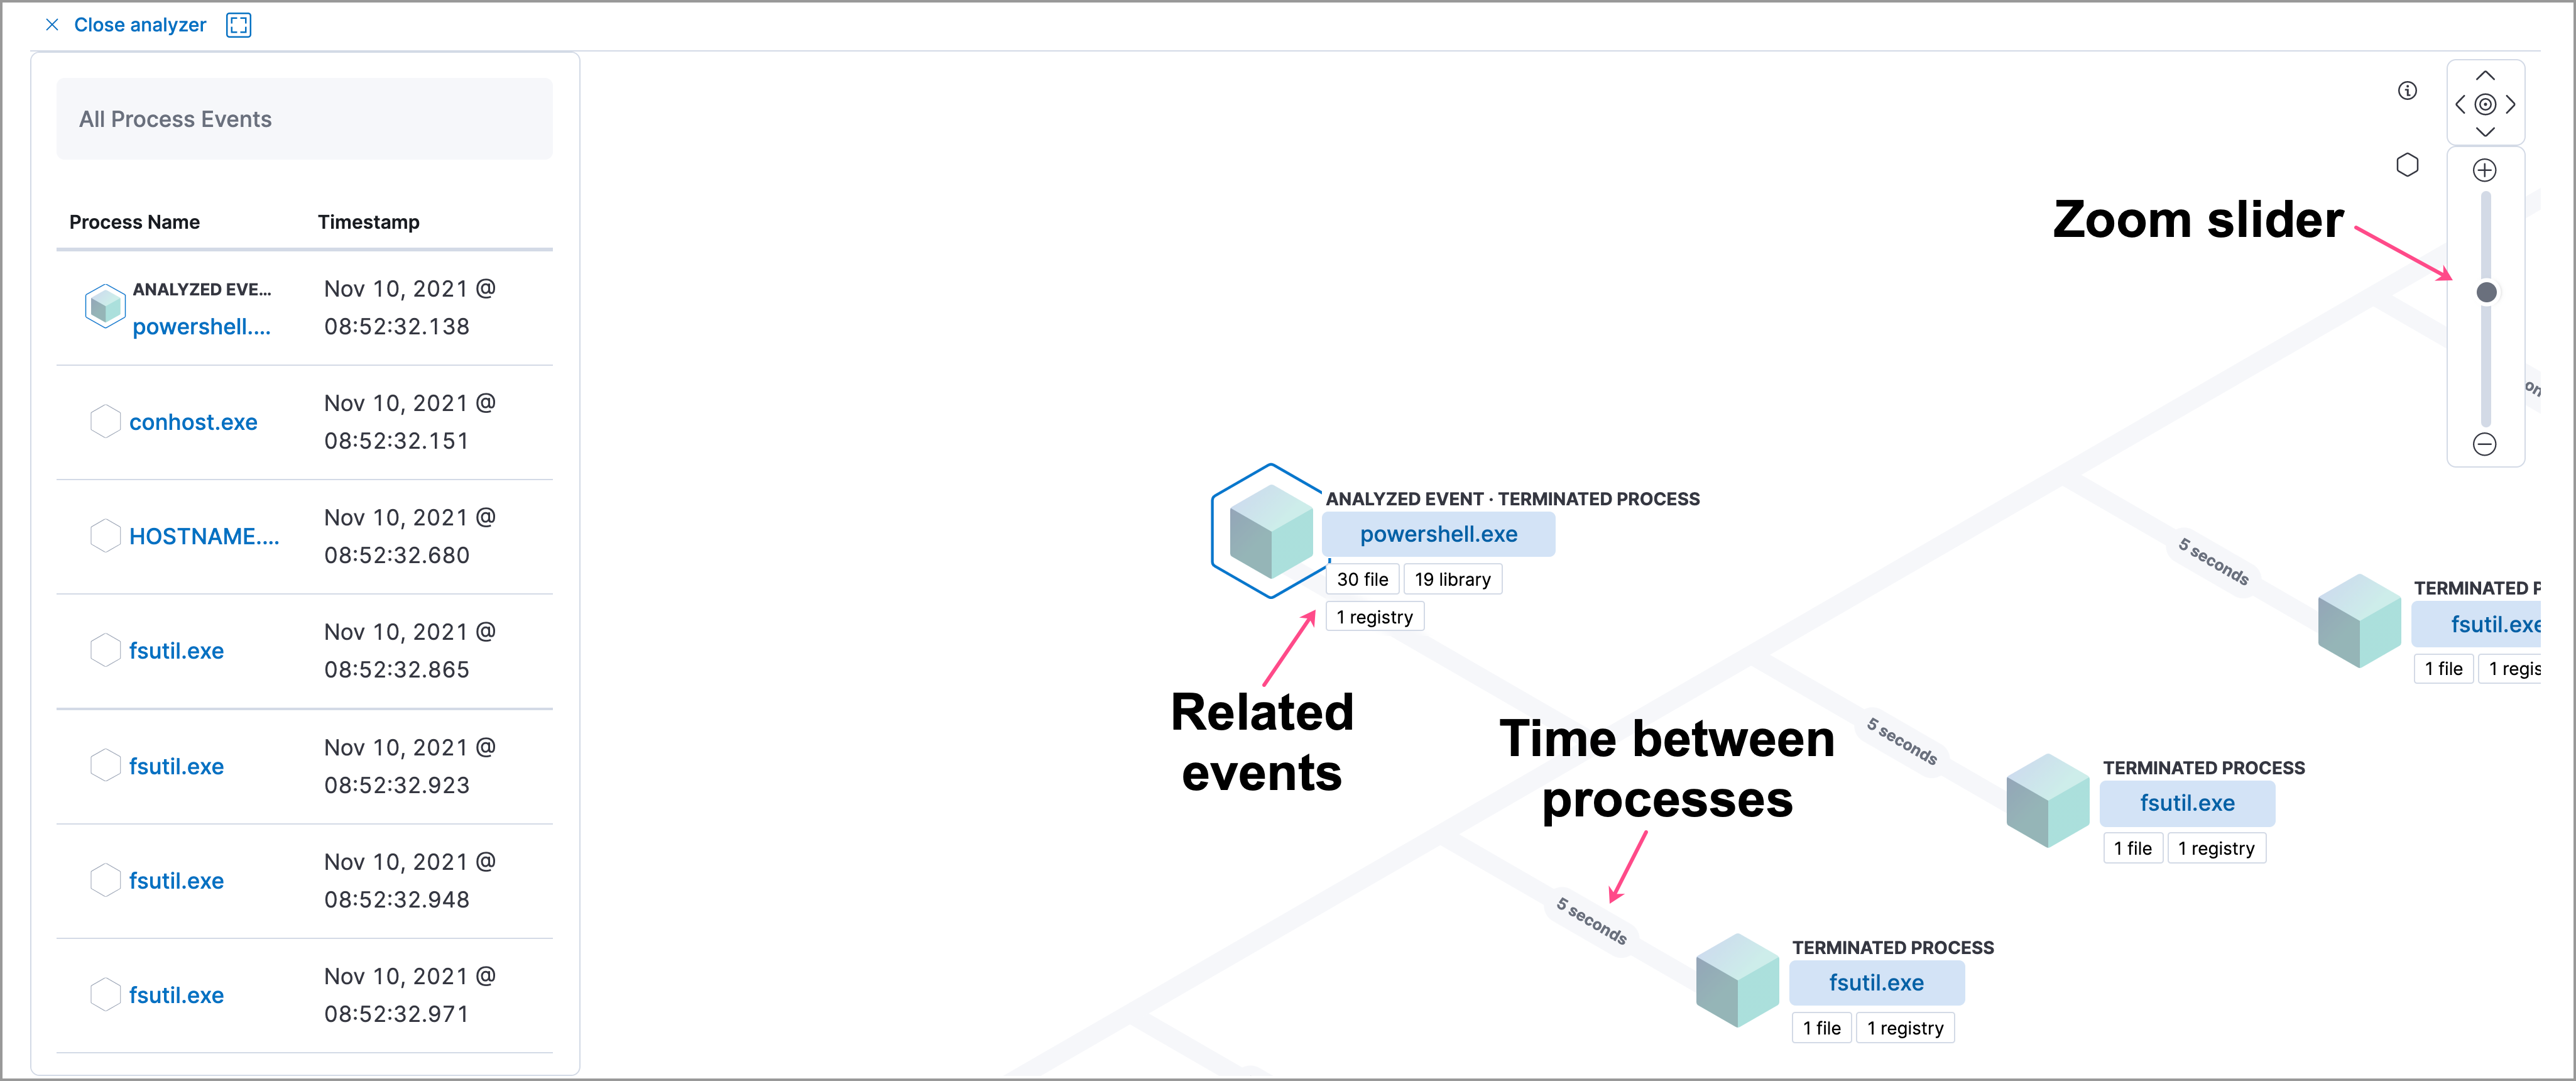
In the graphical view, you can:
- Zoom in and out of the graphical view using the slider on the far right
- Click and drag around the graphical view to more process relationships
- Observe child process events that spawned from the parent process
- Determine how much time passed between each process
- Identify all events related to each process
Process and event details
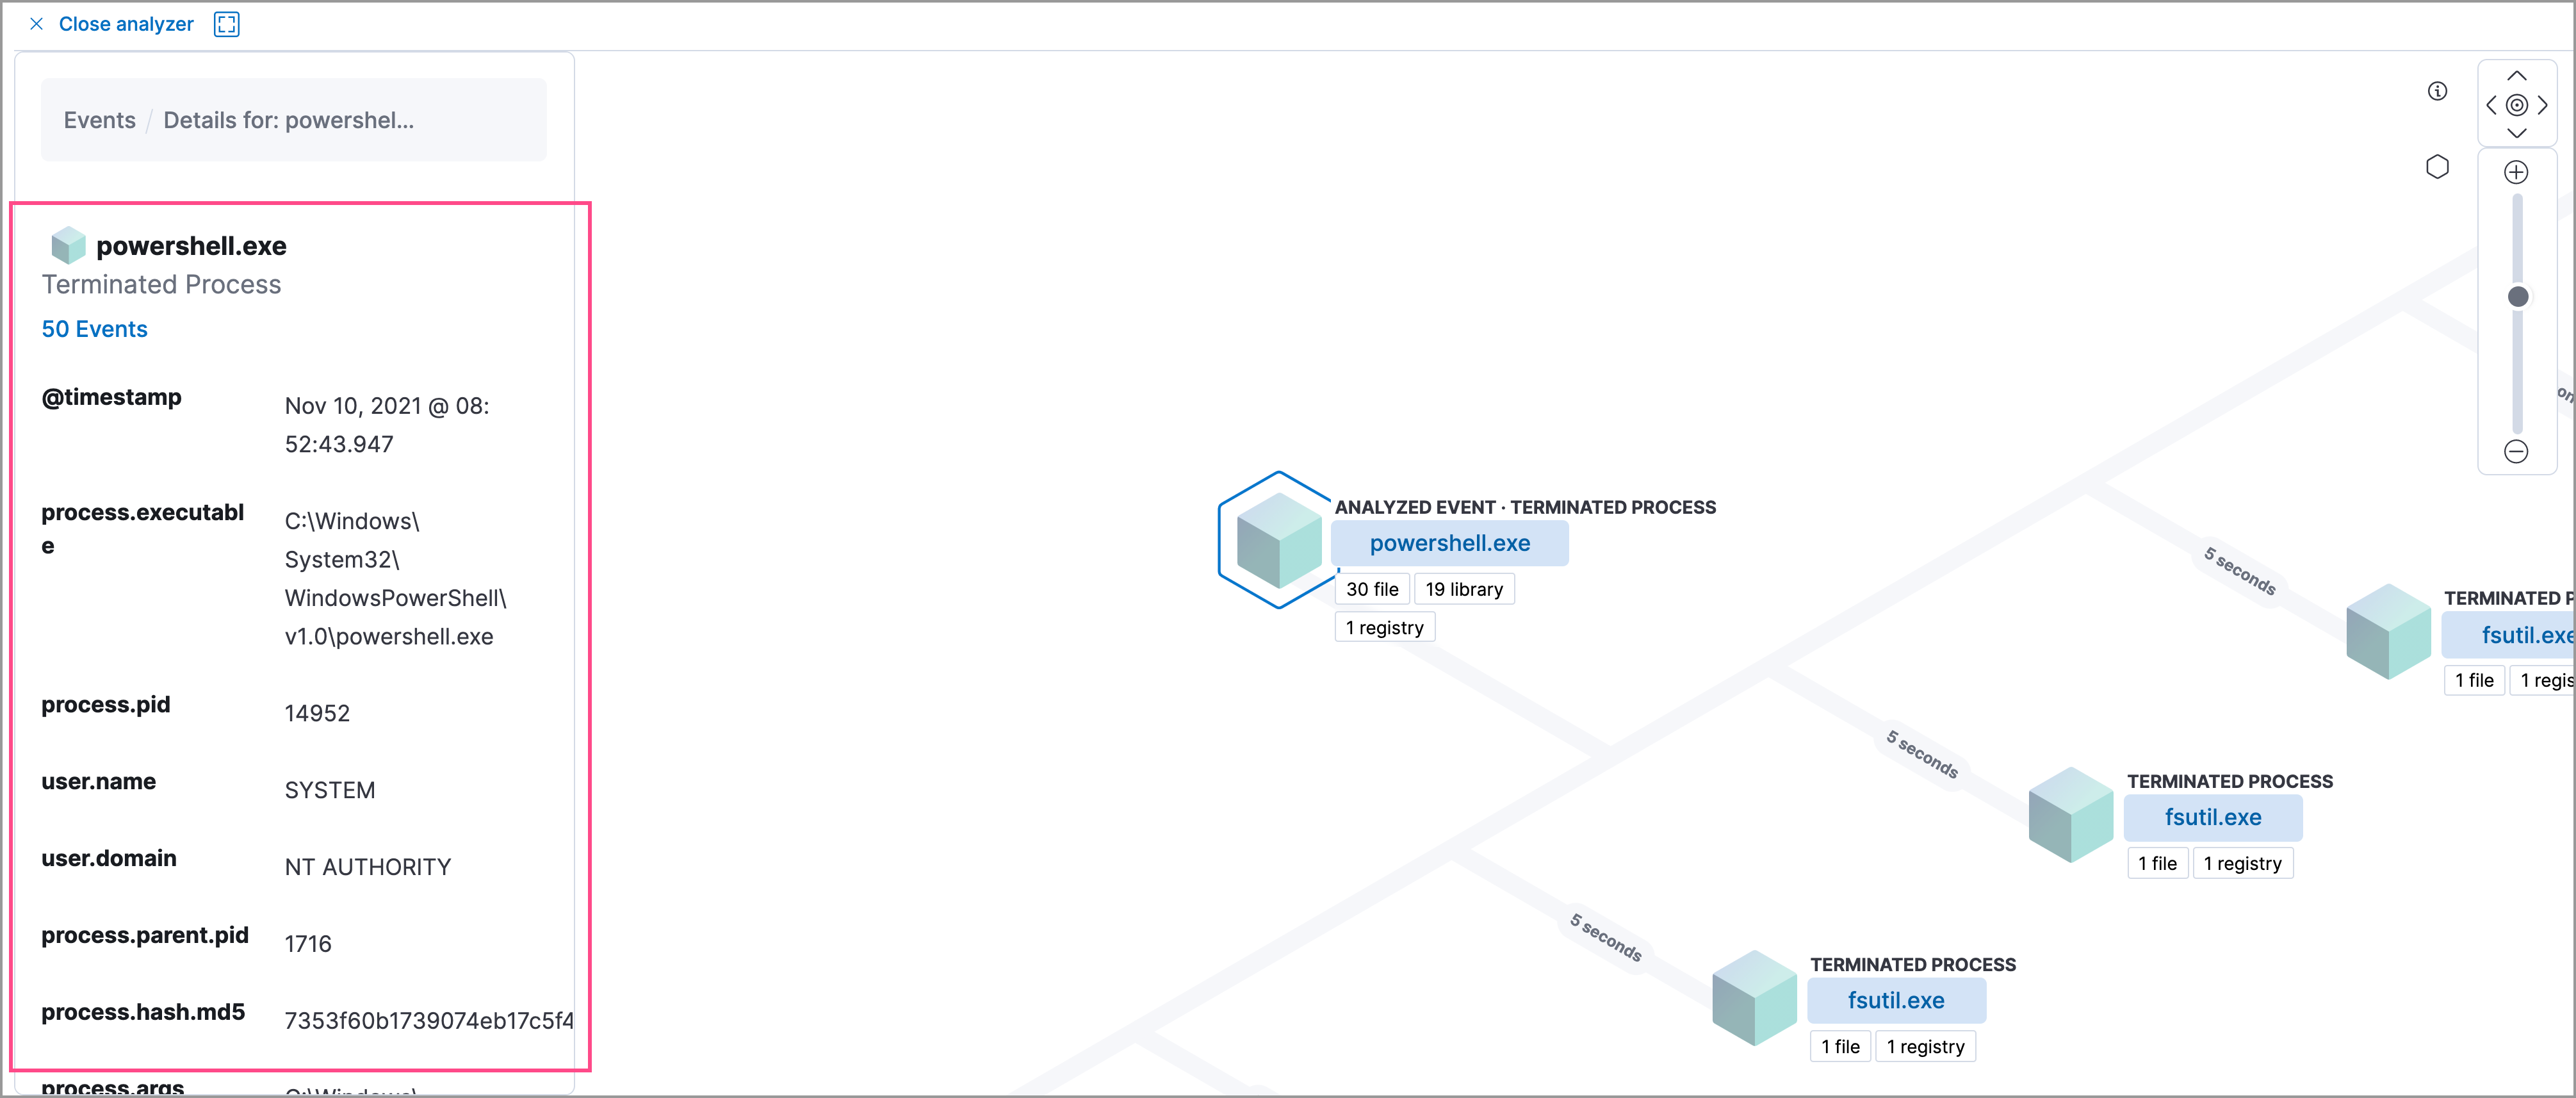
editTo learn more about each related process, select the process in the left panel or the graphical view. The left panel displays process details such as:
- The number of events associated with the process
- The timestamp of when the process was executed
- The file path of the process within the host
-
The
process-pid - The user name and domain that ran the process
- Any other relevant process information
When you first select a process, it appears in a loading state. If loading data for a given process fails, click Reload {process-name} beneath the process to reload the data.
Access event details by selecting that event’s URL at the top of the process details view or choosing one of the event pills in the graphical view.
Events are categorized based on the event.category value.
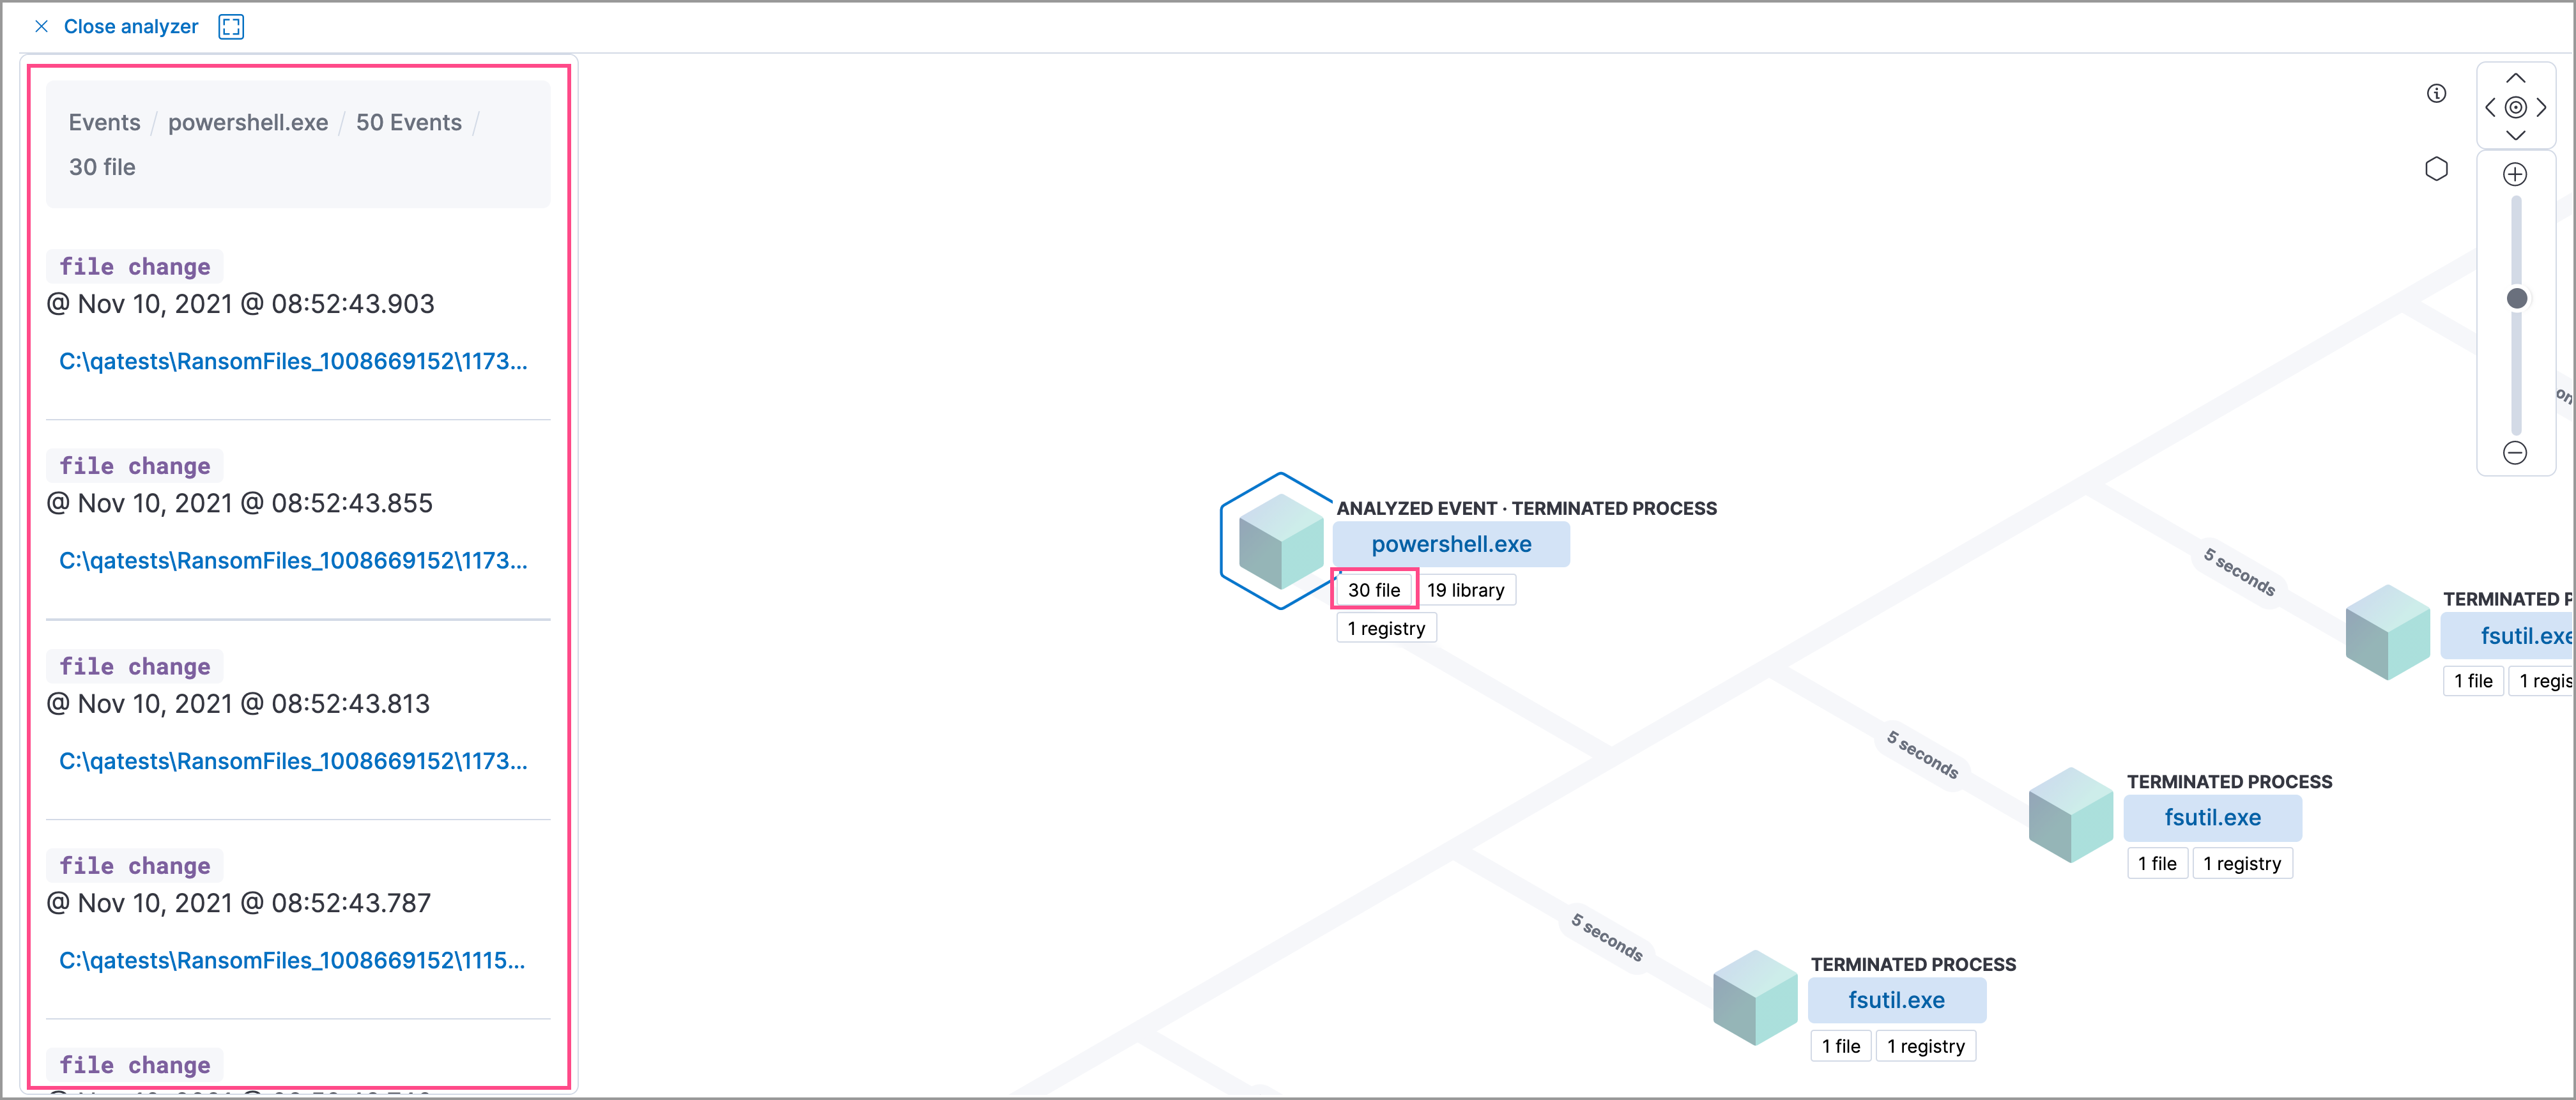
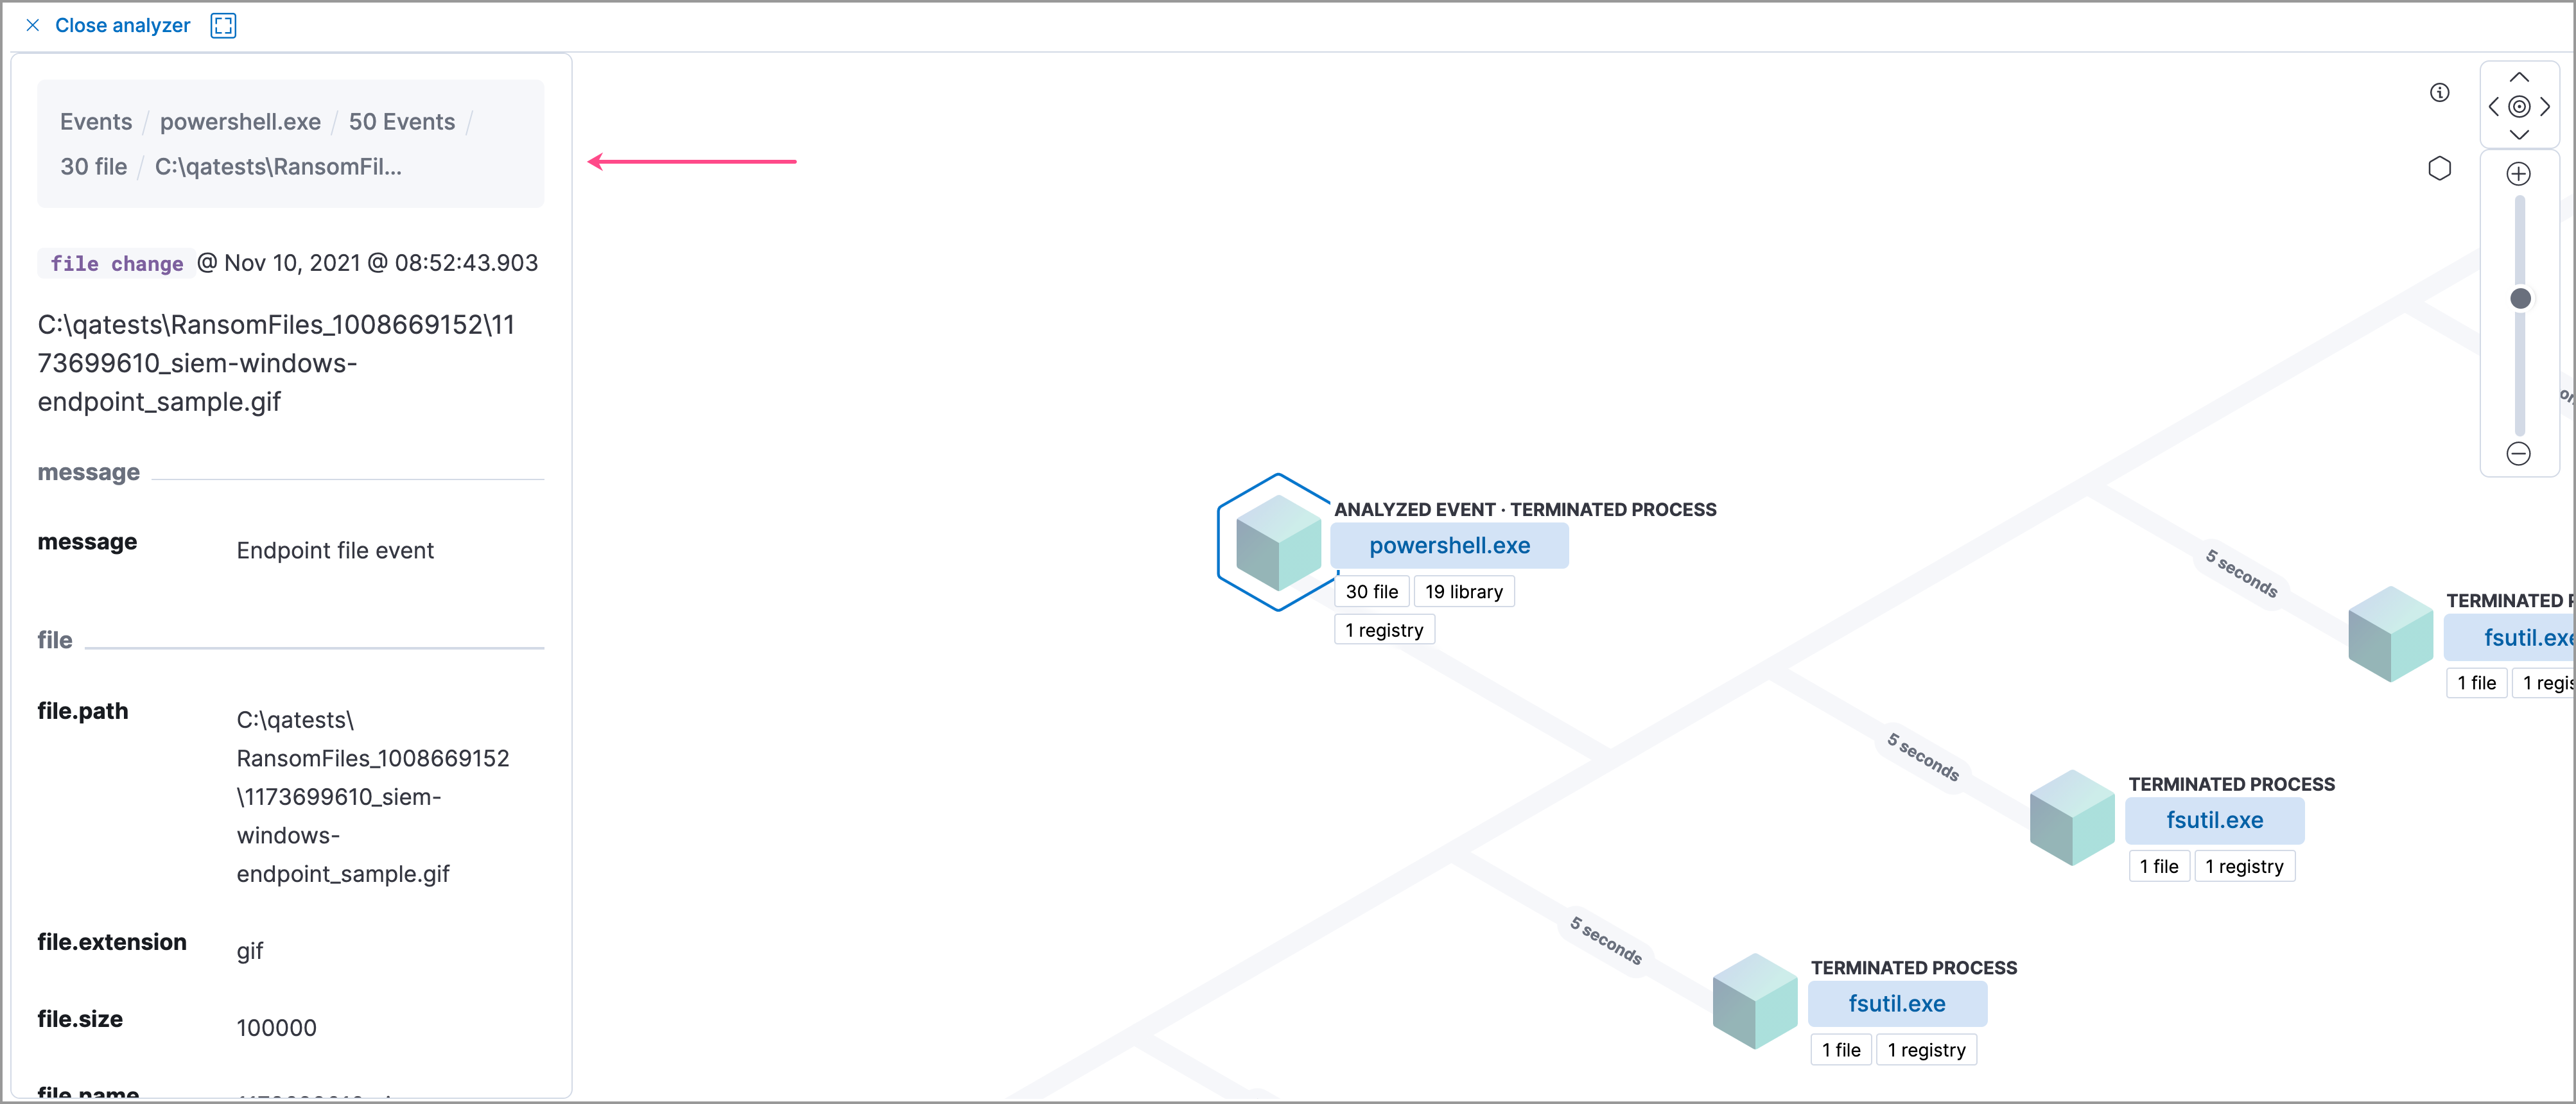
When you select an event.category pill, all the events within that category are listed in the left panel. To view more details about a specific event, select it from the list.
In Elastic Stack versions 7.10.0 and newer, there is no limit to the number of events that can be associated with a process. However, in Elastic Stack versions 7.9.0 and earlier, each process is limited to only 100 events.