Manage detection alerts
editManage detection alerts
editThe Alerts page displays all detection alerts. From the Alerts table, you can filter alerts, change an alert’s status, and start investigating and analyzing alerts in Timeline.
From Timelines, you can create cases to track issues and share information with colleagues.
View and filter detection alerts
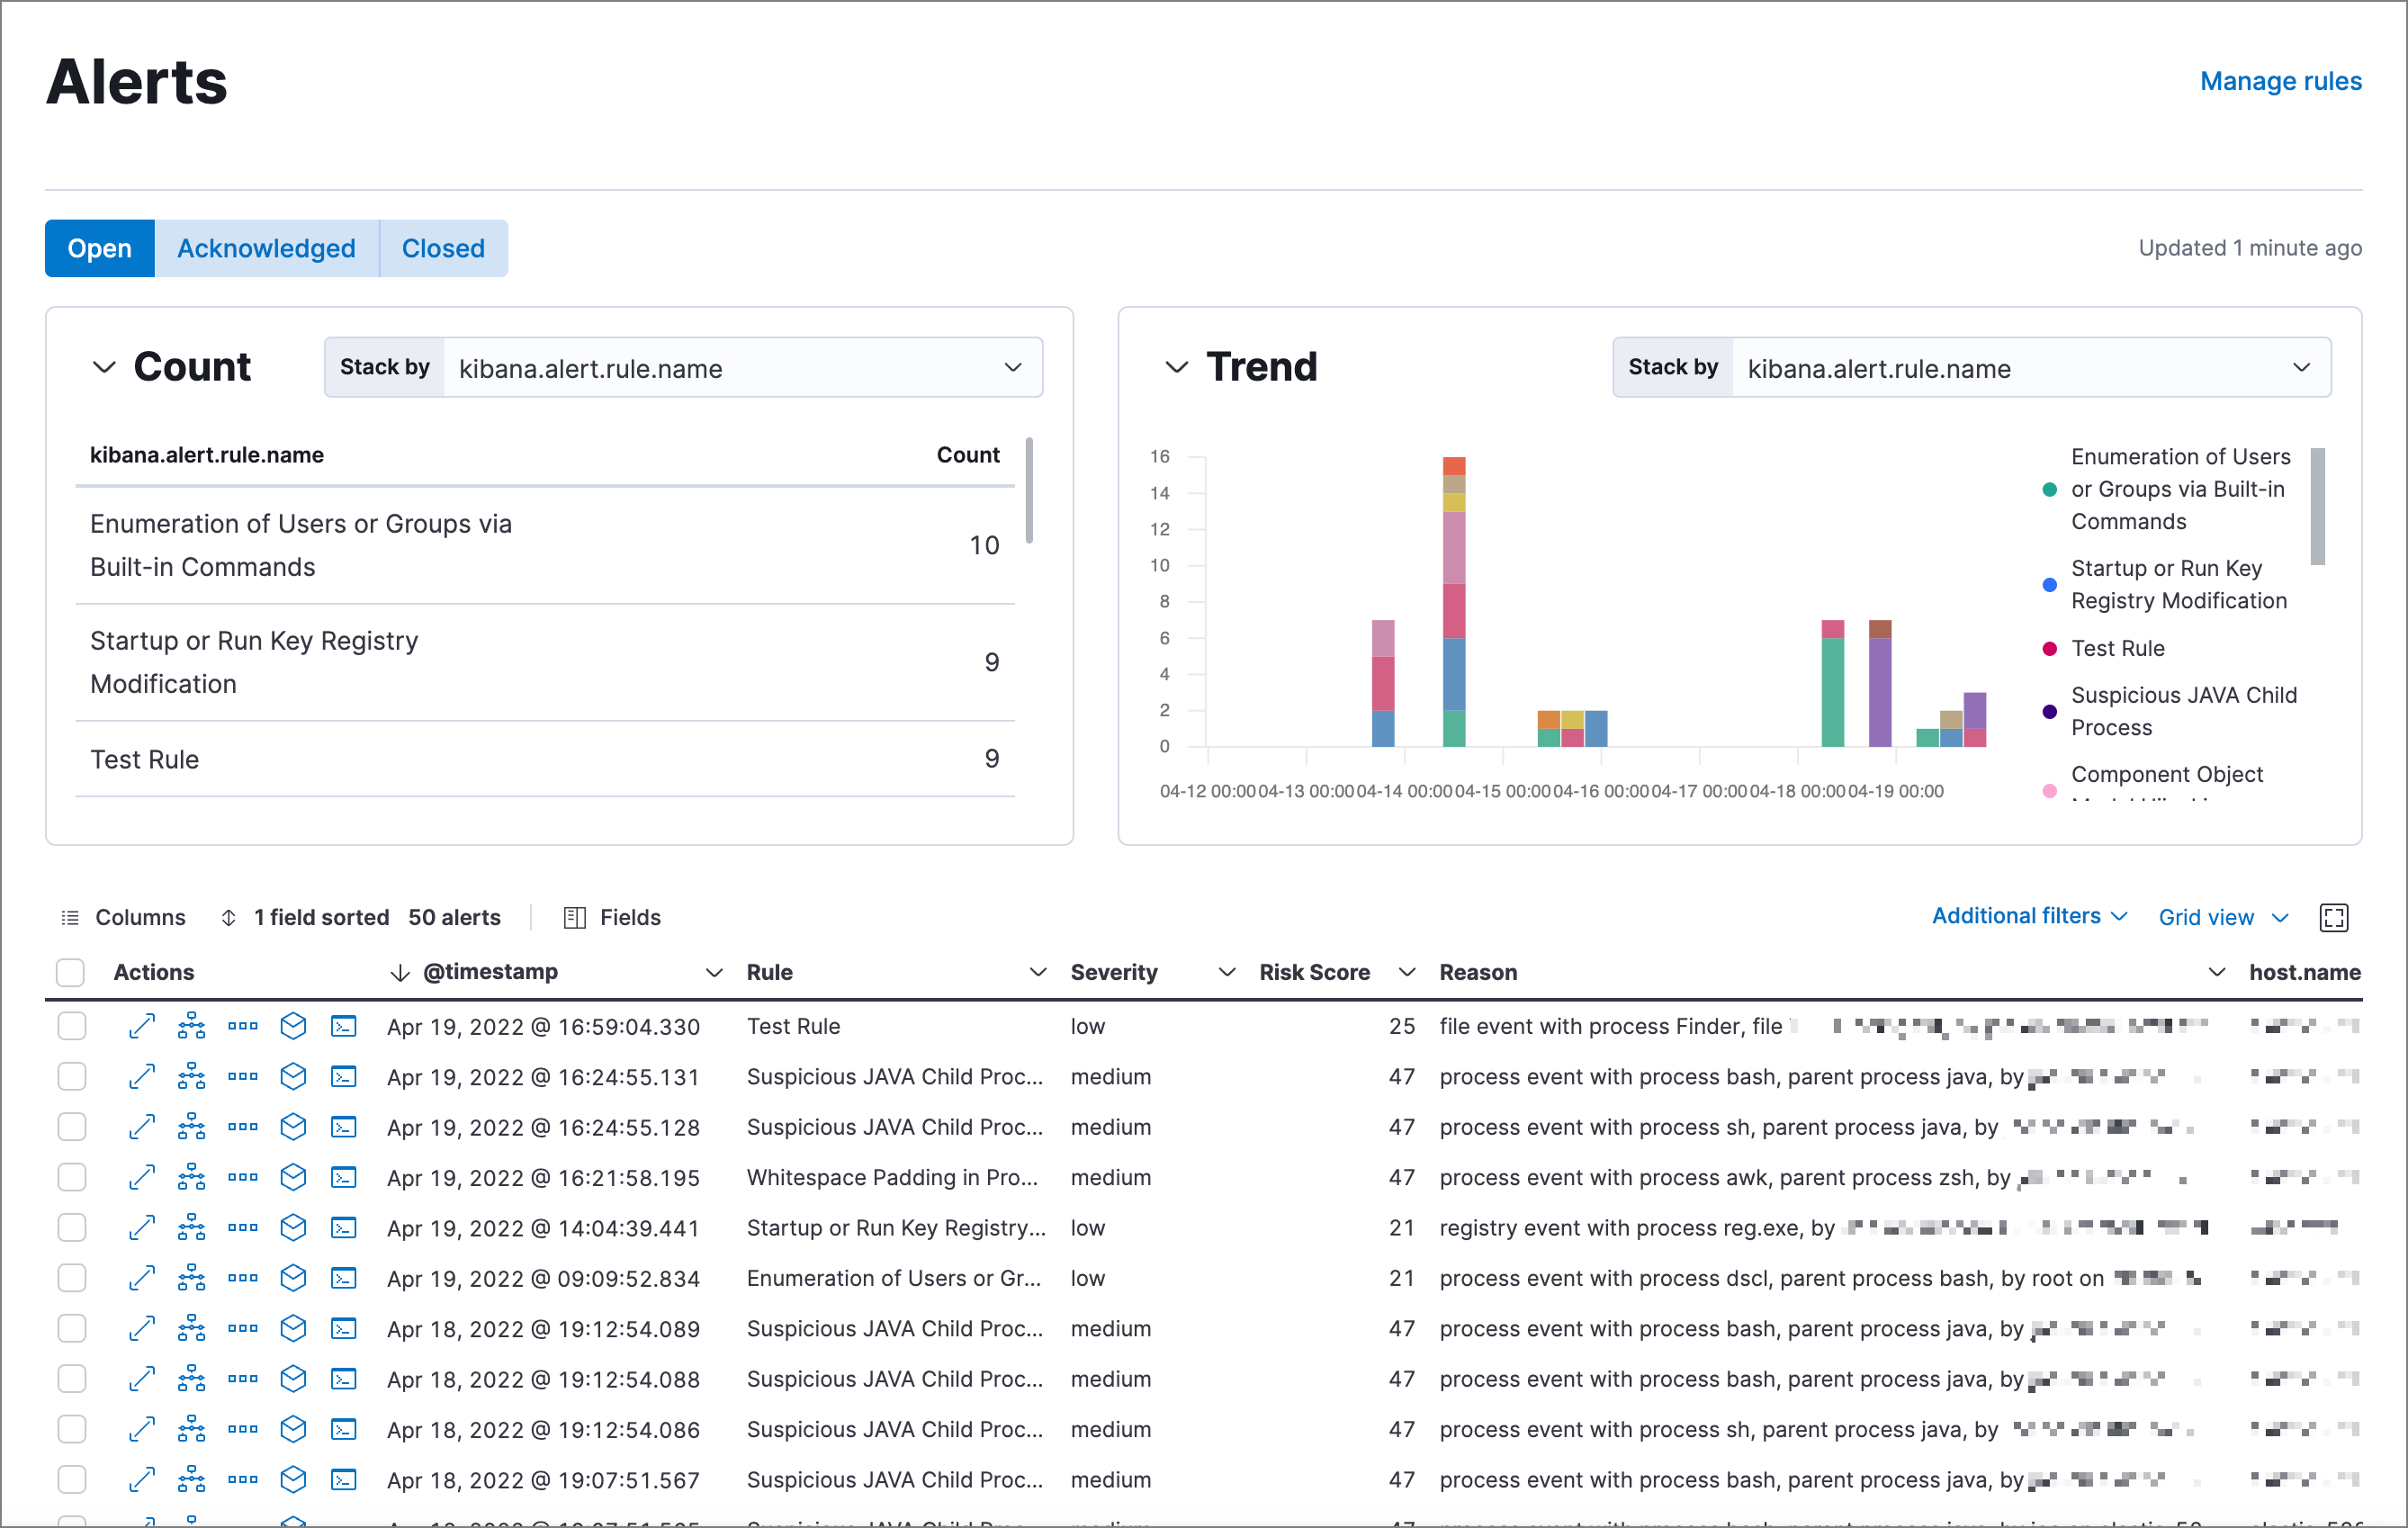
editThe Alerts page offers various ways for you to organize and triage detection alerts as you investigate suspicious events. You can:
-
Filter for a specific rule in the KQL bar (for example,
kibana.alert.rule.name :"SSH (Secure Shell) from the Internet").KQL autocomplete for
.alerts-security.alerts-*indices is available on the Alerts and Rule details pages, and in Timeline when eitherAllorDetection alertsis selected. -
Use the date and time filter to define a specific time range. By default, this filter is set to search the last 24 hours.
Use the Quick select menu to choose commonly or frequently used options.
- View detection alerts generated by a specific rule. Go to Detect → Rules, then select a rule name in the table. The rule details page displays a comprehensive view of the rule’s settings, and the Alerts table under the Trend histogram displays the alerts associated with the rule, including alerts from any previous or deleted revision of that rule.
-
Group alerts by specific parameters and display individual alert counts by using the Stack by drop-down in the Count table. You can select or enter any aggregatable ECS field that is available on your alerts. For example, if you select
kibana.alert.rule.name, the table displays the number of alerts grouped by that field.The Count table resets to its default state if you navigate away from the Alerts page.
-
Visualize alerts by specific parameters by using the Stack by drop-down in the Trend histogram. You can select or enter any aggregatable ECS field that is available on your alerts. For example, if you select
kibana.alert.rule.name, the histogram displays the total alert counts for each rule name.The Trend table resets to its default state if you navigate away from the Alerts page.
-
Hover over a value in the data grid to display available inline actions, such as Filter In, Filter Out, and Add to timeline investigation. Click the expand button to open a full context menu of options, including Show top values, Copy to Clipboard, and View rule details. The available options vary depending on the type of data.
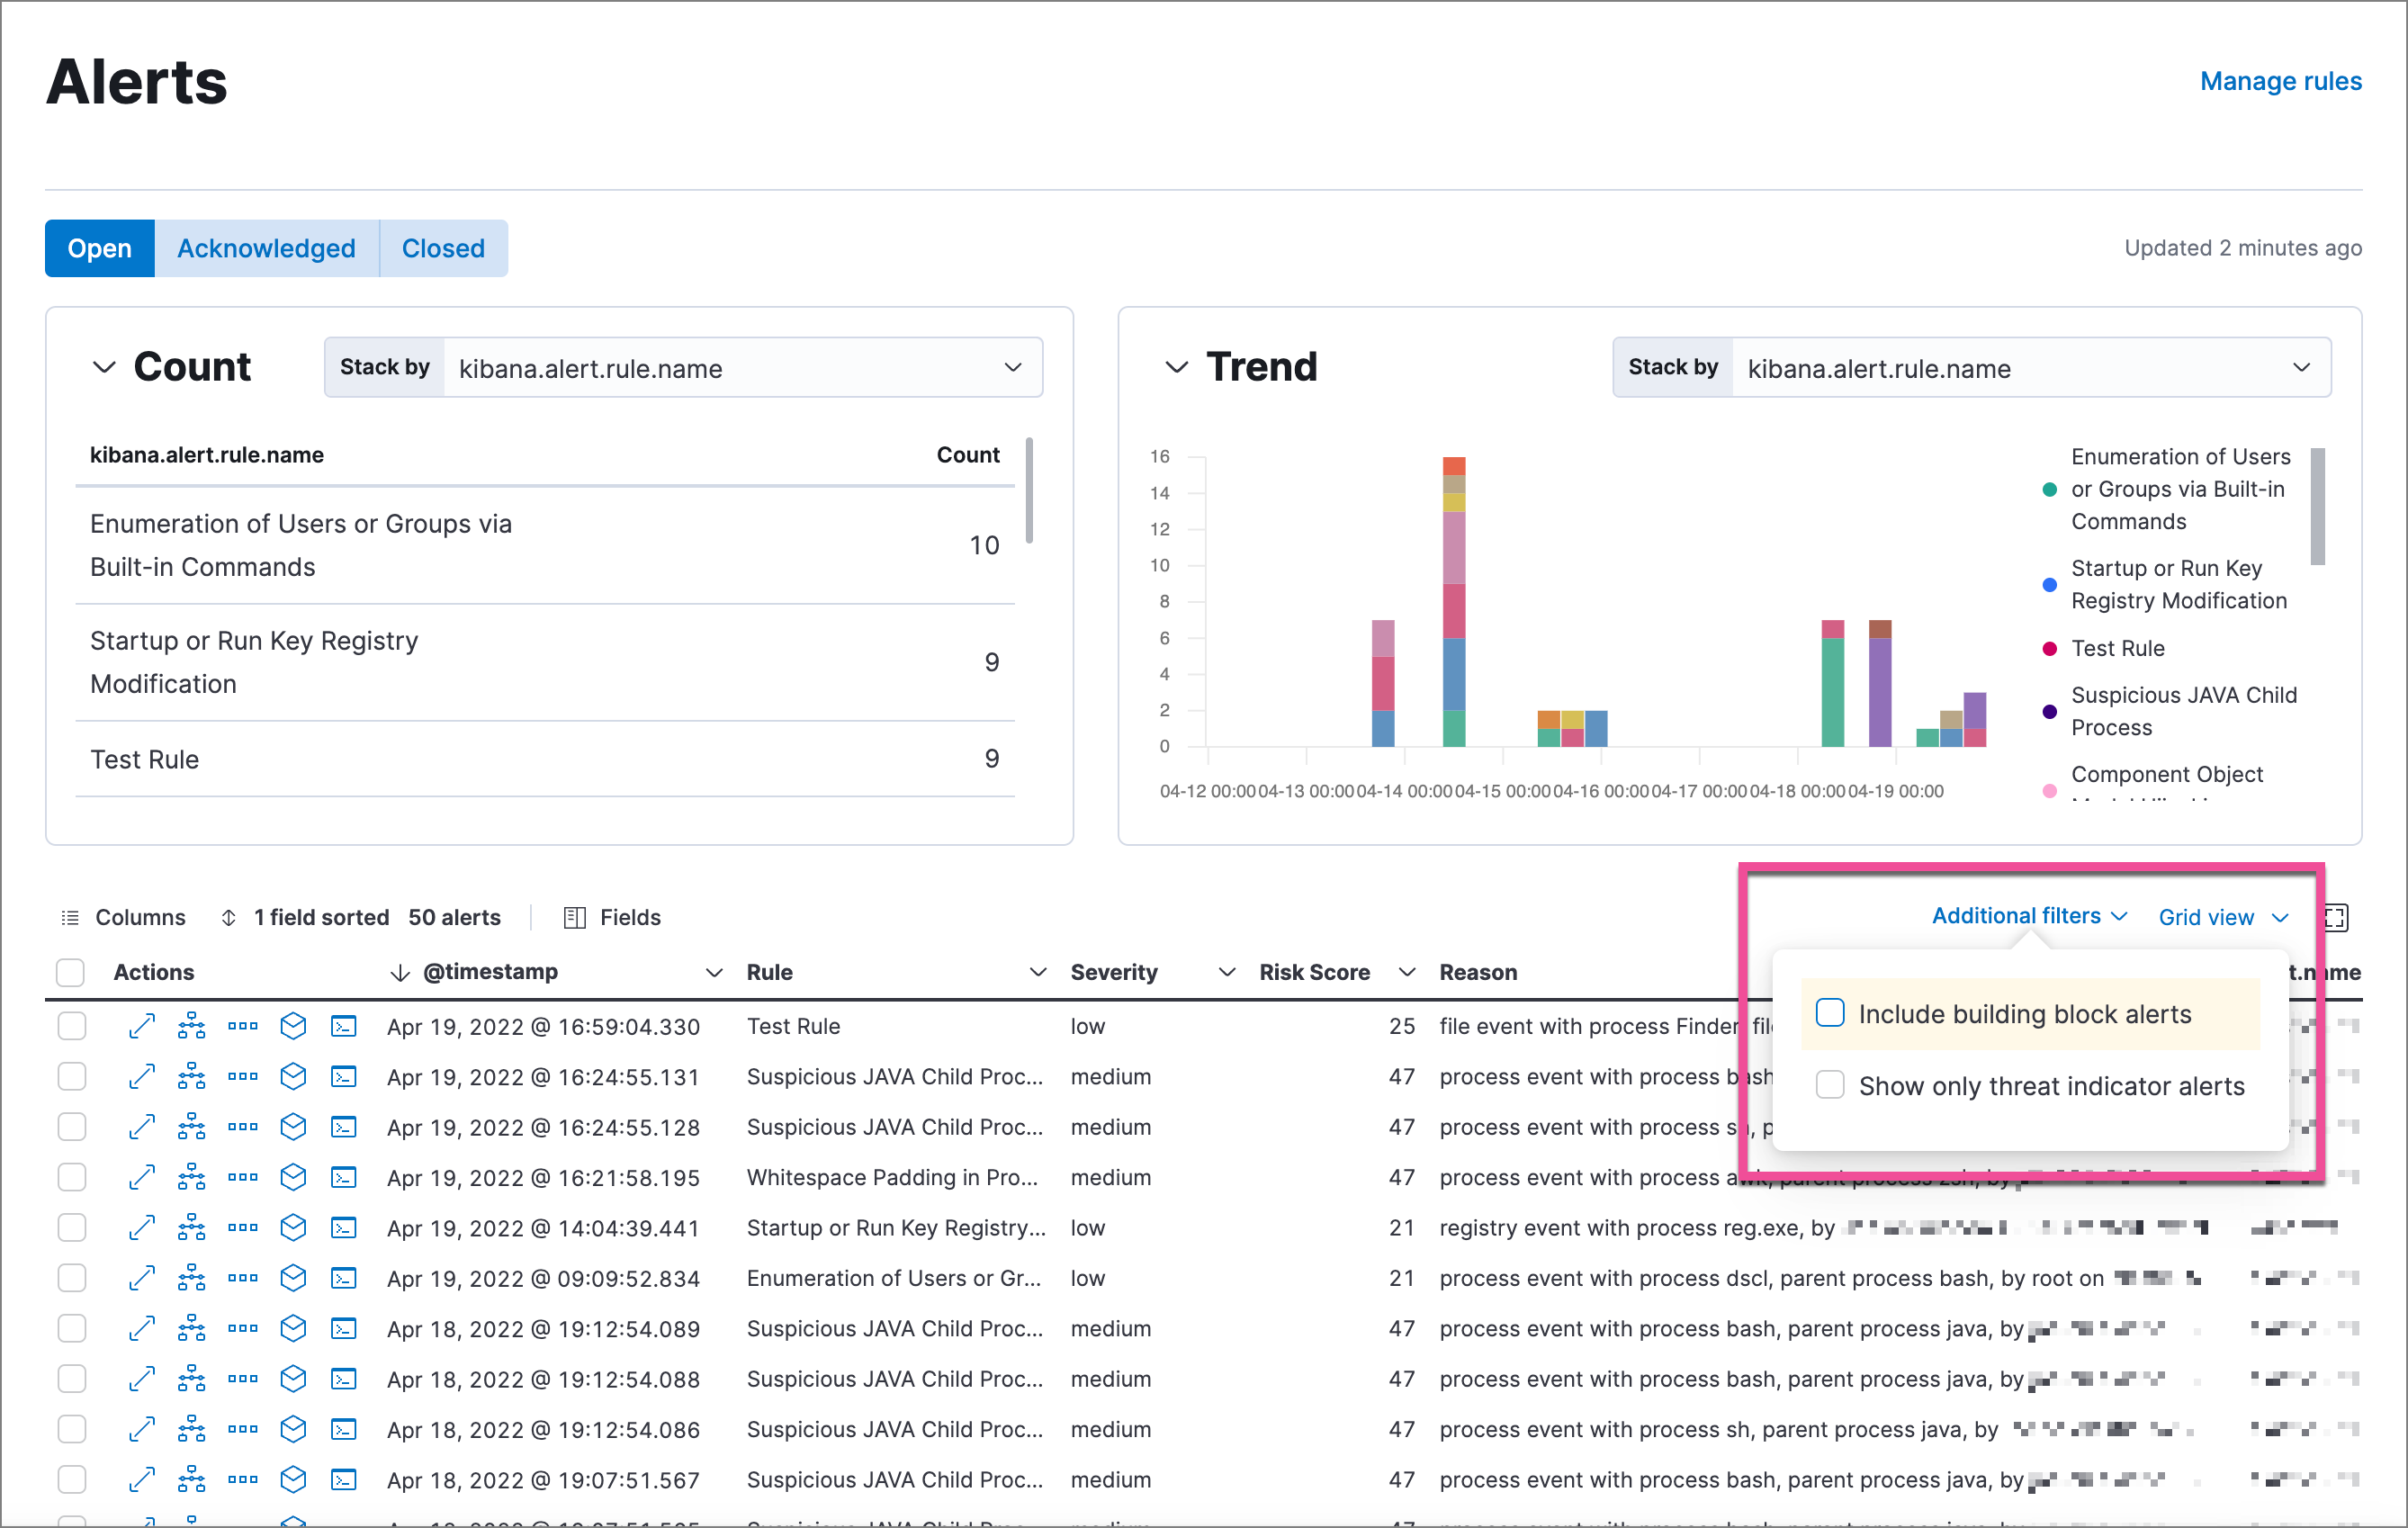
- Filter alert results to include building block alerts or to only show alerts from indicator match rules, by selecting the Additional filters drop-down. By default, building block alerts are excluded from the Overview and Alerts pages. You can choose to include building block alerts on the Alerts page, which expands the number of alerts.
When updating alert results to include building block alerts, the Security app searches the .alerts-security.alerts-<Kibana space> index for the kibana.alert.building_block_type field. When looking for alerts created from indicator match rules, the app searches the same index for kibana.alert.rule.type:'threat_match'.
Customize the Alerts table
editUse the toolbar buttons in the upper-left of the Alerts table to customize the columns you want displayed:
- Columns: Reorder the columns.
- x fields sorted: Sort the table by one or more columns.
- Fields: Select the fields to display in the table. You can also add runtime fields to detection alerts and display them in the Alerts table.
Click the Full screen button in the upper-right to view the table in full-screen mode.
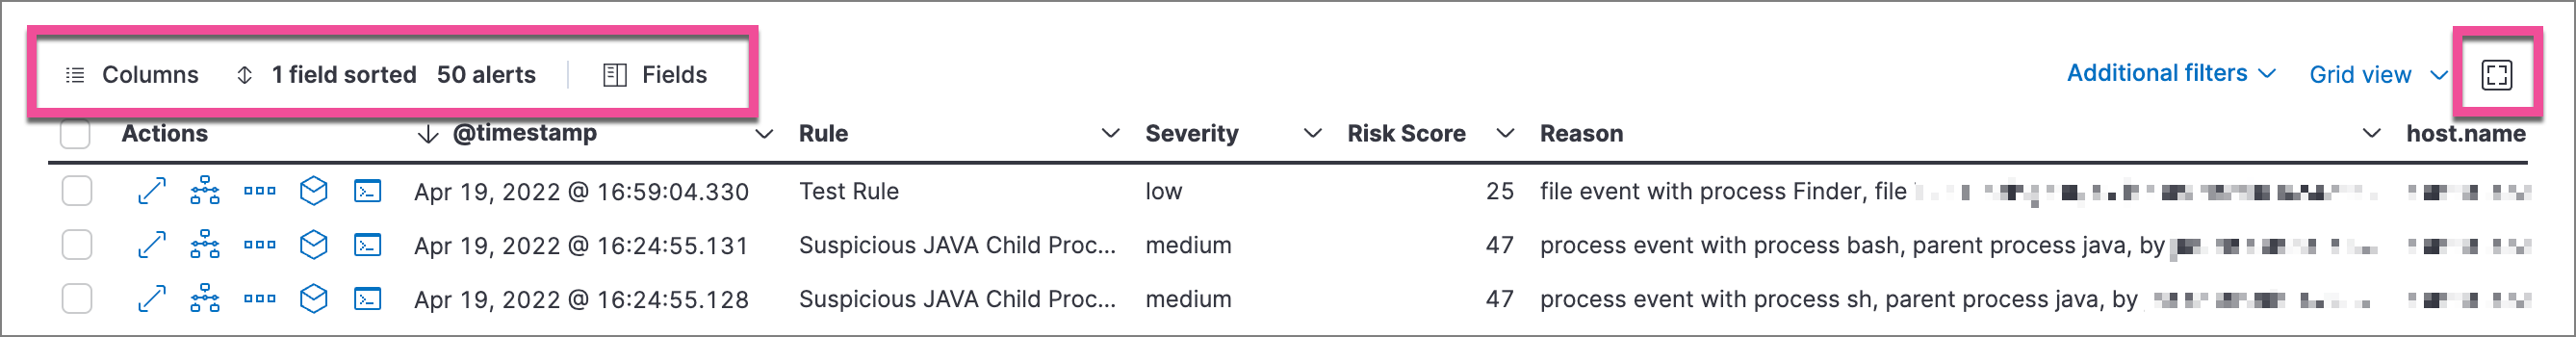
Use the view options drop-down in the upper-right of the Alerts table to control how alerts are displayed:
- Grid view: Displays alerts in a traditional table view with columns for each field
- Event rendered view: Display alerts in a descriptive event flow that includes relevant details and context about the event.
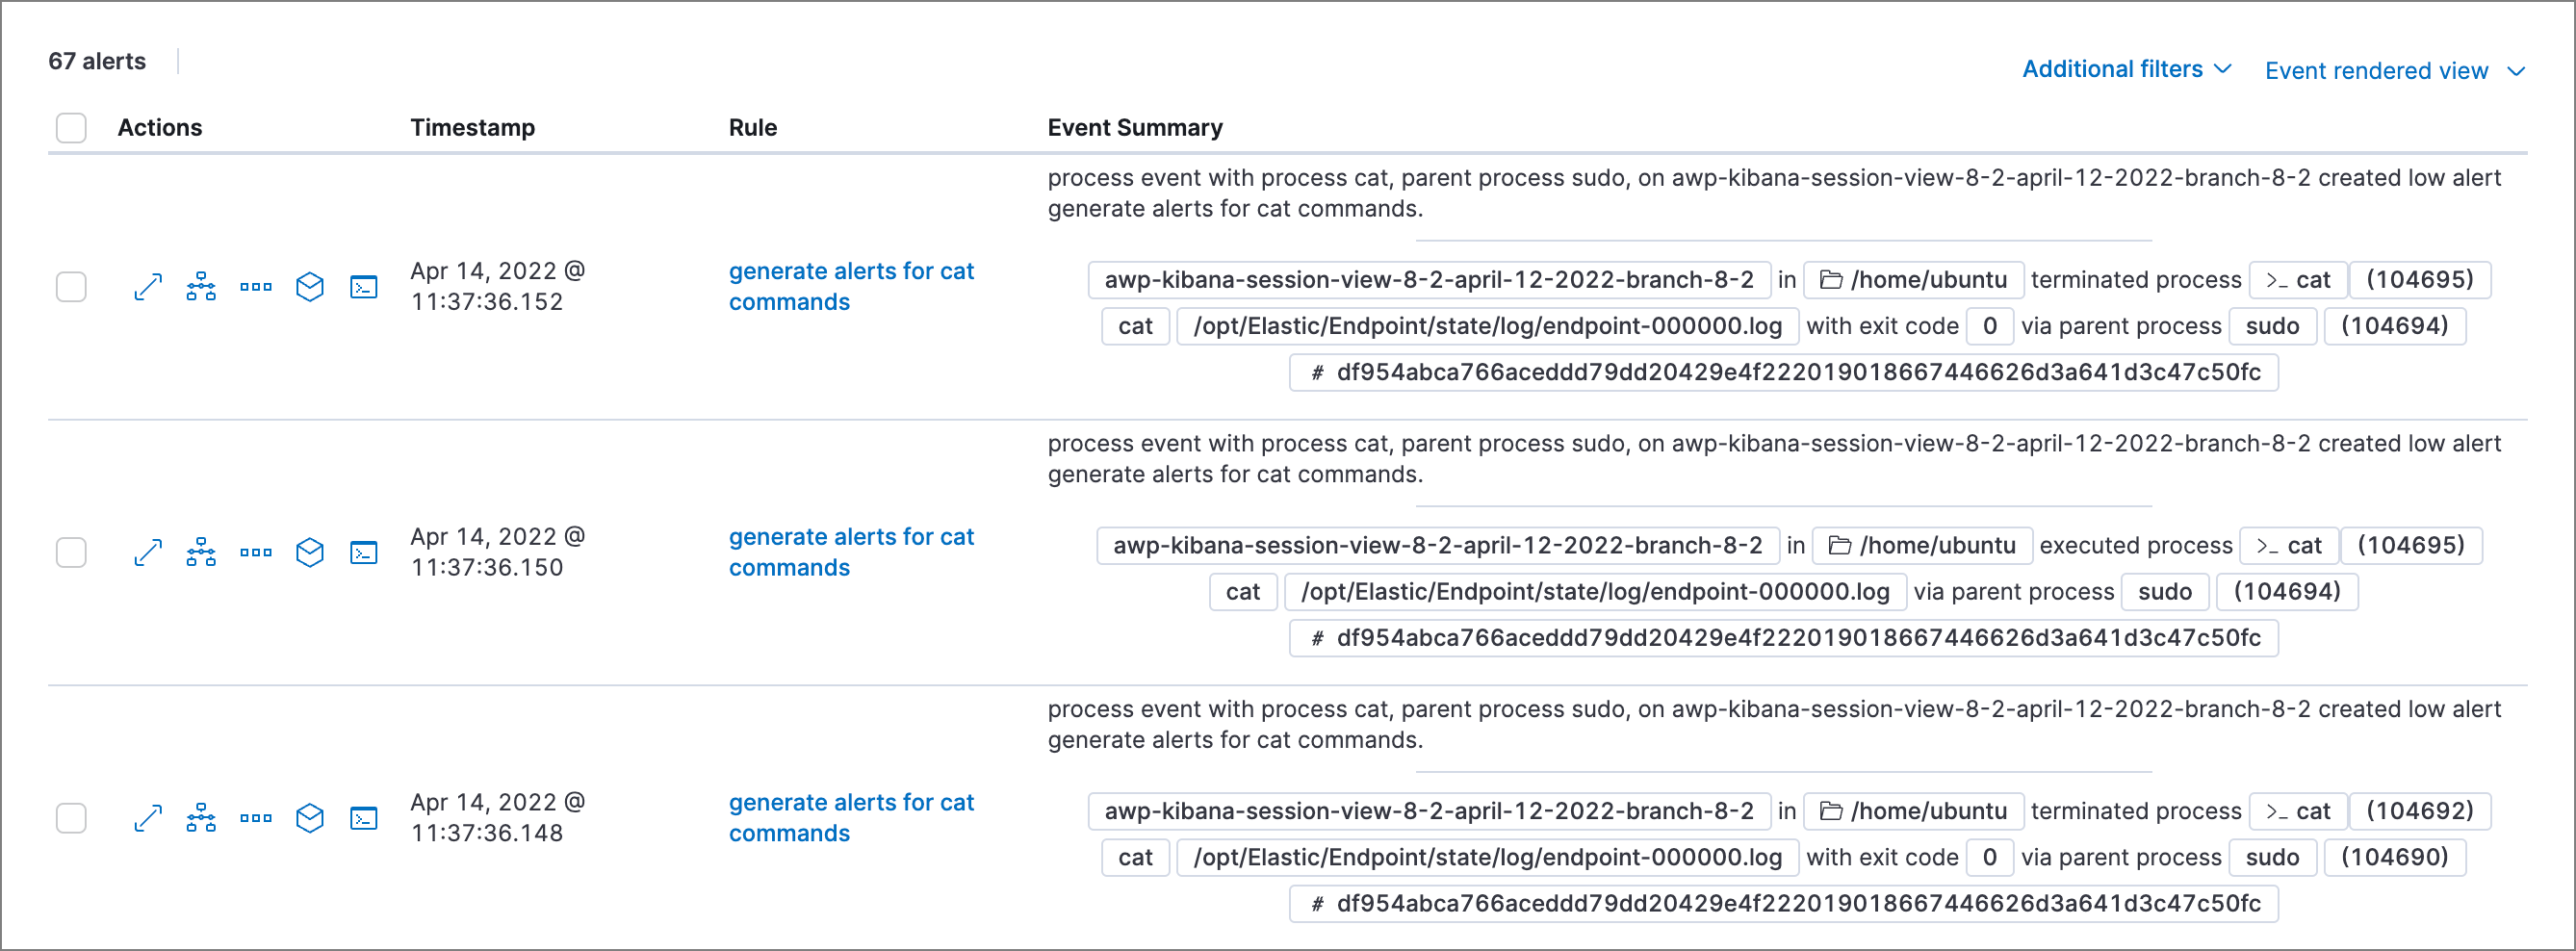
If you’re in the grid view, you can still view the event rendering for a specific alert by clicking the link in the Event Summary column, if a link is available. Some events do not have event renderings.
View alert details
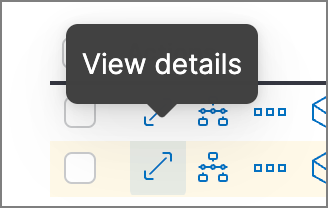
editTo further inspect a detection alert, click the View details button from the Alerts table. The Alert details flyout appears with several options to view alert data.
The Alert details flyout contains the following informational tabs:
Overview
The Overview tab provides an overview of the alert and shows relevant threat intelligence details. Use this information to understand what generated the alert so you can appropriately triage and resolve it.
The Overview tab has three main sections: the alert summary, Highlighted Fields, and Enriched data. The alert summary and Highlighted Fields sections are standard for every alert. The Enriched data section only displays for alerts with intelligence data.
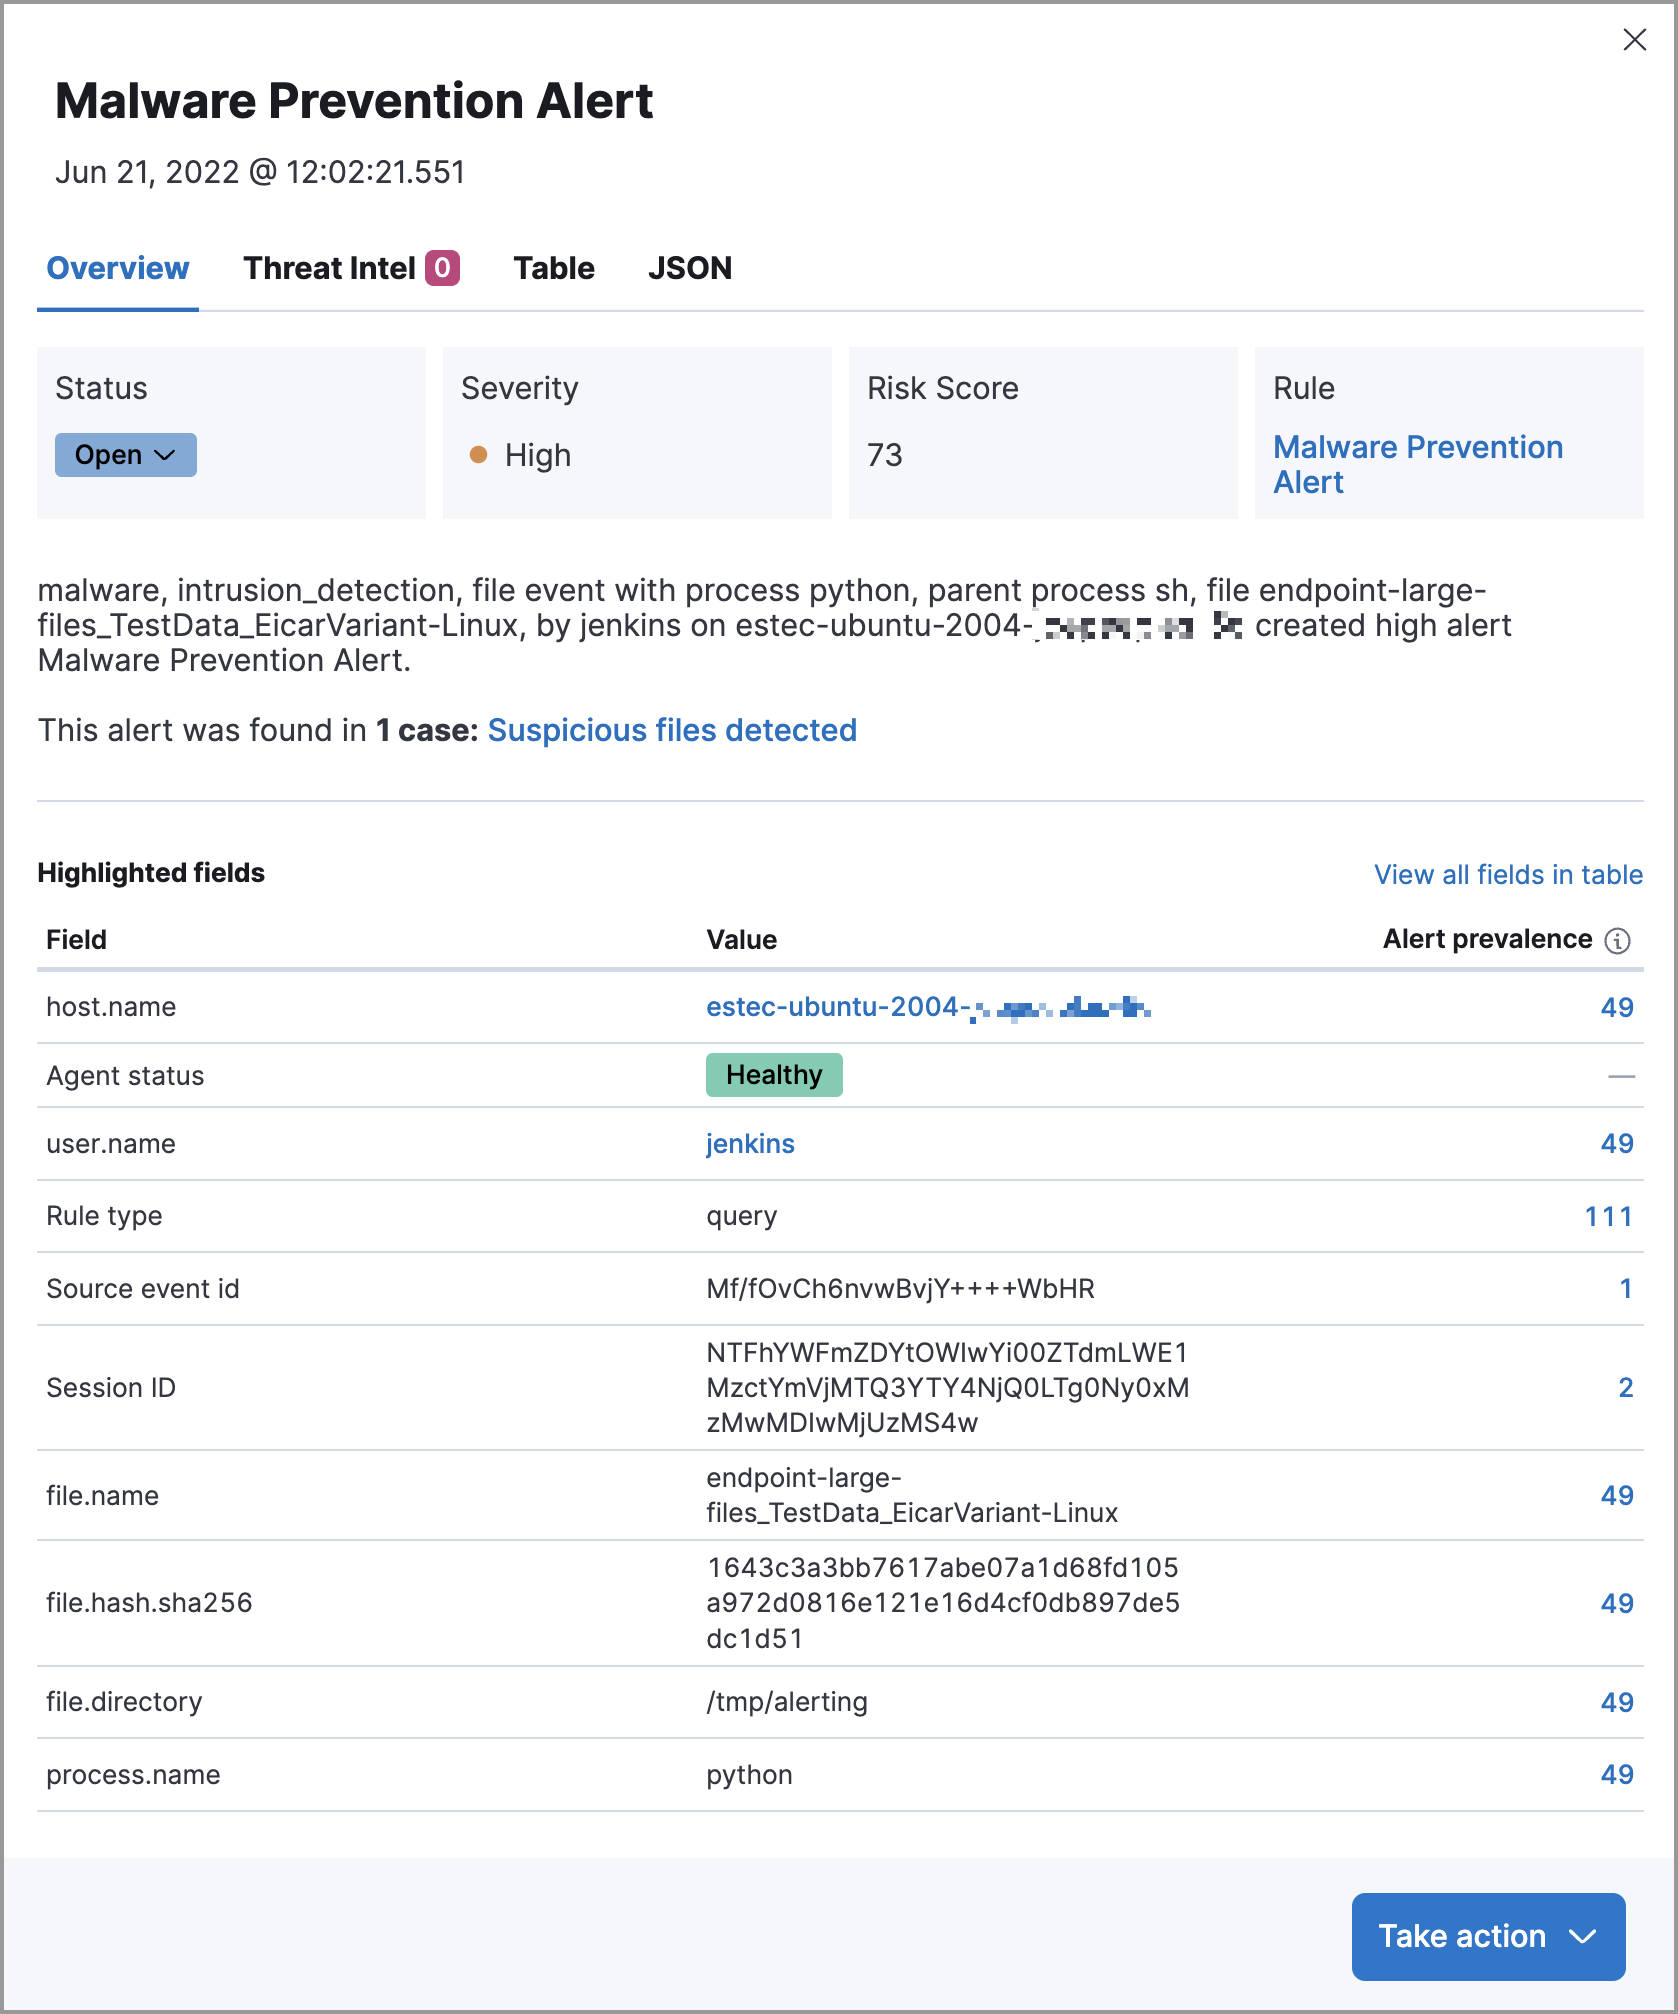
The alert summary section provides general alert details such as the alert’s status, the severity of the alert, the alert’s calculated risk score, and a link to the rule that produced the alert. These details are provided for all alerts regardless of the alert type.
The alert’s reason statement is under the alert summary. The reason statement describes what generated the alert and provides general alert details. You can use this information to understand the alert’s origin and determine if the alert is relevant to your investigation.
The Alert details flyout also lists the number and names of cases to which the alert has been added. Click a case’s names to open its details.
The Highlighted Fields section displays the most relevant fields for the alert type. Use this section to inform your triage efforts as you investigate the alert.
The Session ID field provides a unique ID for tracking a given Linux session and is stored in the process.entry_leader.entity_id field in the alert’s document. To collect the session ID and other session data, you must enable the Include session data setting on your Endpoint and Cloud Security integration policy. Refer to Enable Session View data for more information.
The Alert prevalence column shows the total number of alerts within the selected timeframe that have identical values. For example, an alert prevalence of 3 for host.name means three alerts with the same host.name value exist within the timeframe.
Alert prevalence data can help you investigate relationships with other alerts and gain context about the events producing alerts. You can also click the alert prevalence count to explore the alerts in Timeline.
Before investigating alert prevalence data in Timeline, save any Timelines you’re working on to ensure you can access them later.
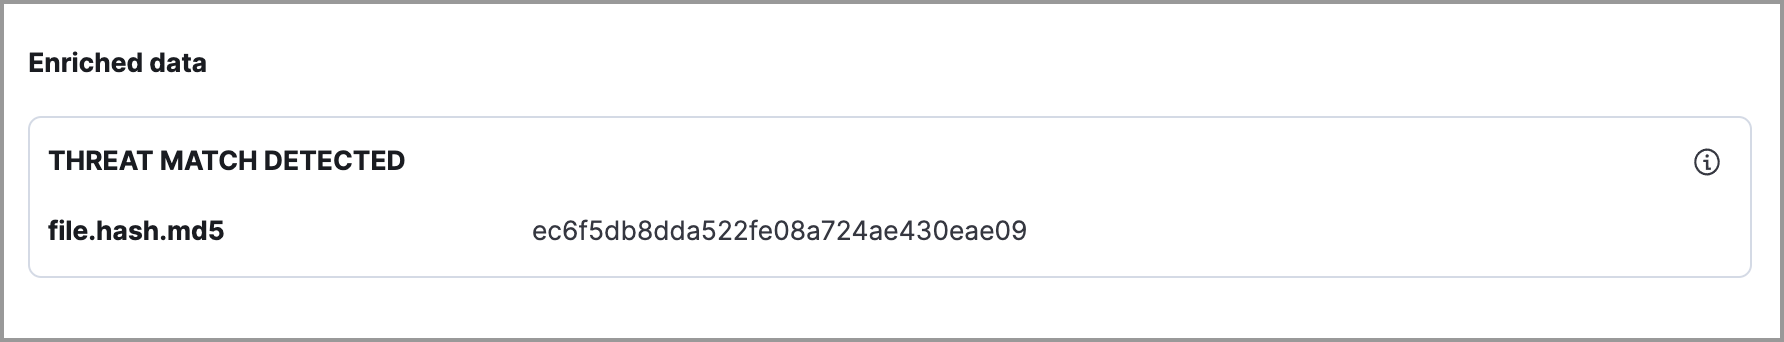
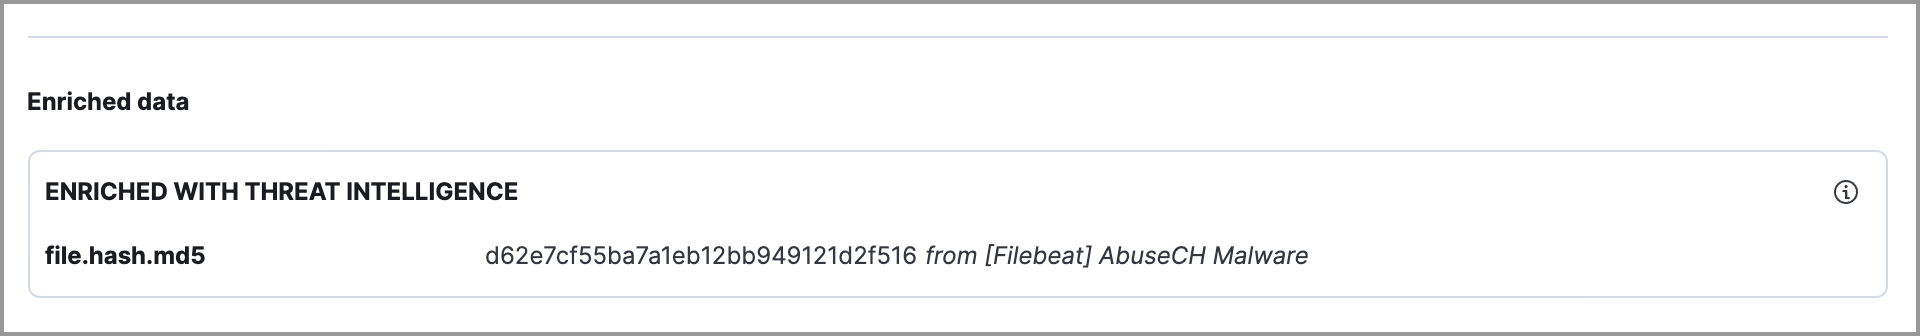
The Enriched data section displays available threat indicator matches and threat intelligence data. Click the info icon to learn more about what data is collected.
When gathering threat intelligence data for an alert, Elastic Security queries the alert for indicator matches from the past 30 days. The query looks for the following fields:
-
file.hash.md5: The MD5 hash -
file.hash.sha1: The SHA1 hash -
file.hash.sha256: The SHA256 hash -
file.pe.imphash: Imports in a PE file -
file.elf.telfhash: Imports in an ELF file -
file.hash.ssdeep: The SSDEEP hash -
source.ip: The IP address of the source (IPv4 or IPv6) -
destination.ip: The event’s destination IP address -
url.full: The full URL of the event source -
registry.path: The full registry path, including the hive, key, and value
If these fields aren’t available, Elastic Security does not perform the query and does not display threat intelligence data for the alert.
Discovered threat indicator match data is placed under the Threat Match Detected sub-section.
All other available threat intelligence data is placed under the Enriched with Threat Intelligence sub-section.
To learn more about the query, select the Threat Intel tab, then click the Inspect button next to the threat you want to inspect.
Additional threat intelligence data is generated for indicator match alerts when indicators are matched with source events, as outlined by the conditions in the relevant indicator match rule. Indicator match alerts always populate the Threat Matched Detected section under the Threat Intel tab with additional threat match data.
After upgrading to Elastic Stack version 7.15.0 or newer from release versions 7.12.0 through 7.14.2, you need to migrate detection alerts enriched with threat intelligence data to ensure threat intelligence properly displays in Elastic Security. For more information, refer to instructions for migrating detection alerts enriched with threat intelligence data.
Threat Intel
The Threat Intel tab shows the number of individual threats matching the alert. You can expand and collapse threat details by clicking the arrow button at the end of the threat label. Each threat is labelled with values from the matched.field and matched.atomic fields and displays the threat intelligence provider. If the alert does not contain threat intelligence data, the Threat Intel tab displays a message that none is available.
Matched threats are organized into several sections, described below. Within each section, matched threats are shown in reverse chronological order, with the most recent at the top. All mapped fields are displayed for each matched threat.
- Threat Matched Detected: This section is solely reserved for threat indicator matches identified by an indicator match rule. Threat indicator matches are produced whenever event data matches a threat indicator field value in your indicator index. If indicator threat matches are not discovered, the section displays a message that none are available.
- Enriched with Threat Intelligence: This section shows indicator matches that Elastic Security found when querying the alert for fields with threat intelligence. You can use the date time picker to modify the query time frame, which looks at the past 30 days by default. Click the Inspect button, located on the far right of the threat label, to view more information on the query. If threat matches are not discovered within the selected time frame, the section displays a message that none are available.
The event enrichment query uses the indices specified in the securitySolution:defaultThreatIndex advanced setting. For more information, refer to Update default Elastic Security threat intelligence indices.
Table
The Table tab shows the alert details in table format. Alert details are organized into field value pairs.
JSON
The JSON tab shows the alert details in JSON format.
Take actions on an alert
editFrom the Alerts table or the Alert details flyout, you can do the following:
Change an alert’s status
editYou can set an alert’s status to indicate whether it needs to be investigated (Open), is under active investigation (Acknowledged), or has been resolved (Closed). By default, the Alerts page displays open alerts. To filter alerts that are Acknowledged or Closed, select the appropriate status in the upper-left corner of the Alerts page. This filters all of the results displayed on the page (the Trend histogram, and the Counts table, and the Alerts table).
To change an alert’s status, do one of the following:
- In the alert’s row, click the More actions menu (…) in the Alerts table, then select the appropriate status (Mark as open, Mark as acknowledged, or Mark as closed).
- In the Alerts table, select all the alerts you want to change, click on the drop-down at the upper-left above the table, and then select Mark as open, Mark as acknowledged, or Mark as closed.
- In the Alert details flyout, click Take action and select Mark as open, Mark as acknowledged, or Mark as closed.
Add alerts to cases
editFrom the Alerts table, you can attach one or more alerts to a new case or an existing one. Alerts from any rule type can be added to a case.
Once you’ve added an alert to a case, you can only remove it through the Elastic Security Cases API.
Add alerts to a new case
editTo add alerts to a new case:
-
Do one of the following:
- To add a single alert to a case, select the More actions menu (…) in the Alerts table or Take action in the Alert details flyout, then select Add to a new case.
- To add multiple alerts, select the alerts, then select Add to a new case from the Bulk actions menu.
-
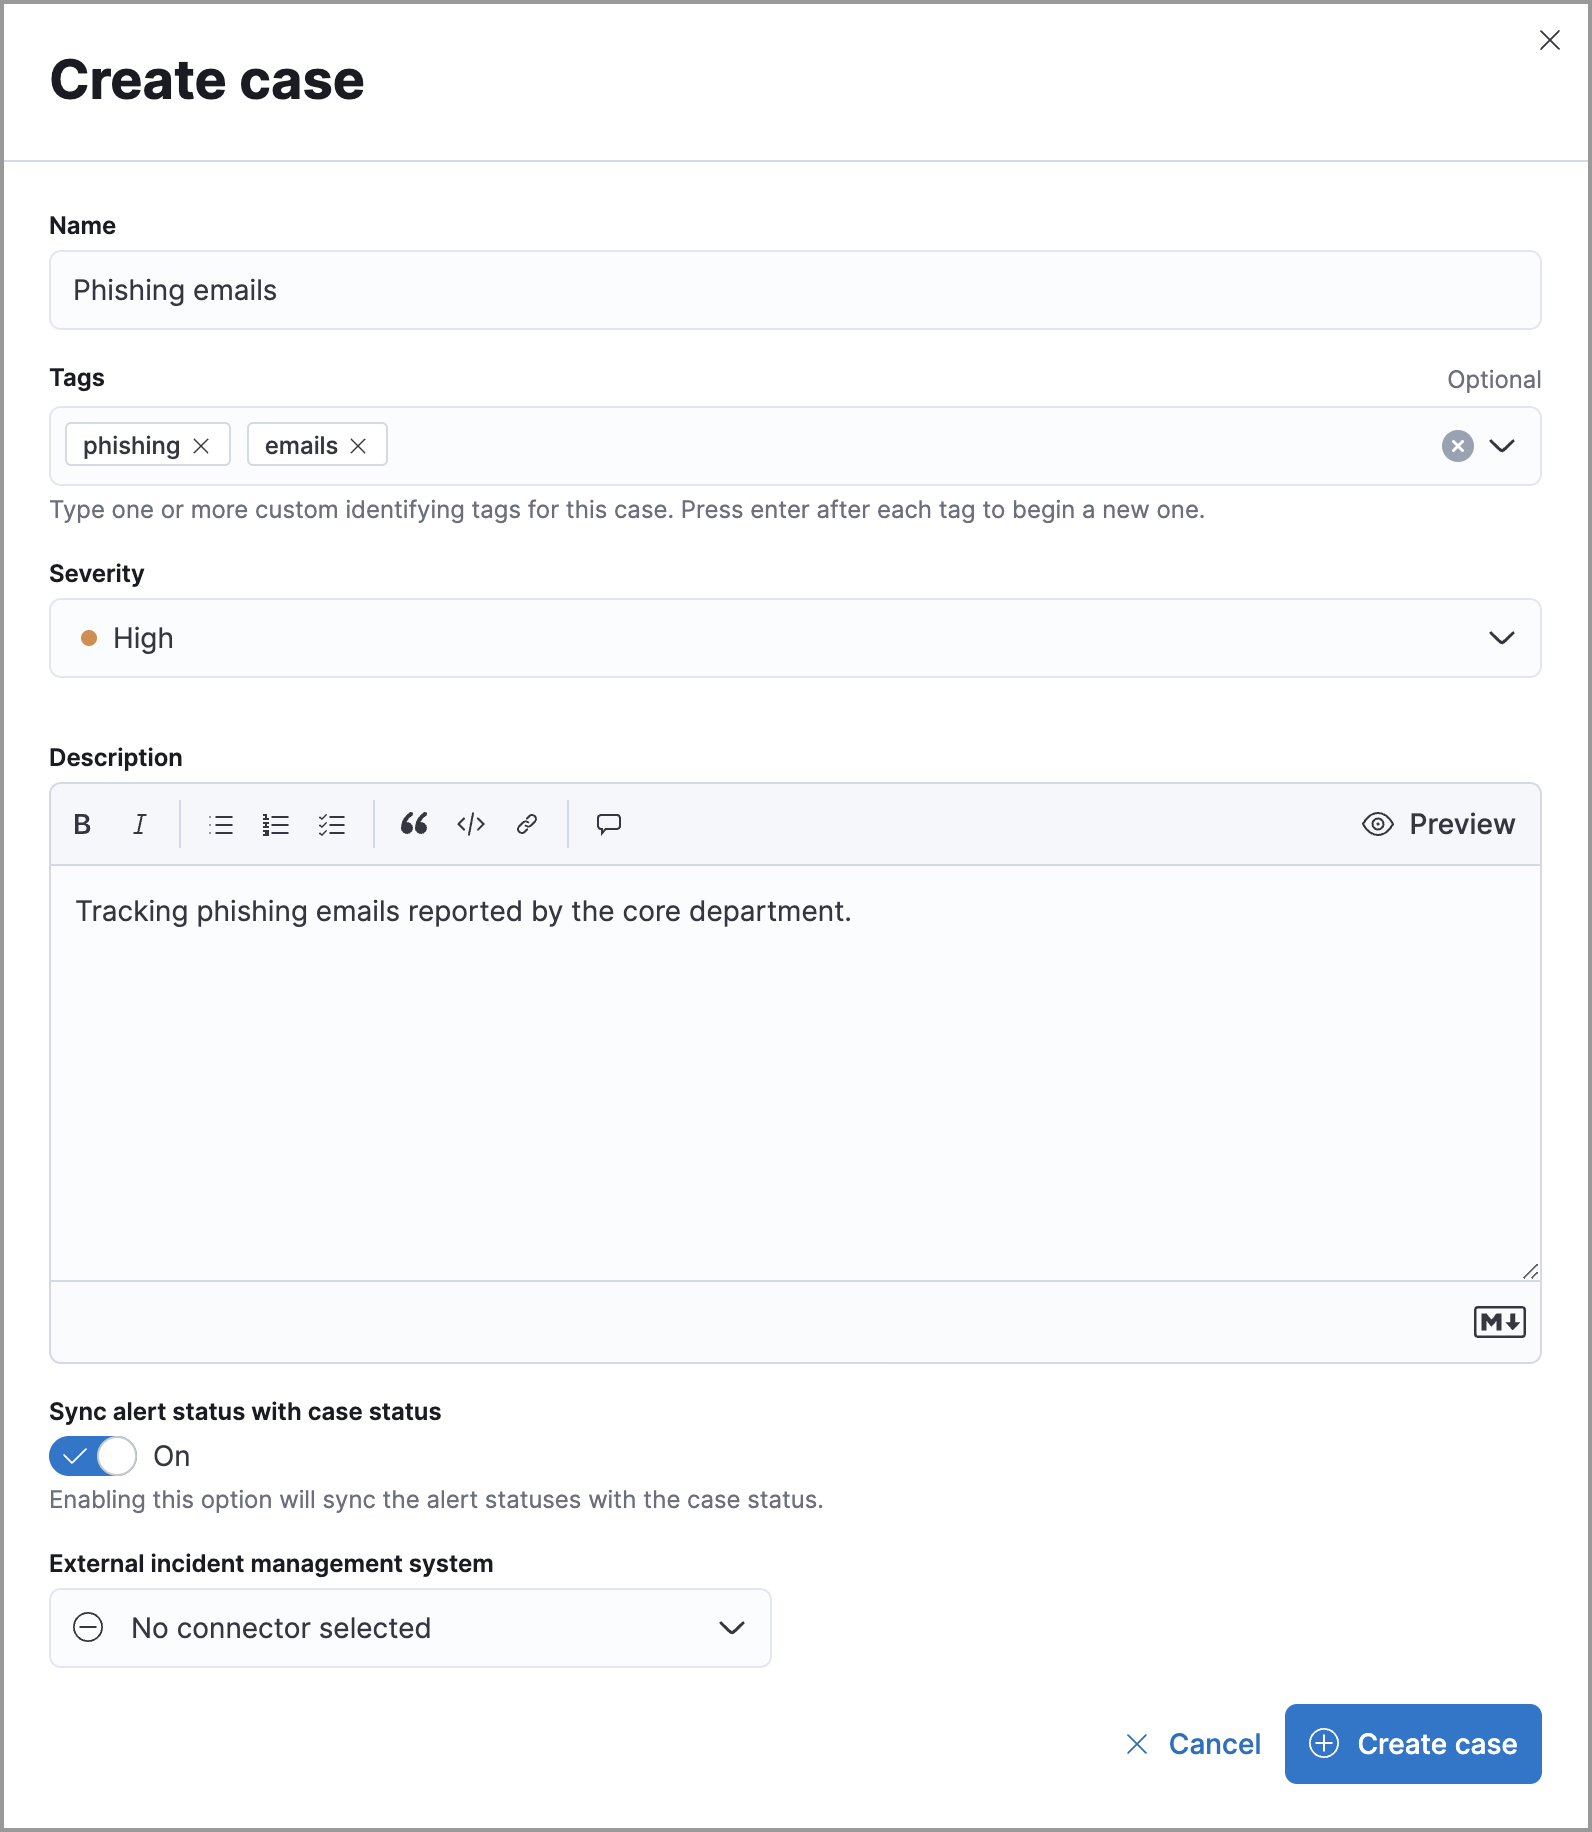
In the Create new case flyout, give your case a name, add relevant tags (optional), assign a severity level, and include a case description.
If you do not assign your case a severity level, it will be assigned Low by default.
- Specify whether you want to sync the status of associated alerts. It is enabled by default; however, you can toggle this setting on or off at any time. If it remains enabled, the alert’s status updates whenever the case’s status is modified.
-
Select a connector. If you’ve previously added one, that connector displays as the default selection. Otherwise, the default setting is
No connector selected. - Click Create case after you’ve completed all of the required fields. A confirmation message is displayed with an option to view the new case. Click the link in the notification or go to the Cases page to view the case.
Add alerts to an existing case
editTo add alerts to an existing case:
-
Do one of the following:
- To add a single alert to a case, select the More actions menu (…) in the Alerts table or Take action in the Alert details flyout, then select Add to existing case.
- To add multiple alerts, select the alerts, then select Add to an existing case from the Bulk actions menu.
-
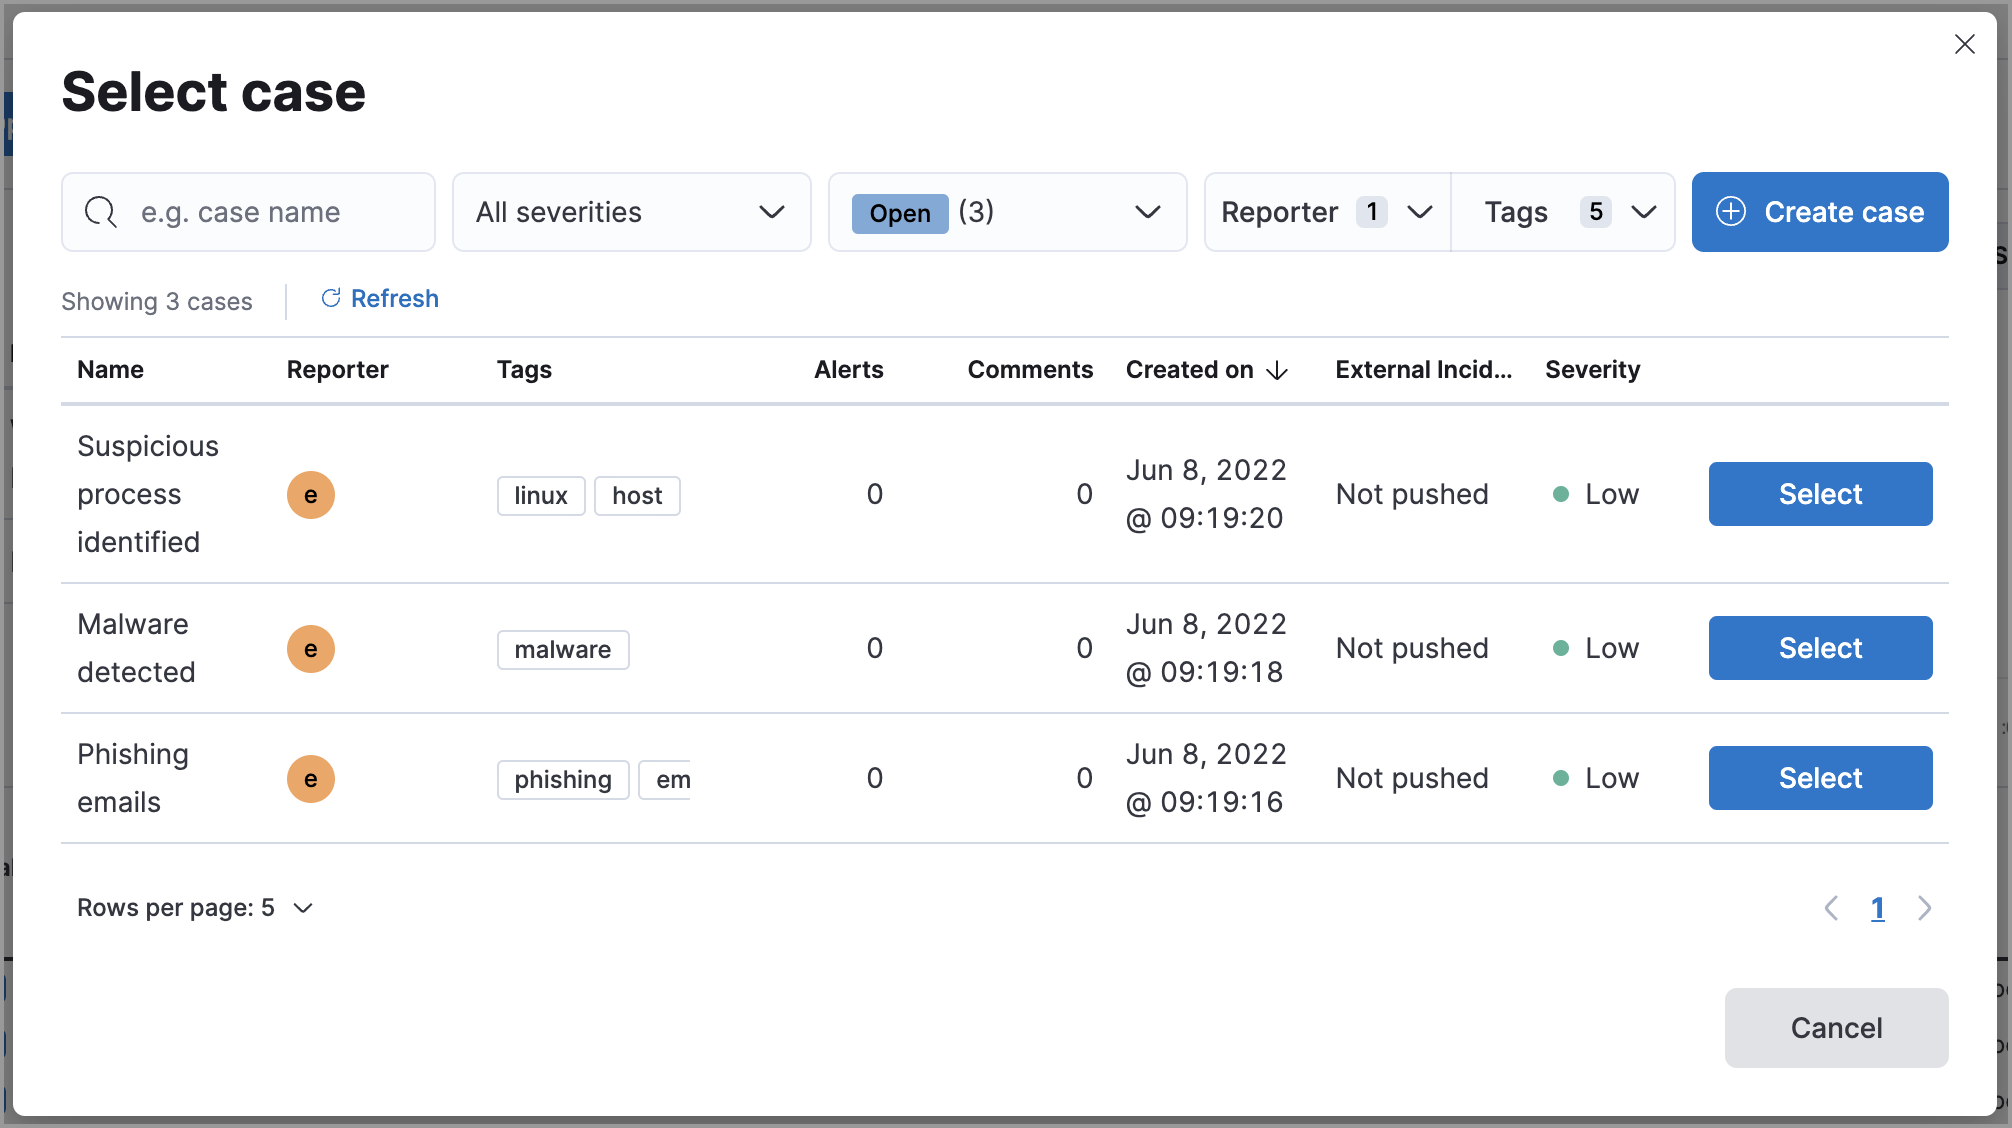
From the Select case dialog box, select the case to which you want to attach the alert. A confirmation message is displayed with an option to view the updated case. Click the link in the notification or go to the Cases page to view the case’s details.
If you attach the alert to a case that has been configured to sync its status with associated alerts, the alert’s status updates any time the case’s status is modified.
View alerts in Timeline
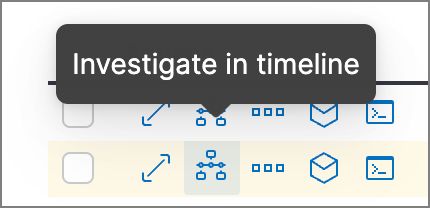
editTo view an alert in Timeline, click the Investigate in timeline button in the Alerts table. Alternatively, select Take action → Investigate in timeline in the Alert details flyout.
When you send an alert generated by a threshold rule to Timeline, all matching events are listed in the Timeline, even ones that did not reach the threshold value. For example, if you have an alert generated by a threshold rule that detects 10 failed login attempts, when you send that alert to Timeline, all failed login attempts detected by the rule are listed.
Suppose the rule that generated the alert uses a Timeline template. In this case, when you investigate the alert in Timeline, the dropzone query values defined in the template are replaced with their corresponding alert values.
Example
This Timeline template uses the host.name: "{host.name}" dropzone filter in
the rule. When alerts generated by the rule are investigated in Timeline, the
{host.name} value is replaced with the alert’s host.name value. If the
alerts’s host.name value is Windows-ArsenalFC, the Timeline dropzone query
is host.name: "Windows-ArsenalFC".
Refer to Investigate events in Timeline for information on creating Timelines and Timeline templates. For information on how to add Timeline templates to rules, refer to Create a detection rule.
Add rule exceptions
editYou can add exceptions to the rule that generated the alert directly from the Alerts table. Exceptions prevent a rule from generating alerts even when its criteria are met.
To add an exception, click the More actions menu (…) in the Alerts table, then select Add exception. Alternatively, select Take action → Add rule exception in the Alert details flyout.
For information about exceptions and how to use them, refer to Rule exceptions and value lists.
Visually analyze process relationships
editFor process events that are detected by Elastic Endpoint, you can open a visual mapping to view a hierarchal timeline of when these events occurred. For more information, refer to Visual event analyzer.