Open and manage cases
editOpen and manage cases
editYou can create and manage cases using the UI or the Cases API.
Open a new case
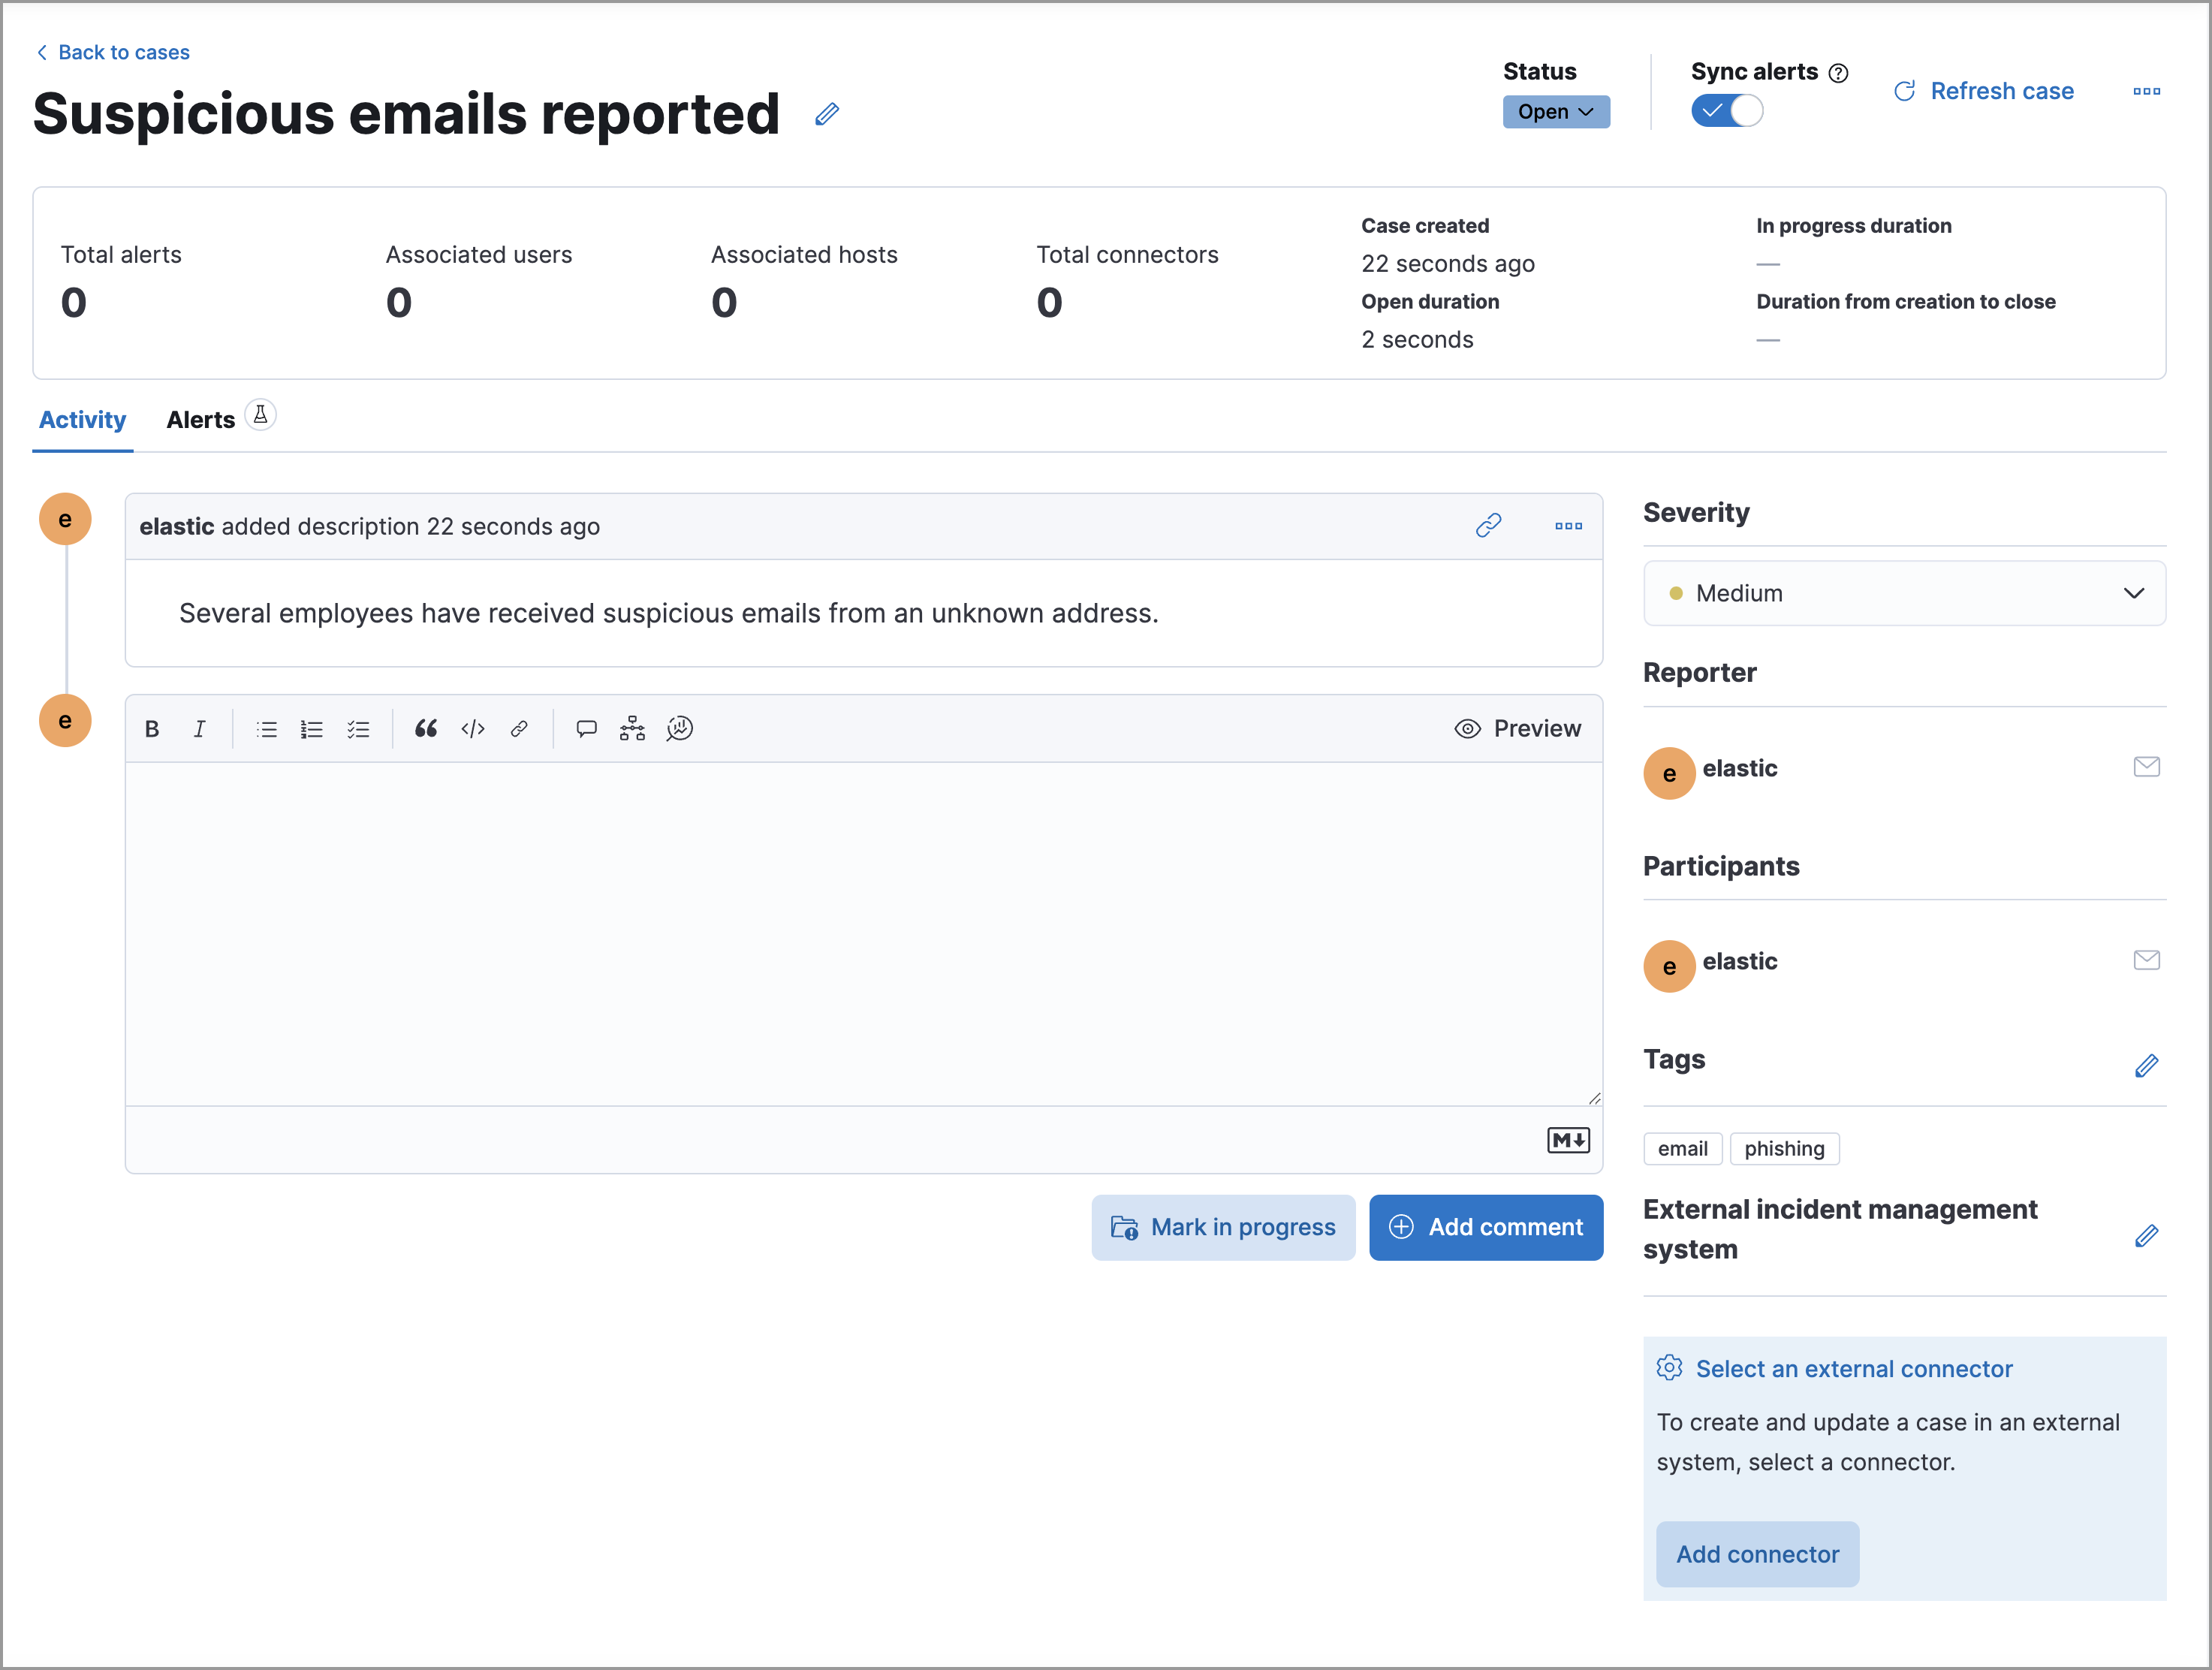
editOpen a new case to keep track of security issues and share their details with colleagues.
- Go to Investigate → Cases, then click Create case. If no cases exist, the Cases table will be empty and you’ll be prompted to create one by clicking the Create case button inside the table.
-
Give the case a name, add relevant tags, assign a severity level, and provide a description. You can use Markdown syntax in the case description.
If you do not assign your case a severity level, it will be assigned Low by default.
You can insert a Timeline link in the case description by clicking the Timeline icon (
 ).
). - Choose if you want alert statuses to sync with the case’s status after they are added to the case. This option is enabled by default, but you can turn it off after creating the case.
-
From External incident management, select a connector. If you’ve previously added one, that connector displays as the default selection. Otherwise, the default setting is
No connector selected. -
Click Create case.
If you’ve selected a connector for the case, the case is automatically pushed to the third-party system it’s connected to.
Manage existing cases
editFrom the Cases page, you can search existing cases and filter them by severity, tags, reporter, and status: Open, In progress, or Closed. General case metrics, including how long it takes to close cases, are provided above the table.
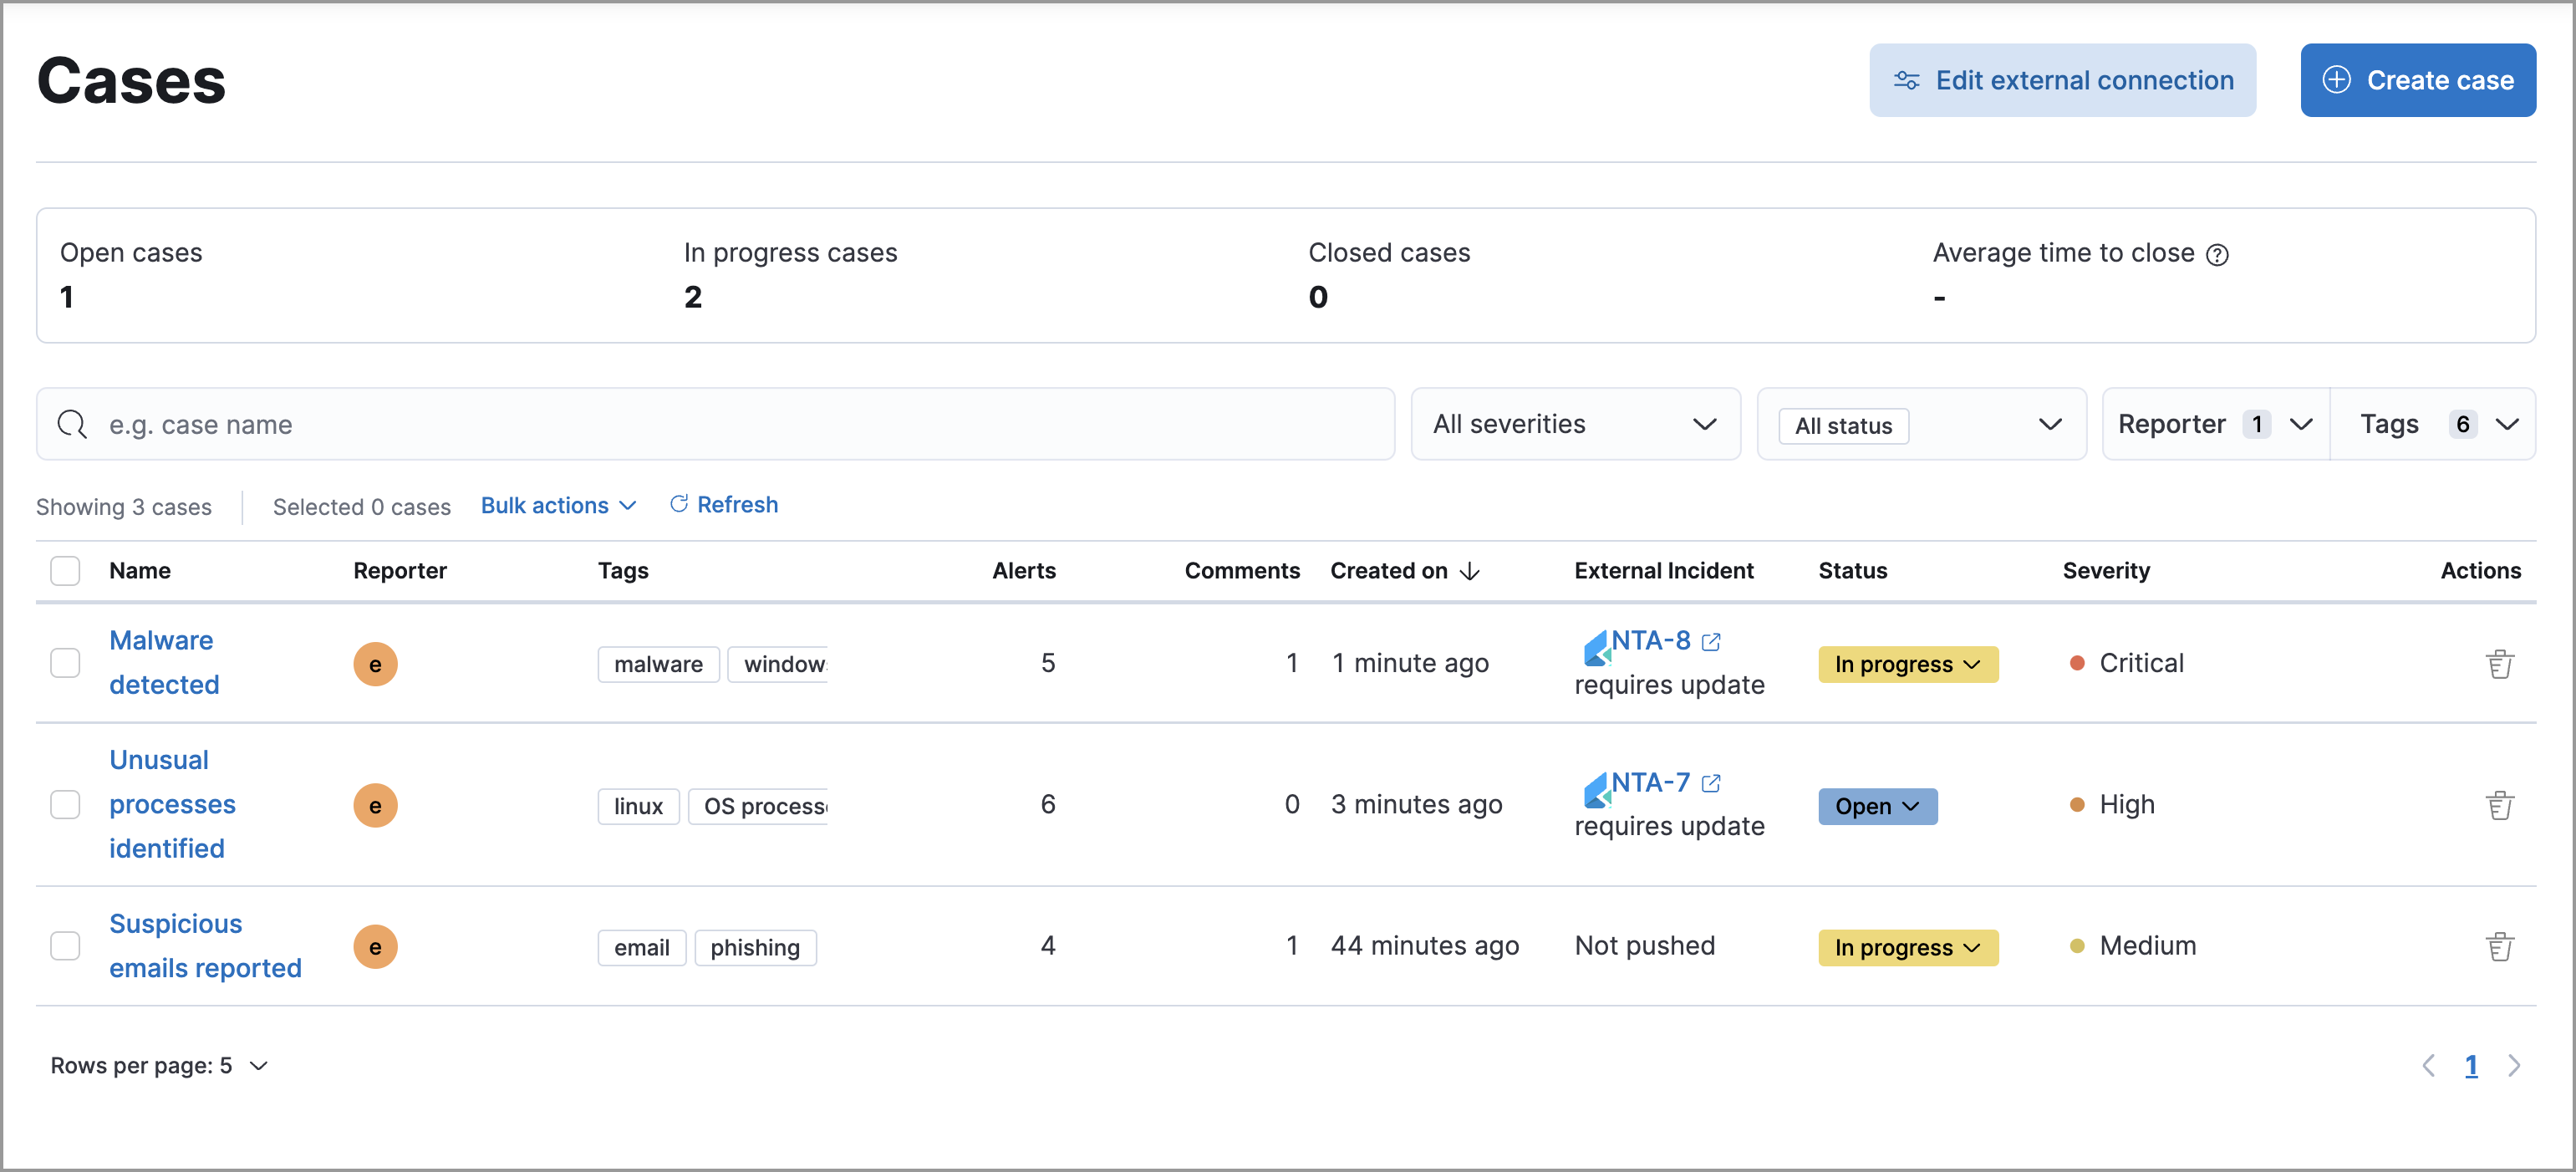
To explore a case, click on its name. You can then:
- Review the case summary
-
Add and manage comments
Comments can contain Markdown. For syntax help, click the Markdown icon (
 ) in the bottom right of the comment.
 - Examine alerts attached to the case
- Add a Lens visualization
- Modify the case’s description
- Manage connectors and send updates to external systems (if you’ve added a connector to the case)
- Close the case or reopen it
- Edit tags
- Update the case’s severity
- Refresh the case to retrieve the latest updates
Review the case summary
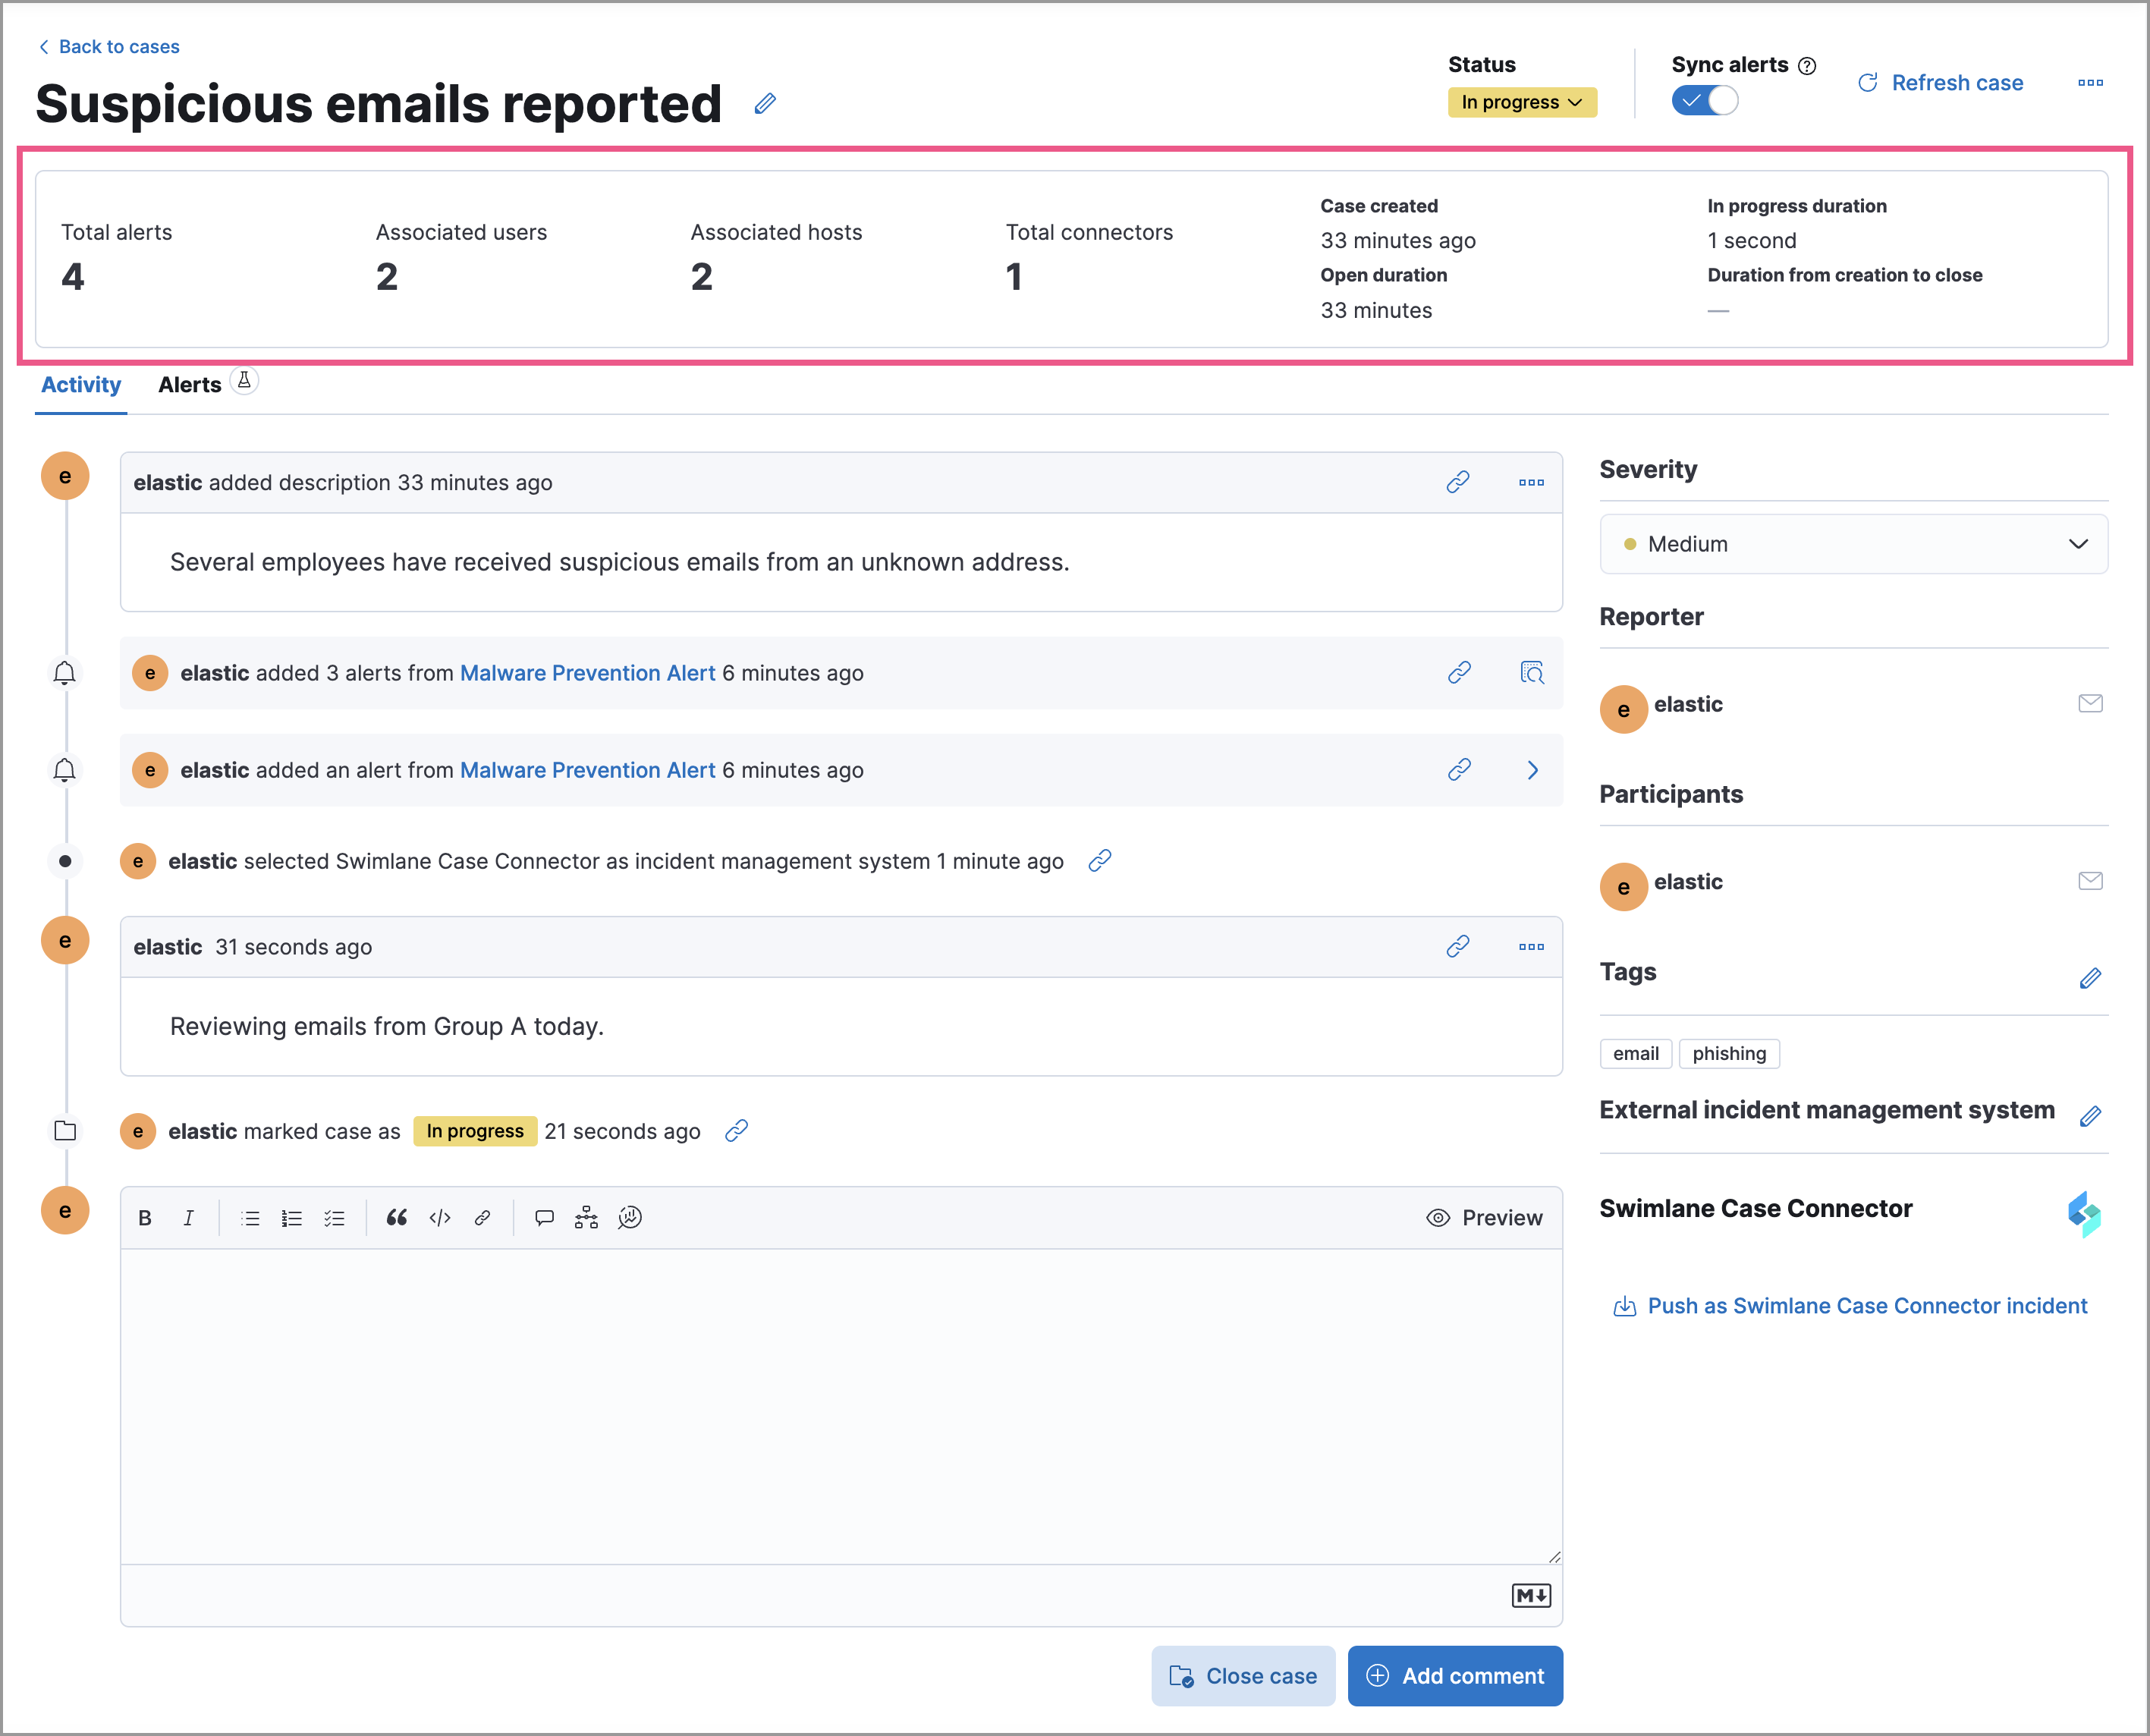
editClick on an existing case to access its summary. The case summary, located under the case title, contains metrics that summarize alert information and response times. These metrics update when you attach additional unique alerts to the case, add connectors, or modify the case’s status:
- Total alerts: Total number of unique alerts attached to the case
- Associated users: Total number of unique users that are represented in the attached alerts
- Associated hosts: Total number of unique hosts that are represented in the attached alerts
- Total connectors: Total number of connectors that have been added to the case
- Case created: Date and time that the case was created
- Open duration: Time elapsed since the case was created
-
In progress duration: How long the case has been in the
In progressstate - Duration from creation to close: Time elapsed from when the case was created to when it was closed
Manage case comments
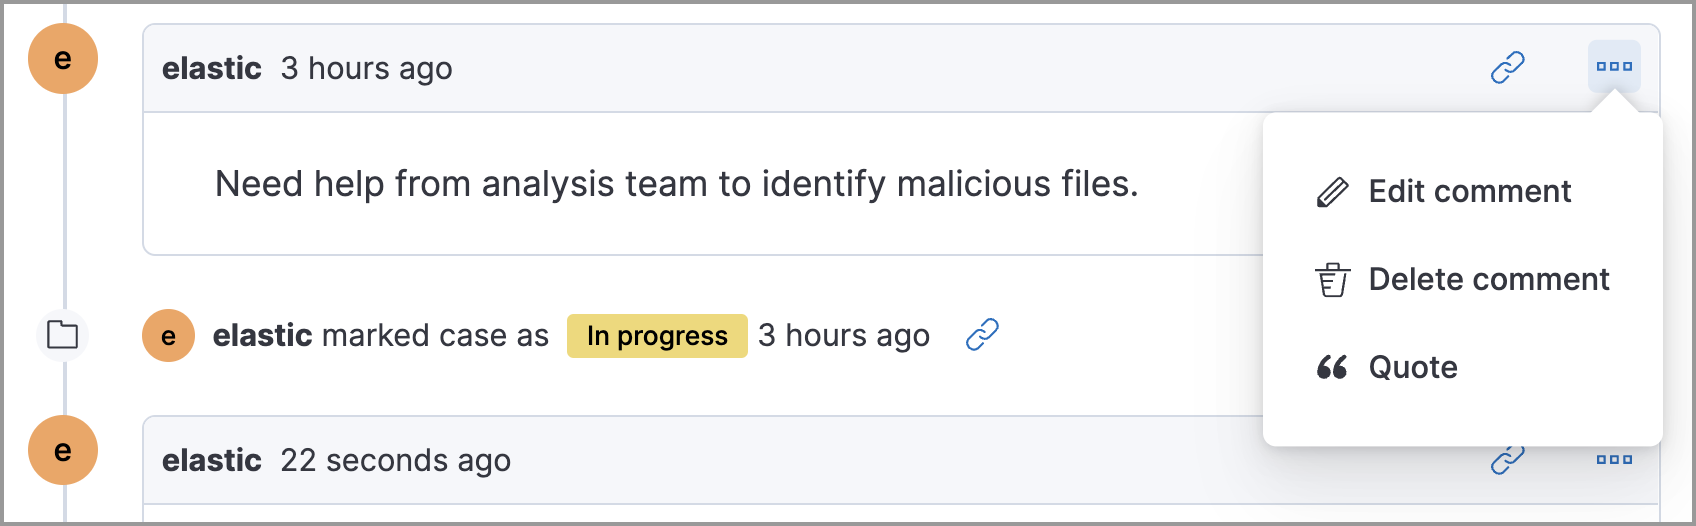
editTo edit, delete, or quote a comment, select the appropriate option from the More actions menu (…).
Examine alerts attached to a case
editThis functionality is in technical preview and may be changed or removed in a future release. Elastic will work to fix any issues, but features in technical preview are not subject to the support SLA of official GA features.
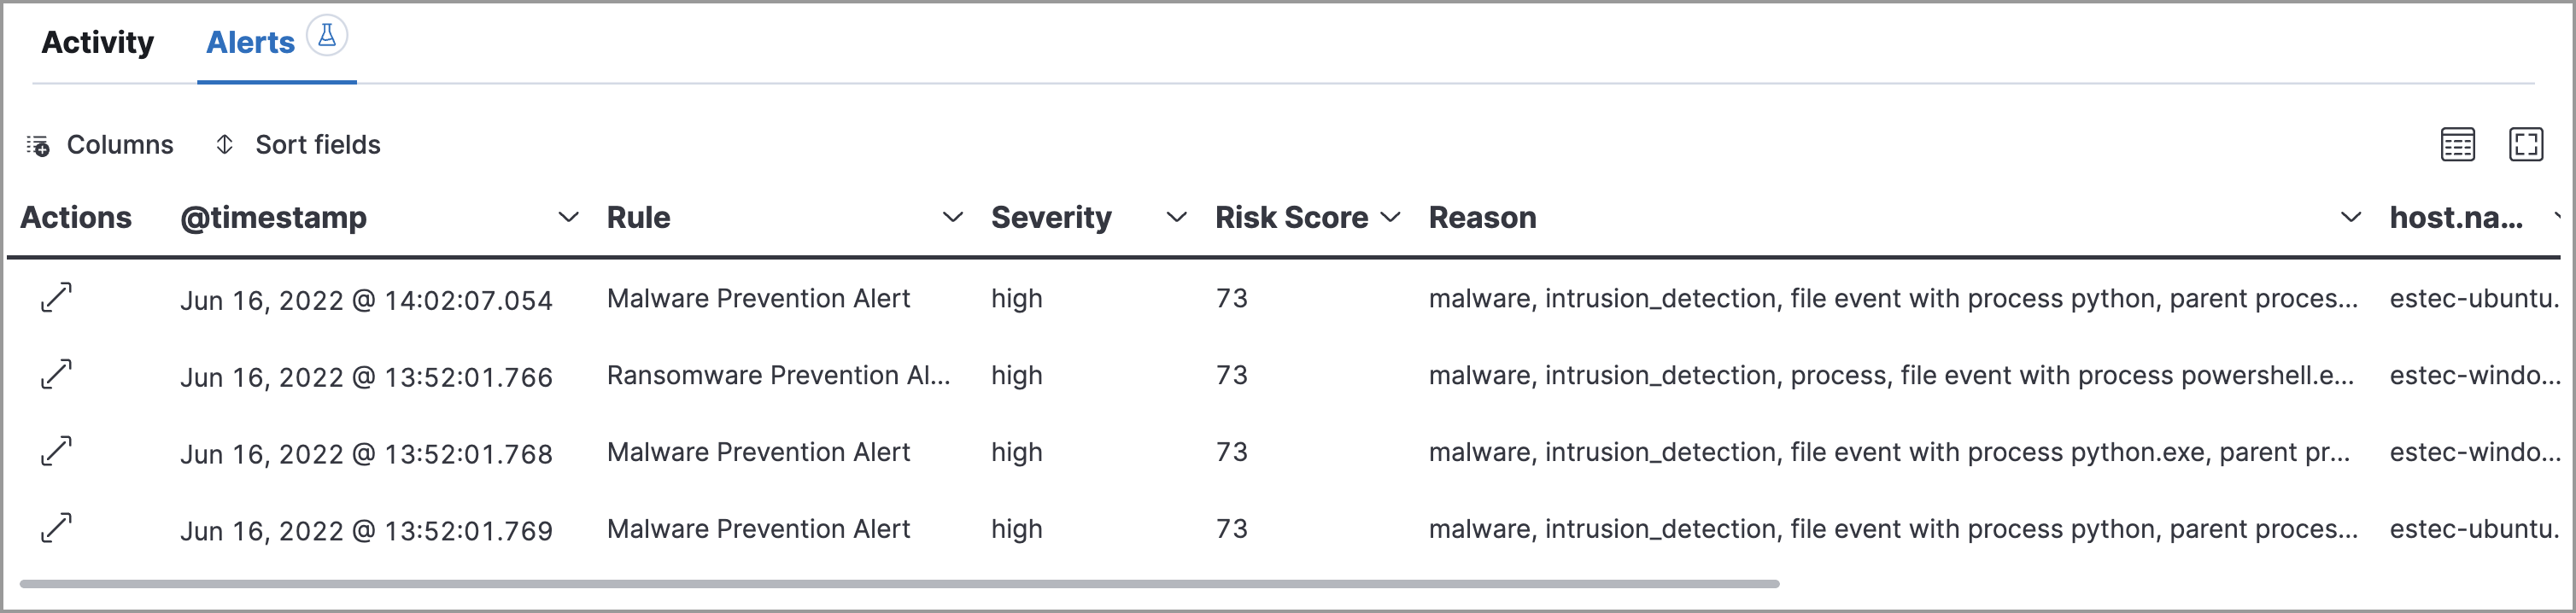
To explore the alerts attached to a case, click the Alerts tab. In the table, alerts are organized from oldest to newest. To view alert details, click the View details button.
Add a Lens visualization
editThis functionality is in beta and is subject to change. The design and code is less mature than official GA features and is being provided as-is with no warranties. Beta features are not subject to the support SLA of official GA features.
Add a Lens visualization to your case to portray event and alert data through charts and graphs.
To add a Lens visualization to a comment within your case:
- Click the Visualization button. The Add visualization dialog appears.
-
Select an existing visualization from your Visualize Library or create a new visualization.
Set an absolute time range for your visualization. This ensures your visualization doesn’t change over time after you save it to your case, and provides important context for others managing the case.
-
Save the visualization to your Visualize Library by clicking the Save to library button (optional).
- Enter a title and description for the visualization.
- Choose if you want to keep the Update panel on Security activated. This option is activated by default and automatically adds the visualization to your Visualize Library.
- After you’ve finished creating your visualization, click Save and return to go back to your case.
- Click Preview to show how the visualization will appear in the case comment.
- Click Add Comment to add the visualization to your case.
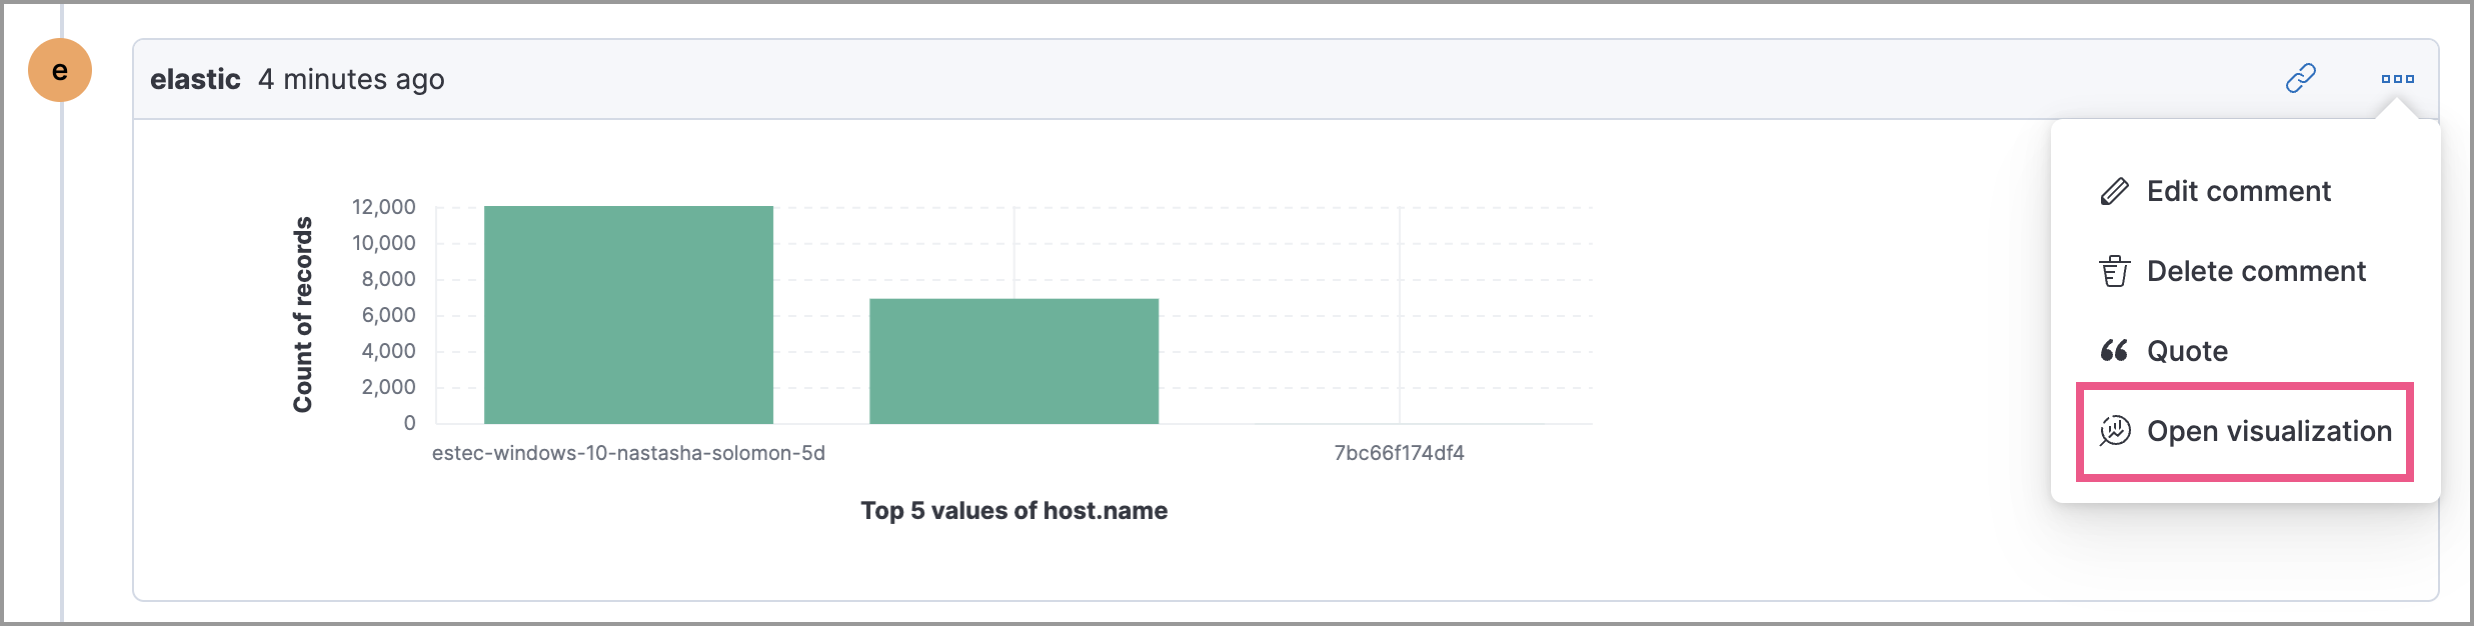
Once a visualization has been added to a case, it cannot be modified or deleted. However, you can interact with the visualization by clicking the Open Visualization option in the comment menu.
Export and import cases
editCases can be exported and imported as saved objects using the Kibana Saved Objects UI.
Before importing Lens visualizations, Timelines, or alerts into a space, ensure their data is present. Without it, they won’t work after being imported.
Export a case
editUse the Export option to move cases between different Kibana instances. When you export a case, the following data is exported to a newline-delimited JSON (.ndjson) file:
- Case details
- User actions
- Text string comments
- Case alerts
- Lens visualizations (exported as JSON blobs).
Alerts attached to cases are not exported. You must re-add them after importing cases.
To export a case:
- Open the main menu, go to Stack Management → Kibana, then select the Saved Objects tab.
- Search for the case by choosing a saved object type or entering the case title in the search bar.
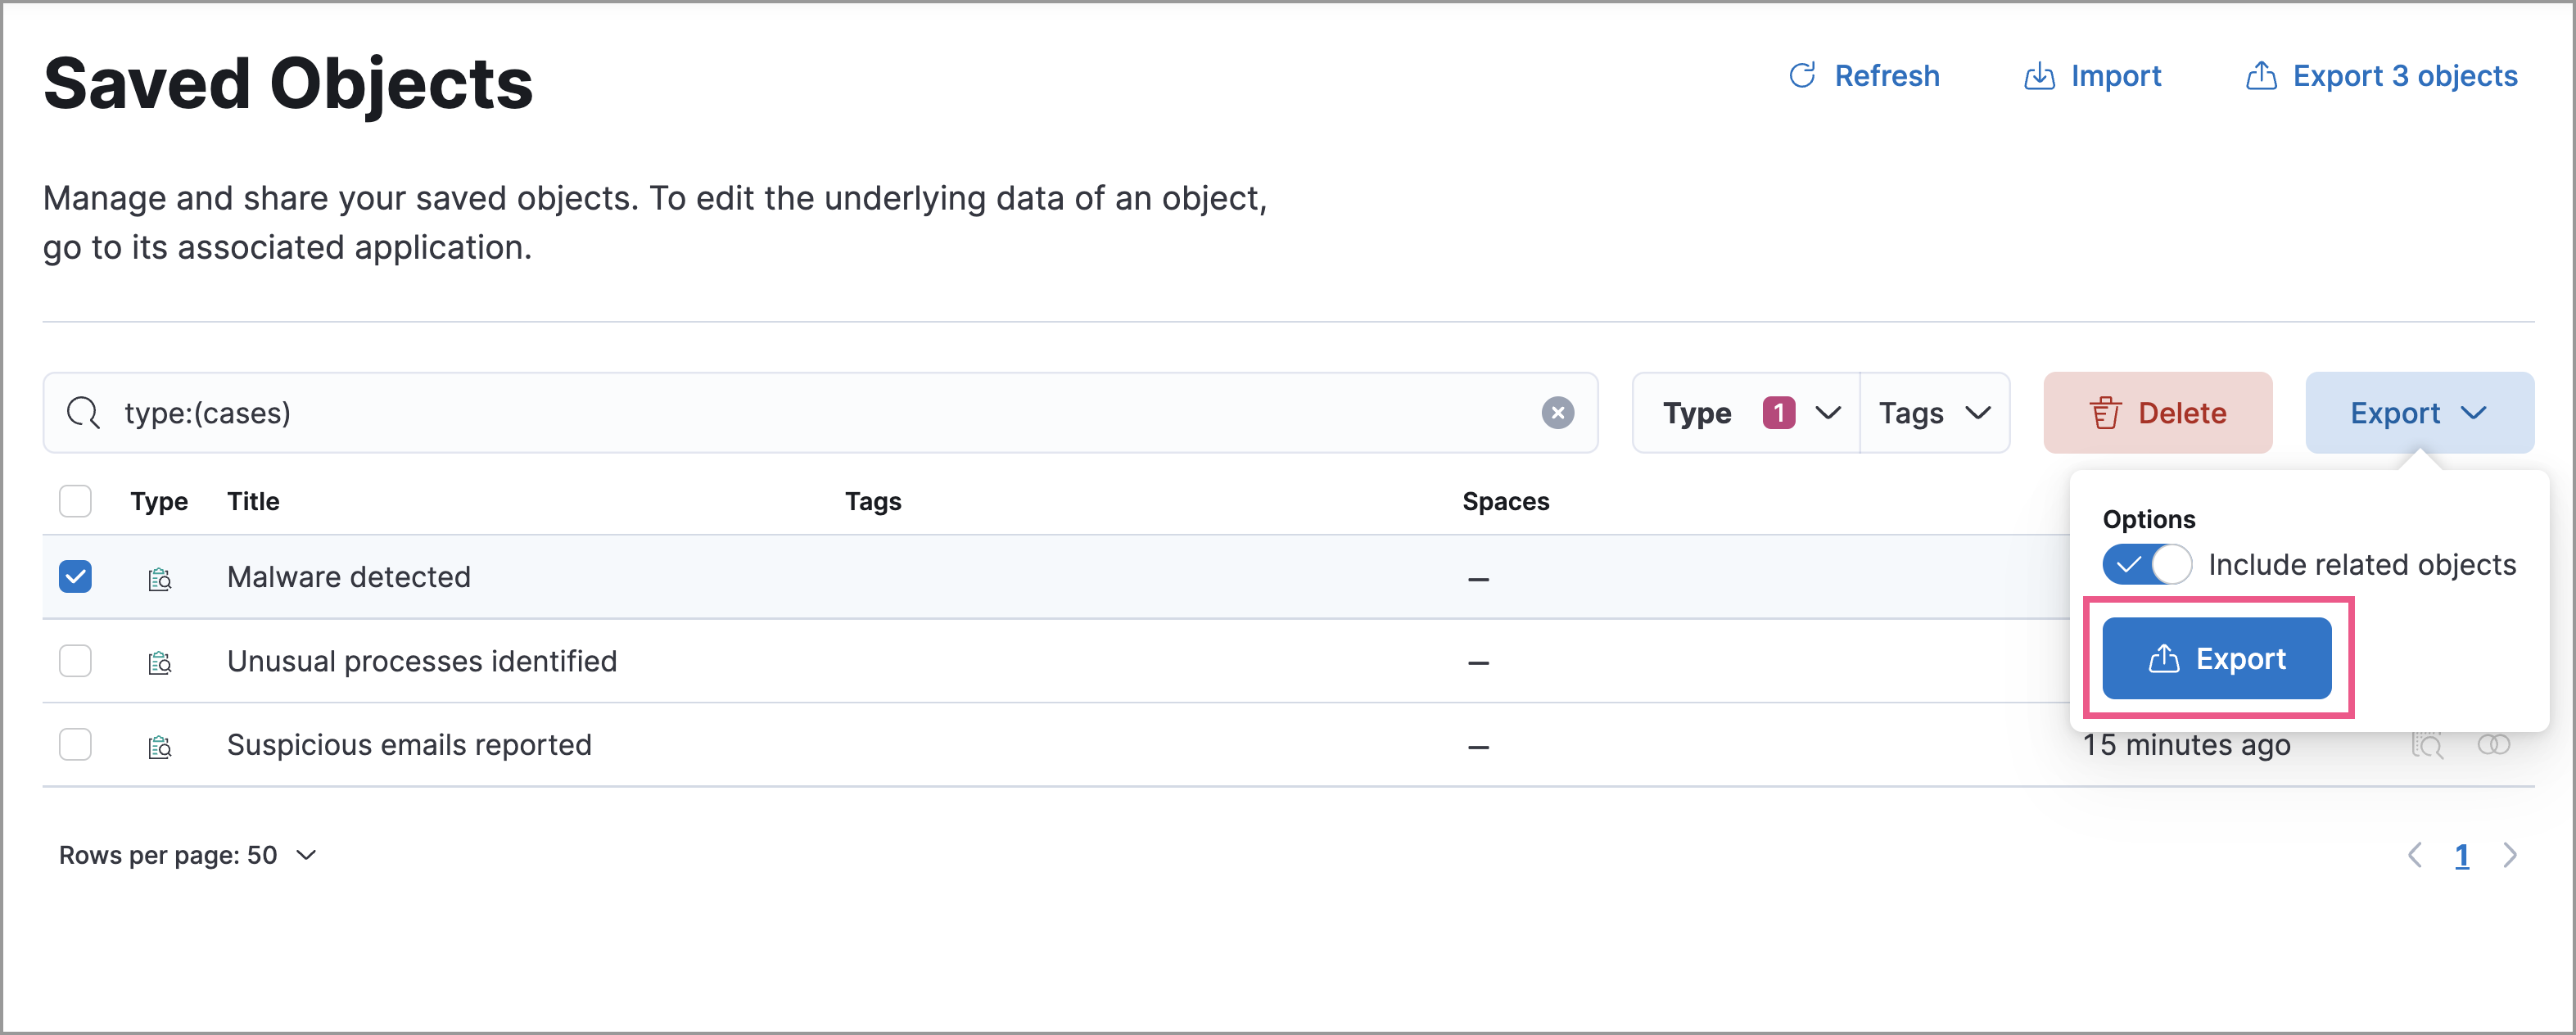
- Select one or more cases, then click the Export button.
-
Click Export. A confirmation message that your file is downloading displays.
Keep the Include related objects option enabled to ensure connectors are exported too.
Import a case
editTo import a case:
- Open the main menu, go to Stack Management → Kibana, then select the Saved Objects tab.
- Click Import.
- Select the NDJSON file containing the exported case and configure the import options.
- Click Import.
-
Review the import log and click Done.
Be mindful of the following:
- If the imported case had connectors attached to it, you’ll be prompted to re-authenticate the connectors. To do so, click Go to connectors on the Import saved objects flyout and complete the necessary steps. Alternatively, open the main menu, then go to Stack Management → Alerts and Insights → Rules and Connectors → Connectors to access connectors.
- If the imported case had attached alerts, verify that the alerts’ source documents exist in the environment. Case features that interact with alerts (such as the Alert details flyout and rule details page) rely on the alerts’ source documents to function.