What’s new in 8.0
editWhat’s new in 8.0
editHere are the highlights of what’s new and improved in Elastic Security!
For detailed information about this release, check out the Release notes.
Other versions: 7.17 | 7.16 | 7.15 | 7.14 | 7.13 | 7.12 | 7.11 | 7.10 | 7.9
Terminology changes
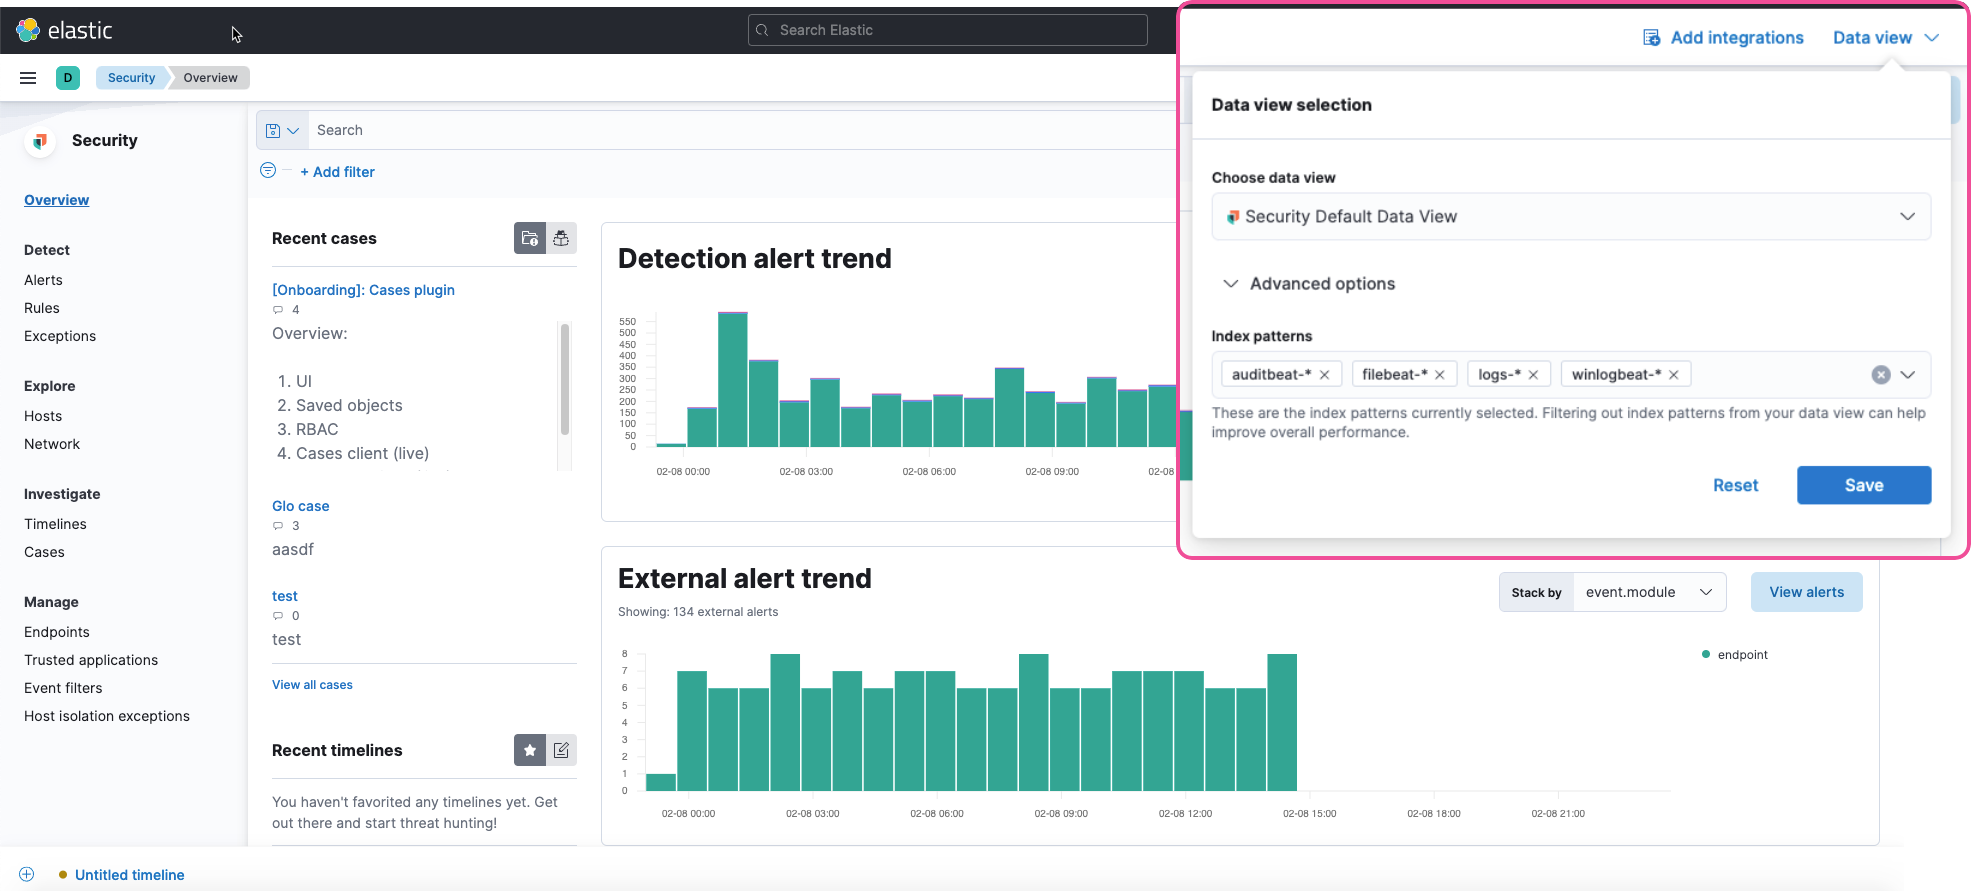
edit"Index patterns" has been renamed to "Data views" in Kibana
A data view defines what specific data to display in Kibana. Each data view points to one or more index patterns, data streams, or index aliases. An index pattern now refers to a string that selects one or more indices. In Elastic Security, the default space in the Security data view is .alerts-security.alerts-default and includes the following index patterns:
-
auditbeat-* -
filebeat-* -
logs-* -
winlogbeat-* -
apm-*-transaction* -
traces-apm* -
endgame-* -
packetbeat-*
To update these defaults, go to Stack Management > Advanced Settings > Security Solution > Elasticsearch indices.
To make the Data view option appear in an environment with legacy alerts, a user with elevated role privileges must visit the Elastic Security app, open a page that displays alert data (such as the Overview page), then refresh the page. The user’s role privileges must allow them to enable the detections feature in a Kibana space. Refer to Enable and access detections for more information.
Index and privilege updates
editIndex changes
-
The system index for detection alerts has been renamed from
.siem-signals-<space-id>to.alerts-security.alerts-<space-id>. Users who use the detections feature require new privileges for these indices. Users also need new privileges to view alerts and preview rules. Refer to Detections prerequisites and requirements for a breakdown of what privileges are required to access specific detection features. -
The schema used for alert documents in Elastic Security has changed. Users that access documents in the
.siem-signals-<space-id>indices, such as customer dashboards, will need to update their API queries and scripts to operate correctly on the new 8.x alert documents. Refer to the new alert schema to view legacy 7.x field names and the updated field names for 8.x, and review best practices on how to query alert indices. - You can now grant feature privileges for Cases separately from privileges for Elastic Security. Refer to Cases prerequisites for more information.
- New Full Disk Access approval is needed when deploying Elastic Endpoint on macOS. Refer to Install Elastic Endpoint manually to view installation requirements.
New features and enhancements
editRules page includes enhanced tools and a simplified UI
The Rules page has been enhanced to be more compact and user-friendly so you can analyze information quickly. In addition, on the Rule Monitoring tab, you can now perform the same actions that are available on the main Rules tab, such as modifying or deleting rules, activating or deactivating rules, exporting or importing rules, and duplicating prebuilt rules.
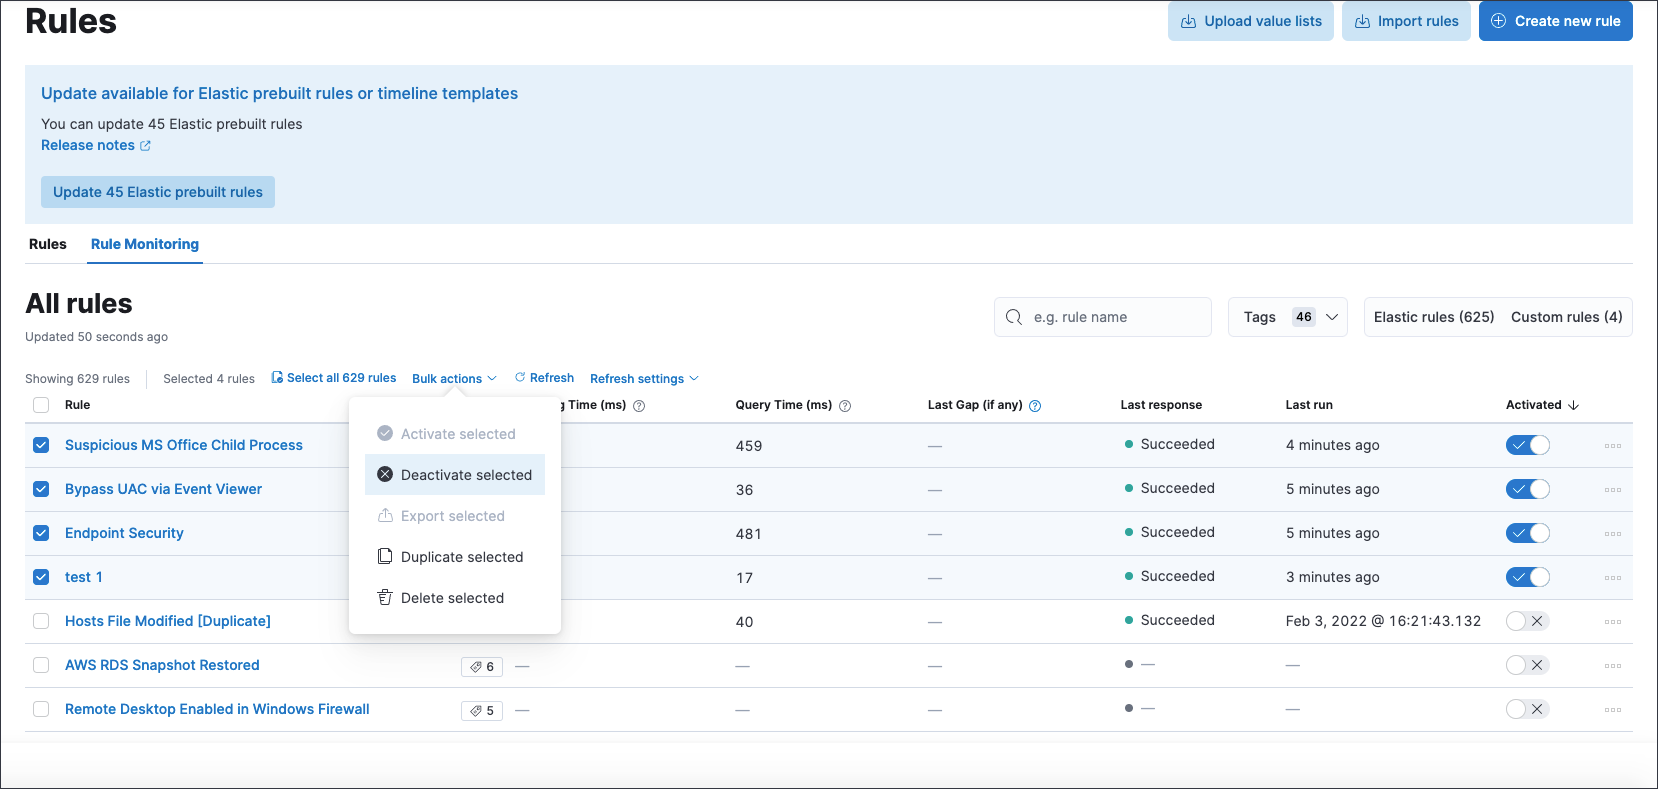
The rule export and import tool now includes any exception lists associated with the rules being exported or imported.
Threat intelligence enhancements
-
An explicit default value (
threat.indicator) has been added to the threat indicator path setting that indicator match rules use when searching indicator indices for threat intelligence data. If a value for the indicator path setting has not been defined before upgrading to 8.0, migrated indicator match rules are given a default value ofthreatintel.indicator. This allows migrated rules to continue using indicator data from Filebeat 7.x indices. -
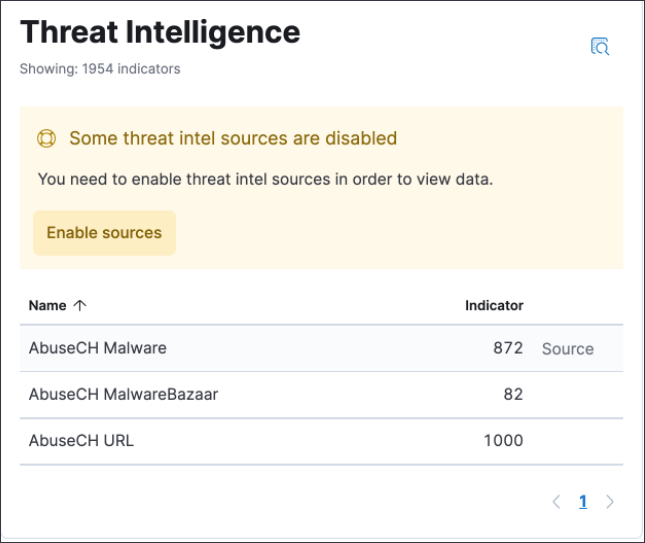
Support for the
threat.feed.namefield has been added in the Alert details flyout and Timeline view. -
You can now use Elastic Agent integrations with the Threat Intelligence view to ingest threat intelligence data into your environment. The Threat Intelligence view also supports Filebeat Threat intel module integrations and custom integrations. Refer to Enable threat intelligence integrations for setup instructions.