Suppress detection alerts
editSuppress detection alerts
editAlert suppression allows you to reduce the number of repeated or duplicate detection alerts created by a custom query detection rule.
Normally, when a rule matches multiple source events, it creates multiple alerts, one for each event. When alert suppression is configured, matching events are grouped by their values in a specified field, and only one alert is created for each group. You can configure alert suppression to create alerts each time the rule runs, or once within a specified time window. You can also specify multiple fields to group events by unique combinations of values.
The Elastic Security app displays several indicators in the Alerts table and the alert details flyout when a detection alert is created with alert suppression enabled. You can view the original events associated with suppressed alerts by investigating the alert in Timeline.
Alert suppression is not available for Elastic prebuilt rules. However, if you want to suppress alerts for a prebuilt rule, you can duplicate it, then configure alert suppression on the duplicated rule.
Configure alert suppression
editYou can configure alert suppression when you create or edit a custom query rule. Refer to Create a custom query rule for detailed instructions.
-
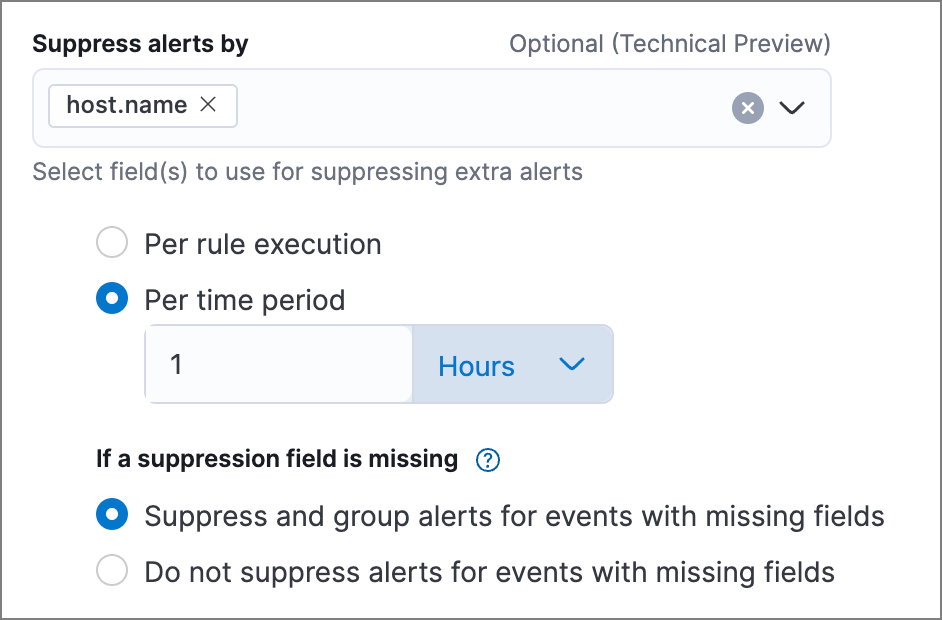
When configuring the rule type (the Define rule step for a new rule, or the Definition tab for an existing rule), enter one or more field names in Suppress alerts by.
If you specify a field with multiple values, an alert grouping is created for each value. For example, if you suppress alerts by
destination.ipof[127.0.0.1, 127.0.0.2, 127.0.0.3], alerts will be suppressed separately for each matching value of127.0.0.1,127.0.0.2, and127.0.0.3. -
Select how often to create alerts for duplicate events:
- Per rule execution: Create an alert each time the rule runs and matches one or more events.
-
Per time period: Create one alert for all matching events within a specified time window, beginning when the rule first matches an event and creates the alert.
For example, if a rule runs every 5 minutes but you don’t need alerts that frequently, you can set the suppression time period to a longer time, such as 1 hour. If the rule matches an event, it creates an alert at that time, and for the next hour, it’ll suppress any subsequent matches.
-
Under If a suppression field is missing, choose how to handle events with missing suppression fields (events in which one or more of the Suppress alerts by fields don’t exist):
-
Suppress and group alerts for events with missing fields: Create one alert for each group of events with missing fields. Missing fields get a
nullvalue, which is used to group and suppress alerts. - Do not suppress alerts for events with missing fields: Create a separate alert for each matching event. This basically falls back to normal alert creation for events with missing suppression fields.
-
Suppress and group alerts for events with missing fields: Create one alert for each group of events with missing fields. Missing fields get a
- Configure other rule settings, then save and enable the rule.
Use the Rule preview before saving the rule to visualize how alert suppression will affect the alerts created, based on historical data.
Confirm suppressed alerts
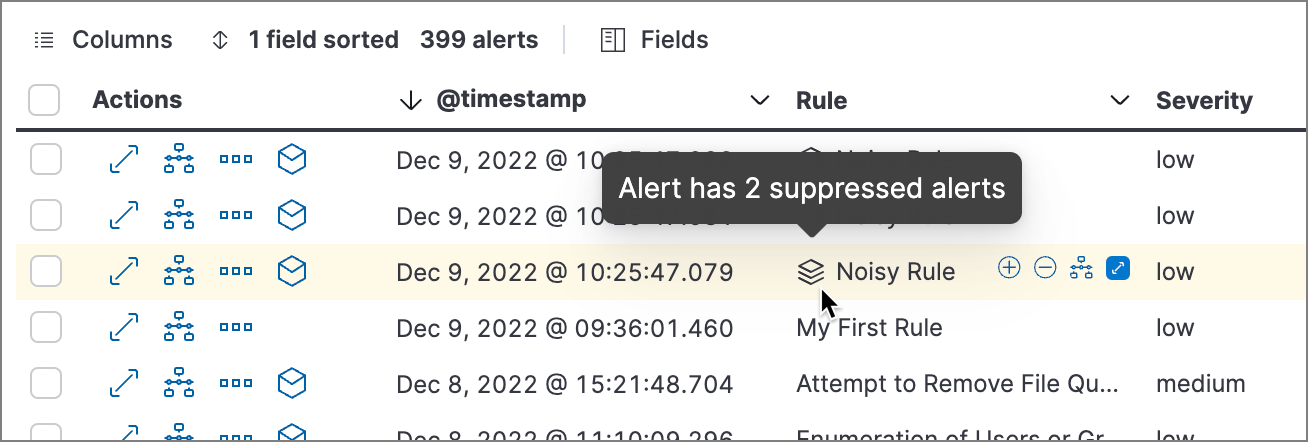
editThe Elastic Security app displays several indicators of whether a detection alert was created with alert suppression enabled, and how many duplicate alerts were suppressed.
After an alert is moved to the Closed status, it will no longer suppress new alerts. To prevent interruptions or unexpected changes in suppression, avoid closing alerts before the suppression interval ends.
-
Alerts table — Icon in the Rule column. Hover to display the number of suppressed alerts:
-
Alerts table — Column for suppressed alerts count. Select Fields to open the fields browser, then add
kibana.alert.suppression.docs_countto the table.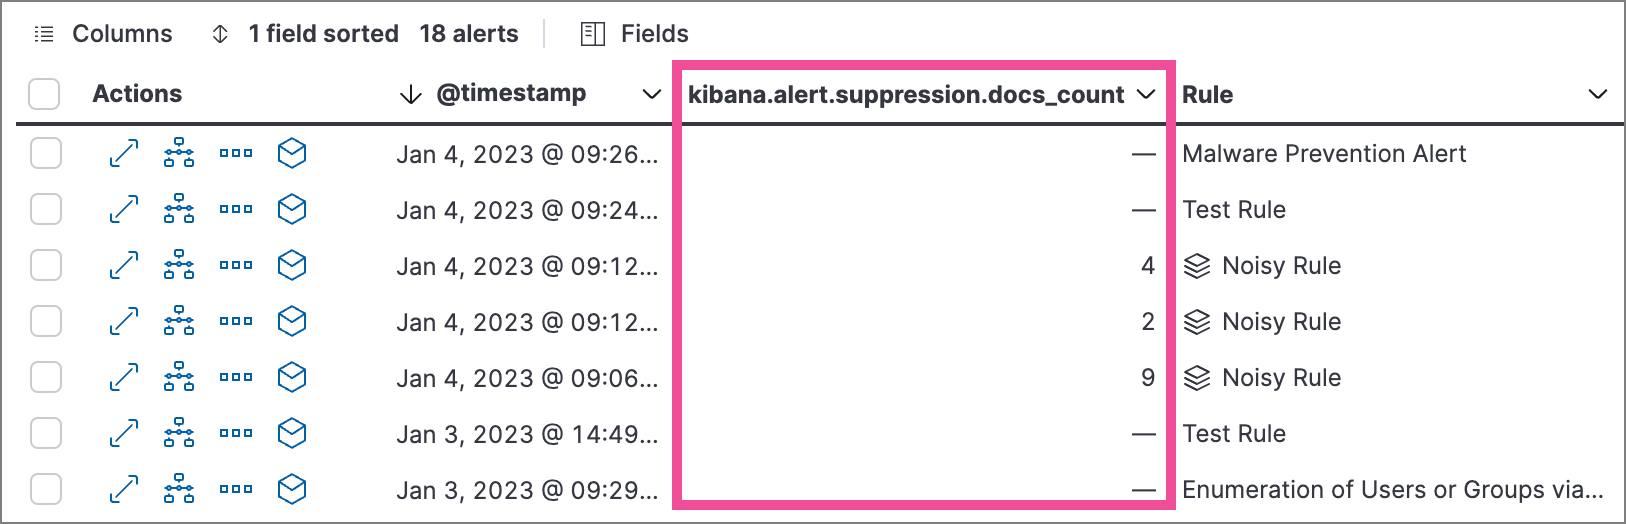
-
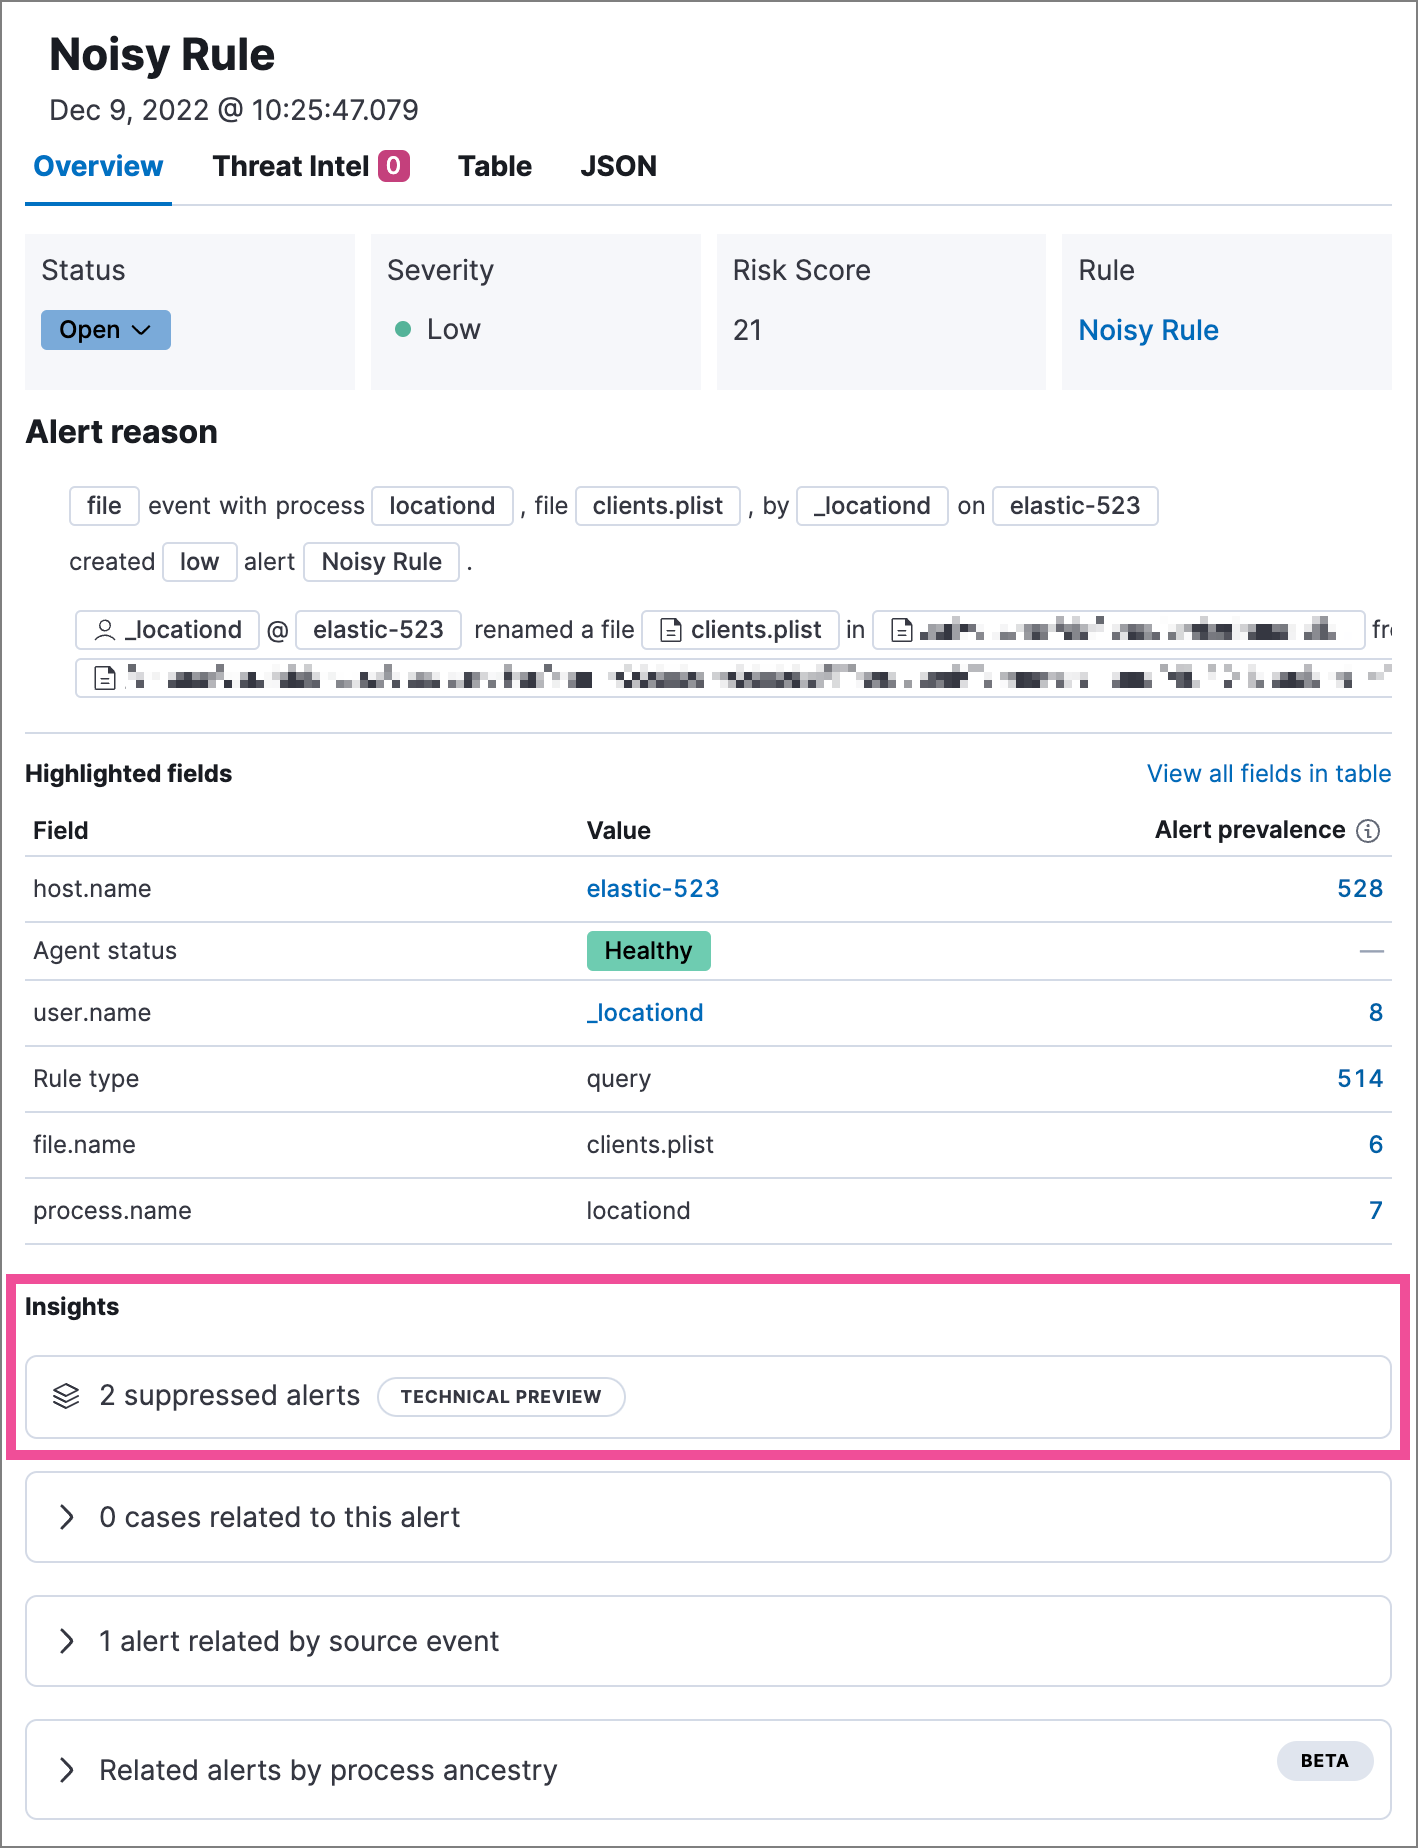
Alert details flyout — Insights section:
Investigate events for suppressed alerts
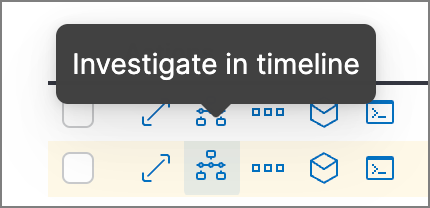
editWith alert suppression, detection alerts aren’t created for the grouped source events, but you can still retrieve the events for further analysis or investigation. Do one of the following to open Timeline with the original events associated with both the created alert and the suppressed alerts:
-
Alerts table — Select Investigate in timeline in the Actions column.
- Alert details flyout — Select Take action → Investigate in timeline.