What’s new in 8.4
editWhat’s new in 8.4
editHere are the highlights of what’s new and improved in Elastic Security. For detailed information about this release, check out the Release notes.
Other versions: 8.3 | 8.2 | 8.1 | 8.0 | 7.17 | 7.16 | 7.15 | 7.14 | 7.13 | 7.12 | 7.11 | 7.10 | 7.9
New navigation menu
editElastic Security has a new navigation menu, designed to group related pages, highlight commonly visited areas, and easily access important workflows for a streamlined experience.
Kubernetes and Cloud Security Posture enhancements
editThe Kubernetes dashboard provides insight into Linux process data from your Kubernetes clusters. You can also deploy an Elastic DaemonSet to your Kubernetes clusters to collect session data. This data, which includes new Kubernetes-specific fields, appears in summary on the Kubernetes dashboard.
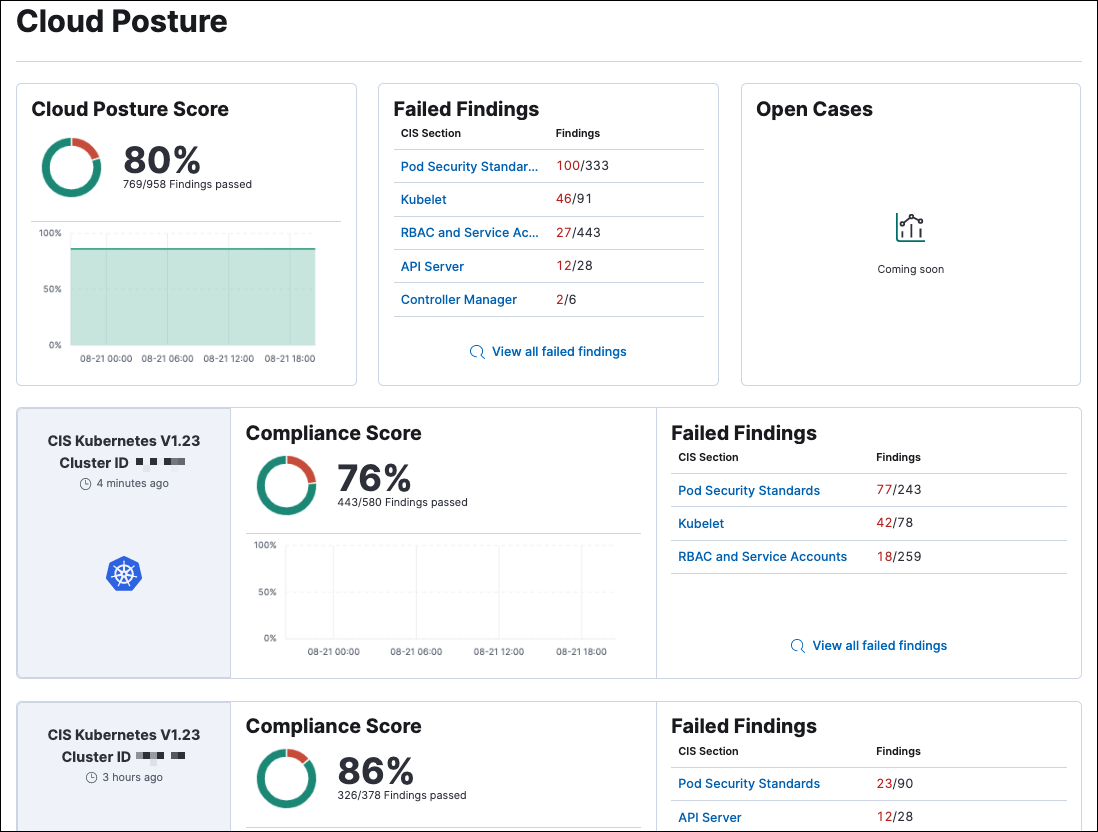
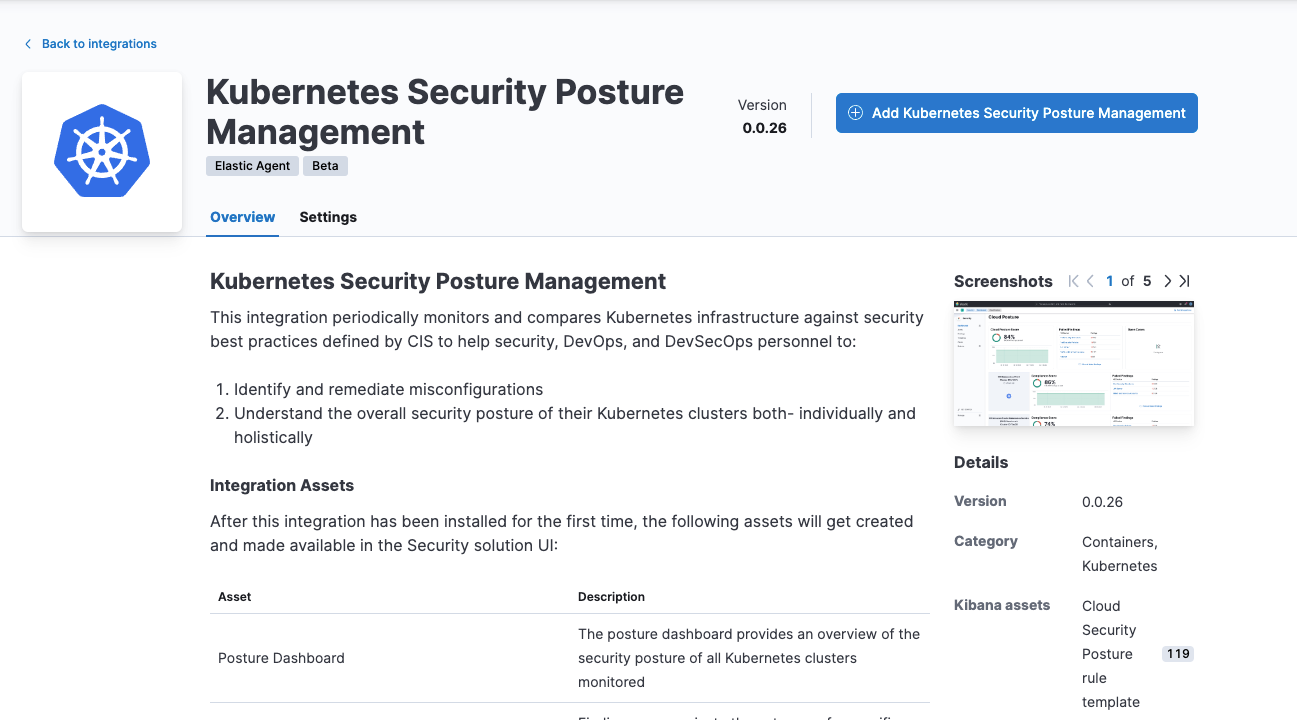
The Cloud Posture dashboard allows you to check your Kubernetes infrastructure’s configuration against security best practices, and provides steps for remediating any issues it identifies.
To get these insights, you first need to install the Kubernetes Security Posture Management integration, which is now in beta.
Detection rules enhancements
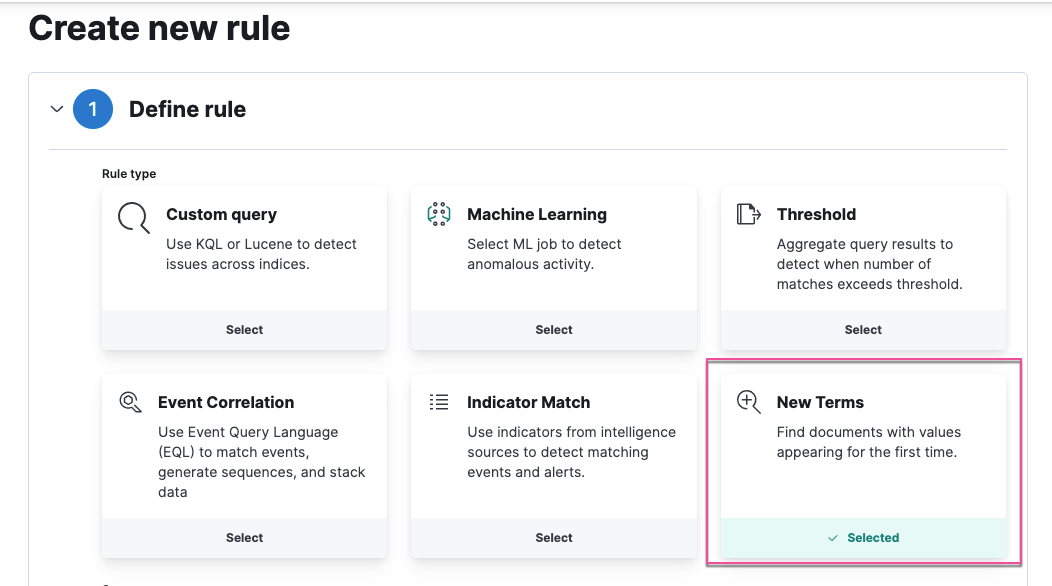
editNew terms rule
A new terms rule generates an alert for each new term it detects in source documents within a specified time range.
Data views available in rule creation
When you create a rule, you can now specify data views as the data source in order to use runtime fields, which are associated with a data view.
Fallback to @timestamp is configurable when timestamp override is defined
This feature allows you to disable @timestamp as a fallback timestamp field when you’ve defined a timestamp override.
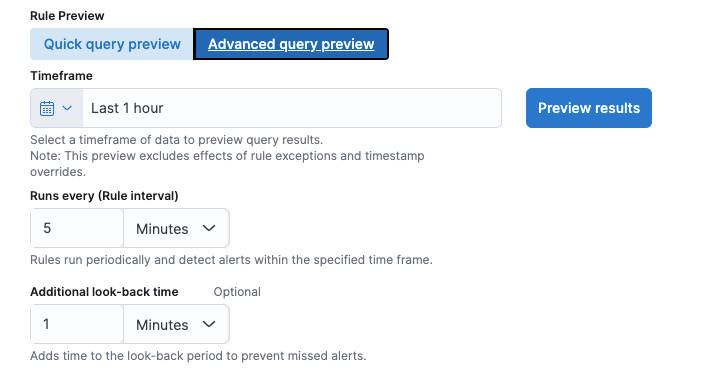
New option to preview rules
The new Advanced query preview option allows you to set the preview’s timeframe, rule interval, and look-back time, providing more control to fine-tune query results.
Improved bulk action handling for detection rules
When you select prebuilt and custom rules and attempt to perform a bulk action that can only be done on custom rules, Elastic Security now determines which rules are compatible and performs the action only on those rules.
Wildcards supported in detection rule exceptions
Wildcards are now supported when defining exceptions for detection rules, and accept new operators matches and does not match.
New prebuilt rules
18 new prebuilt rules were added in 8.4.0.
Prerequisites and setup guides for Elastic prebuilt rules
Elastic prebuilt rules now provide additional information to help you identify and meet their prerequisites. You can confirm these requirements in the Related integrations and Required fields sections of a rule’s details page, and consult its Setup guide for additional guidance.
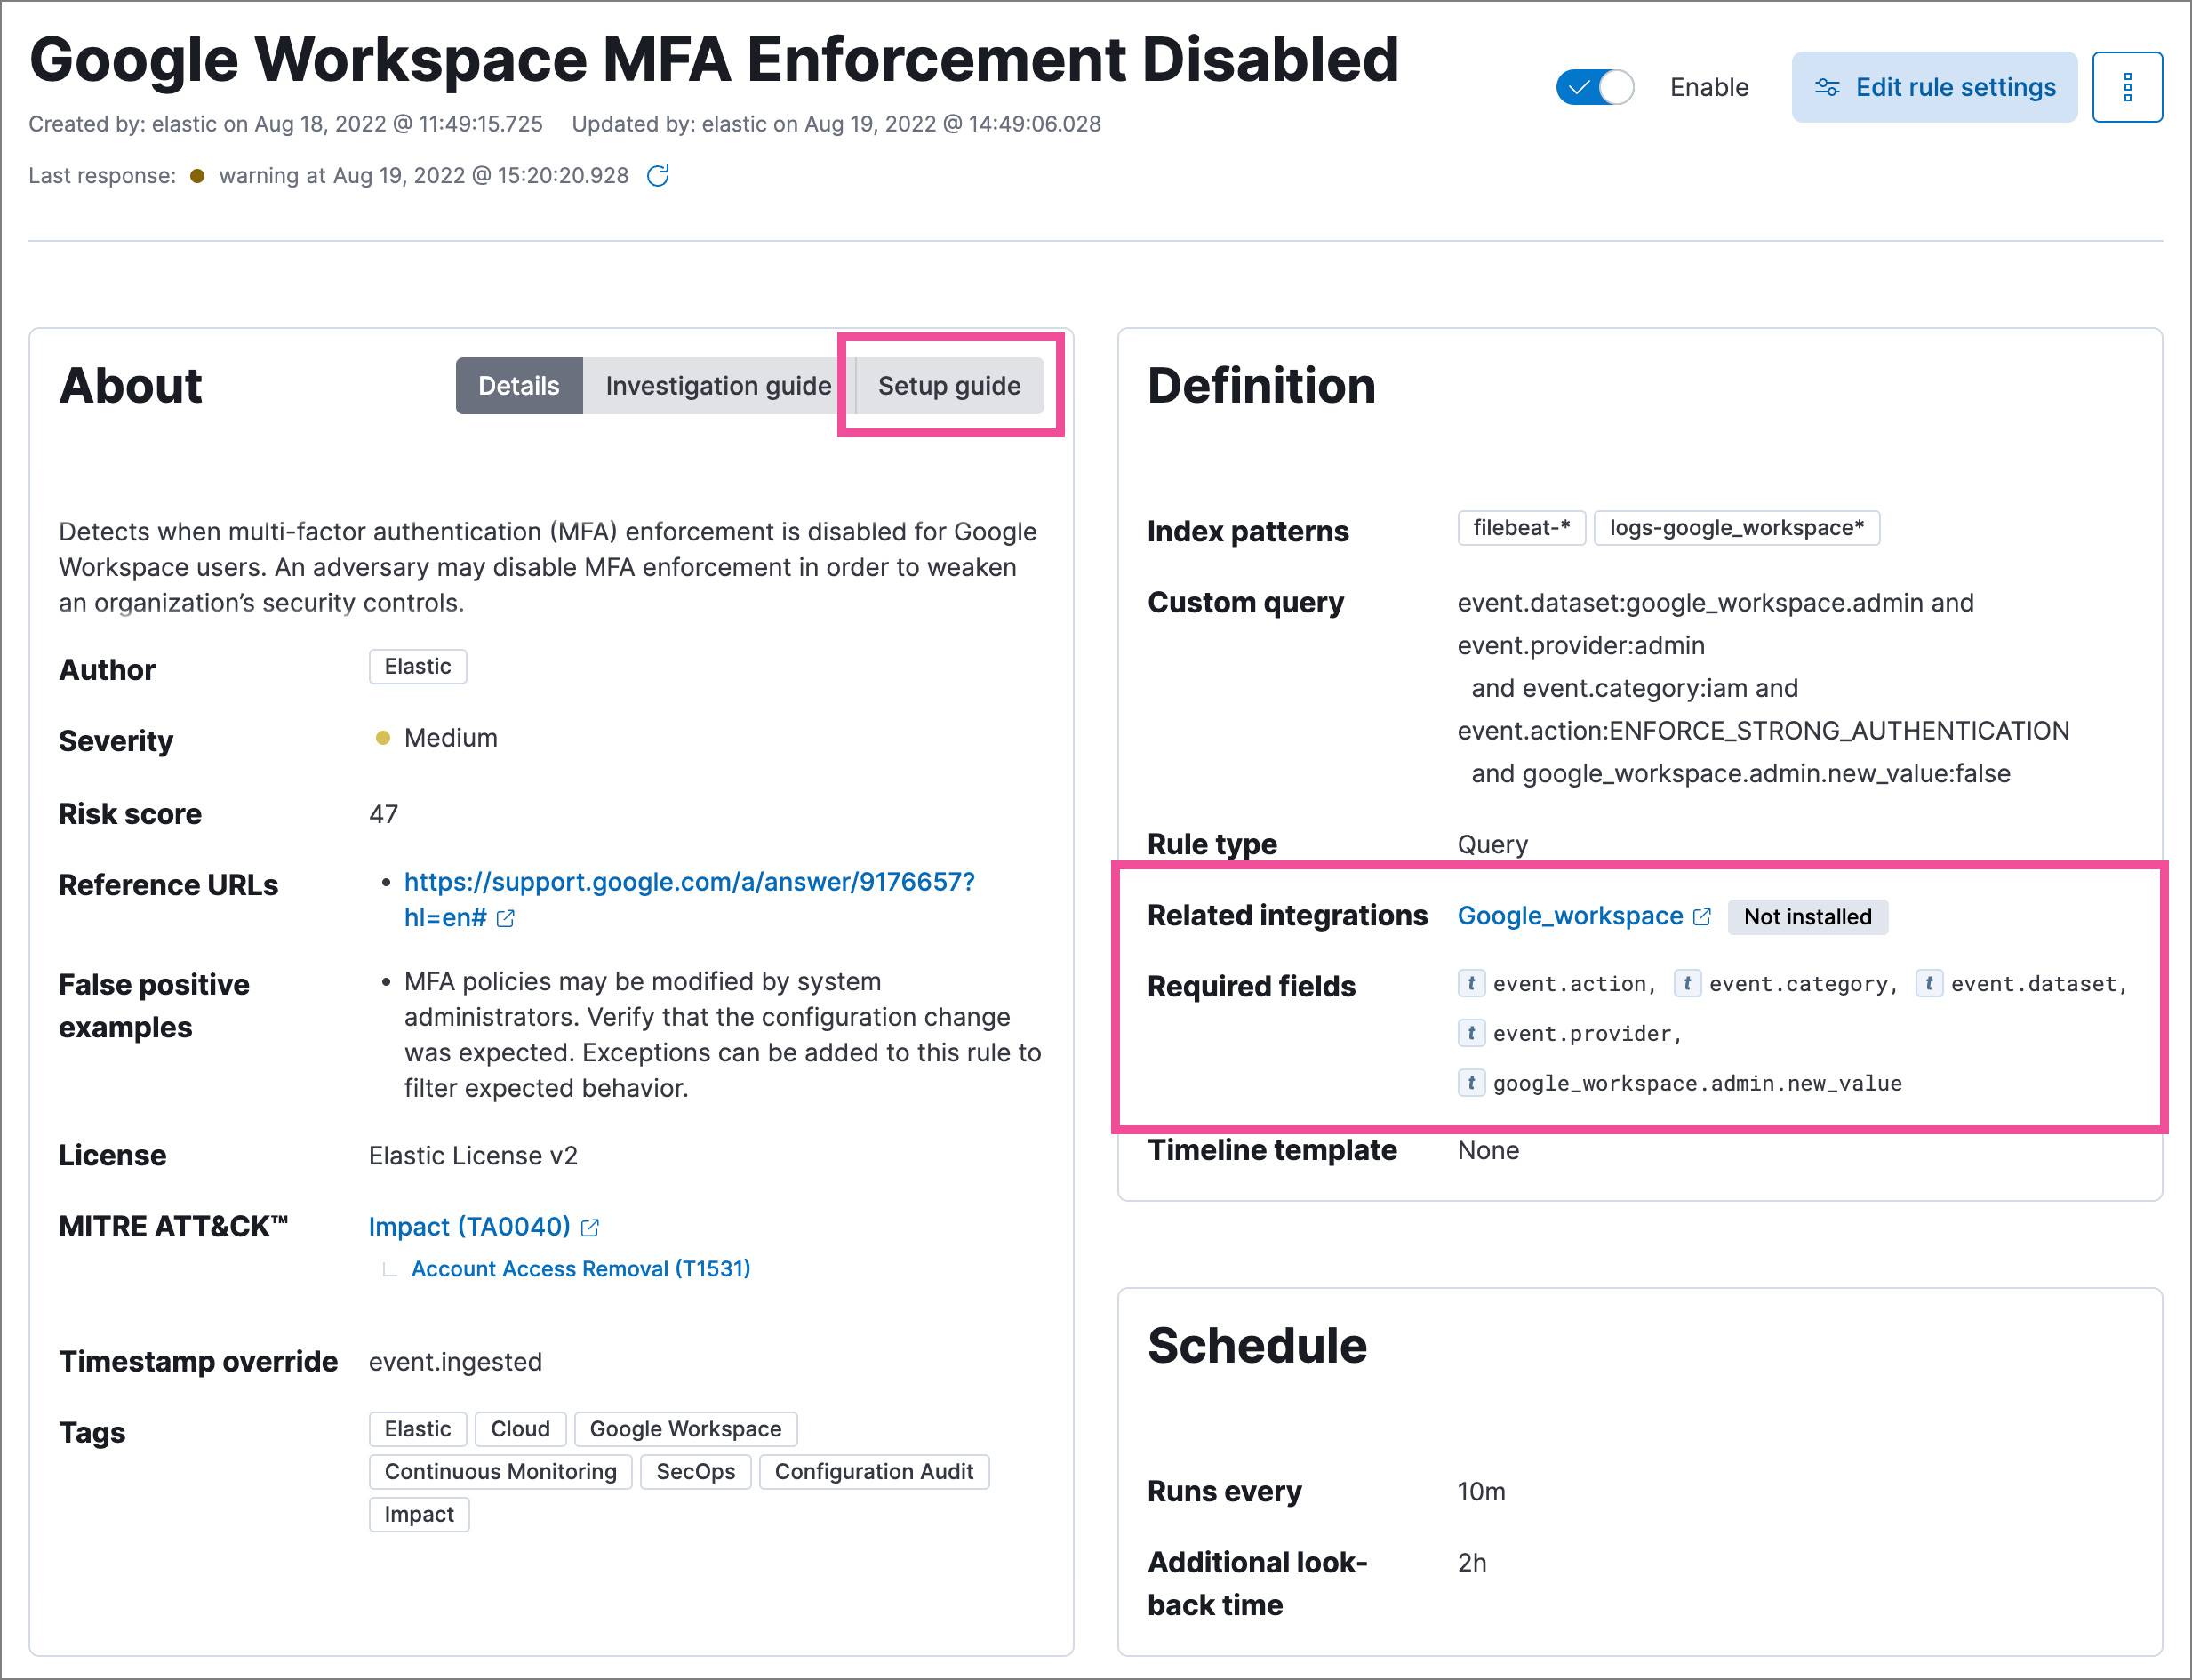
Content for these new sections is delivered in a prebuilt rules update, independent of Elastic Stack release versioning.
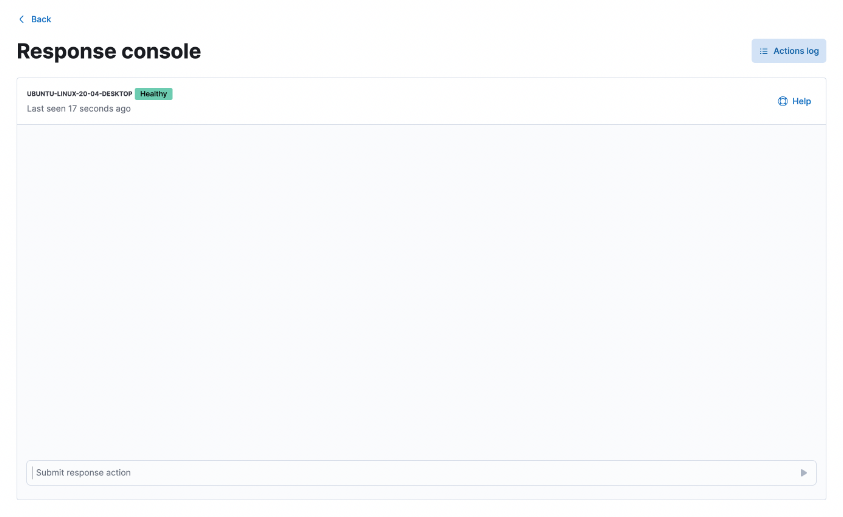
Response console for endpoint response actions
editThe new response console allows you to perform response actions on an endpoint using a terminal-like interface. You can enter action commands and receive almost immediate feedback. Actions are also logged in the endpoint’s actions log for reference.
Troubleshooting "Unhealthy" status for Elastic Agent
editIntegration policy errors and statuses are now provided in Fleet and Elastic Security to help troubleshoot when an Elastic Agent has an "unhealthy" status.
Alerts enhancements
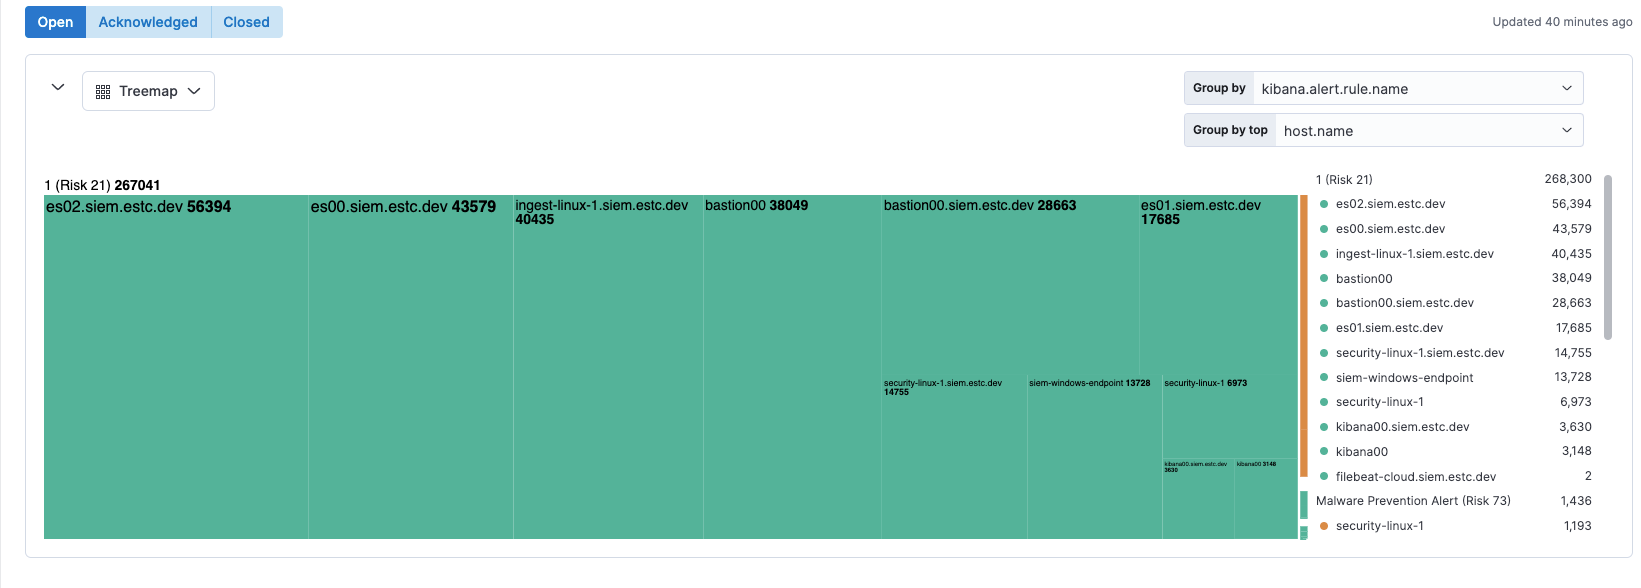
editNew Alerts page visualizations
The Alerts page now displays a single visualization pane, with a menu to select Table, Trend, or Treemap. Treemap is a new view that shows alert distribution as proportionally-sized tiles. This view helps you quickly triage the most critical alerts.
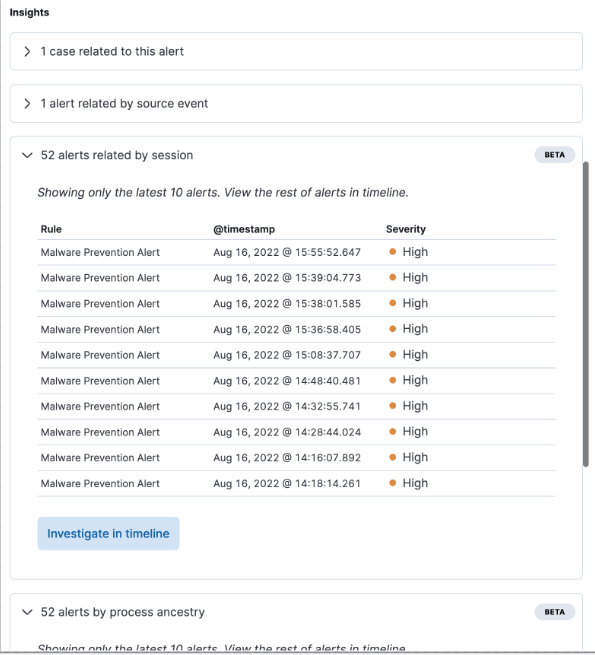
New Insights section in alert details
The Alert details flyout now has a new Insights section, which shows users how an alert is related to other alerts and provides options to investigate related alerts. You can leverage this information to quickly find patterns between alerts, then take action.
Process event analyzer now includes alerts
You can now view alerts associated with an event when viewing the event in the process analyzer. This allows you to examine and compare alerts with the same source event.
This functionality requires a Platinum or Enterprise subscription, and the xpack.securitySolution.enableExperimental: ['insightsRelatedAlertsByProcessAncestry'] feature flag must be added to the kibana.yml file.)
Cases enhancements
editNew Webhook - Case Management case connector
The Webhook - Case Management connector allows you to build a custom connector for any third-party case/ticket management system. This offers more flexibility when deciding what third-party case/ticket management system you want to send cases and case updates to.
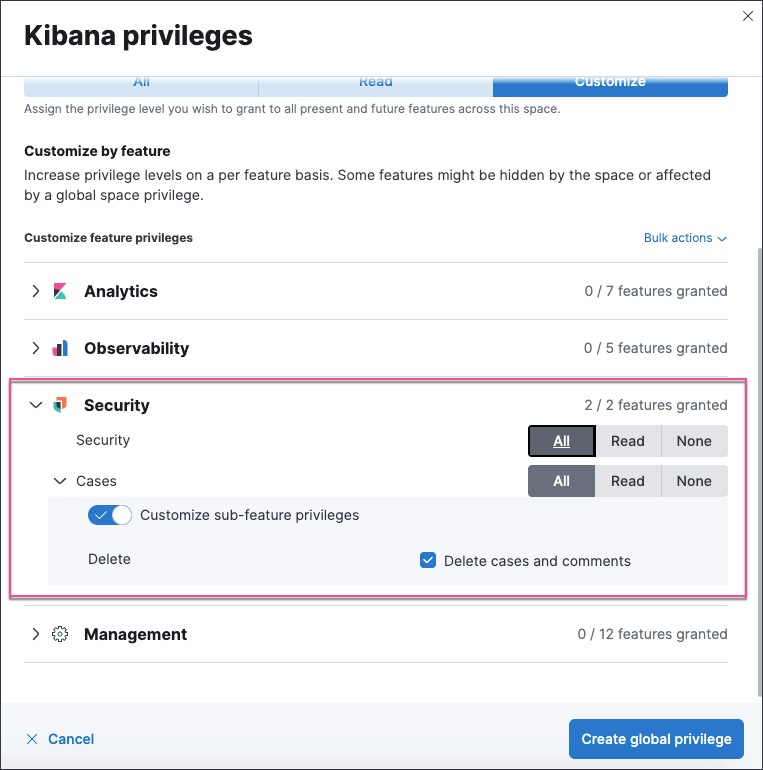
New sub-feature privilege for cases
The Delete cases and comments sub-feature privilege determines whether a user can delete cases and comments. Users with current All access to cases are automatically granted the delete privilege upon upgrading to 8.4. However, users with current read access to cases are not automatically granted the delete privilege upon upgrading to 8.4. An admin can modify these user privileges.
Endpoint enhancements
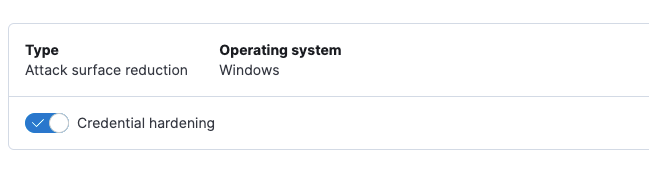
editNew credential hardening protection
You can now configure credential hardening protection in an integration policy. Credential hardening prevents attackers from stealing credentials stored in Windows system process memory. Turn on the toggle to remove any overly permissive access rights that aren’t required for standard interaction with the Local Security Authority Subsystem Service (LSASS).
Endpoint self-healing rollback
Endpoint self-healing rollback is a new feature that rolls back file changes and processes on Windows endpoints when enabled protection features generate a prevention alert.
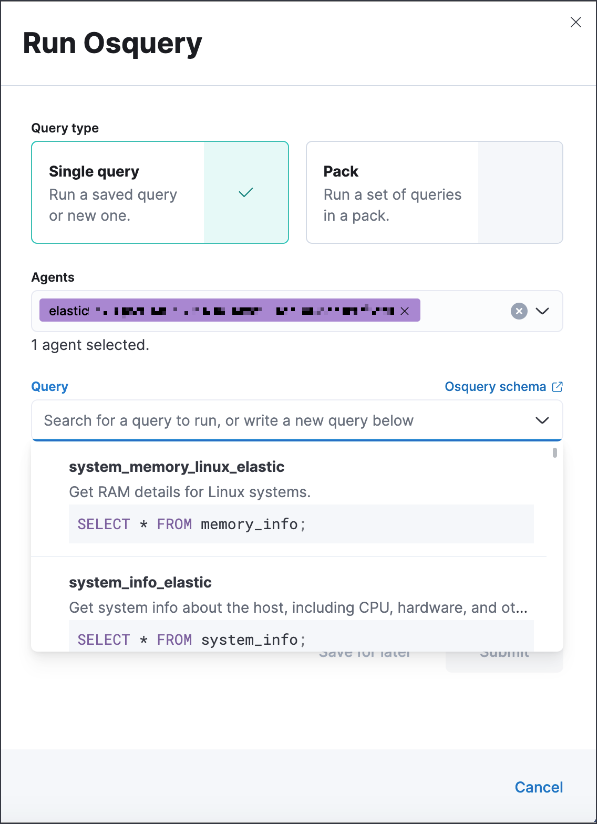
Run query packs from an alert
editWhen running a live query from an alert, you can now choose to run single queries or query packs.
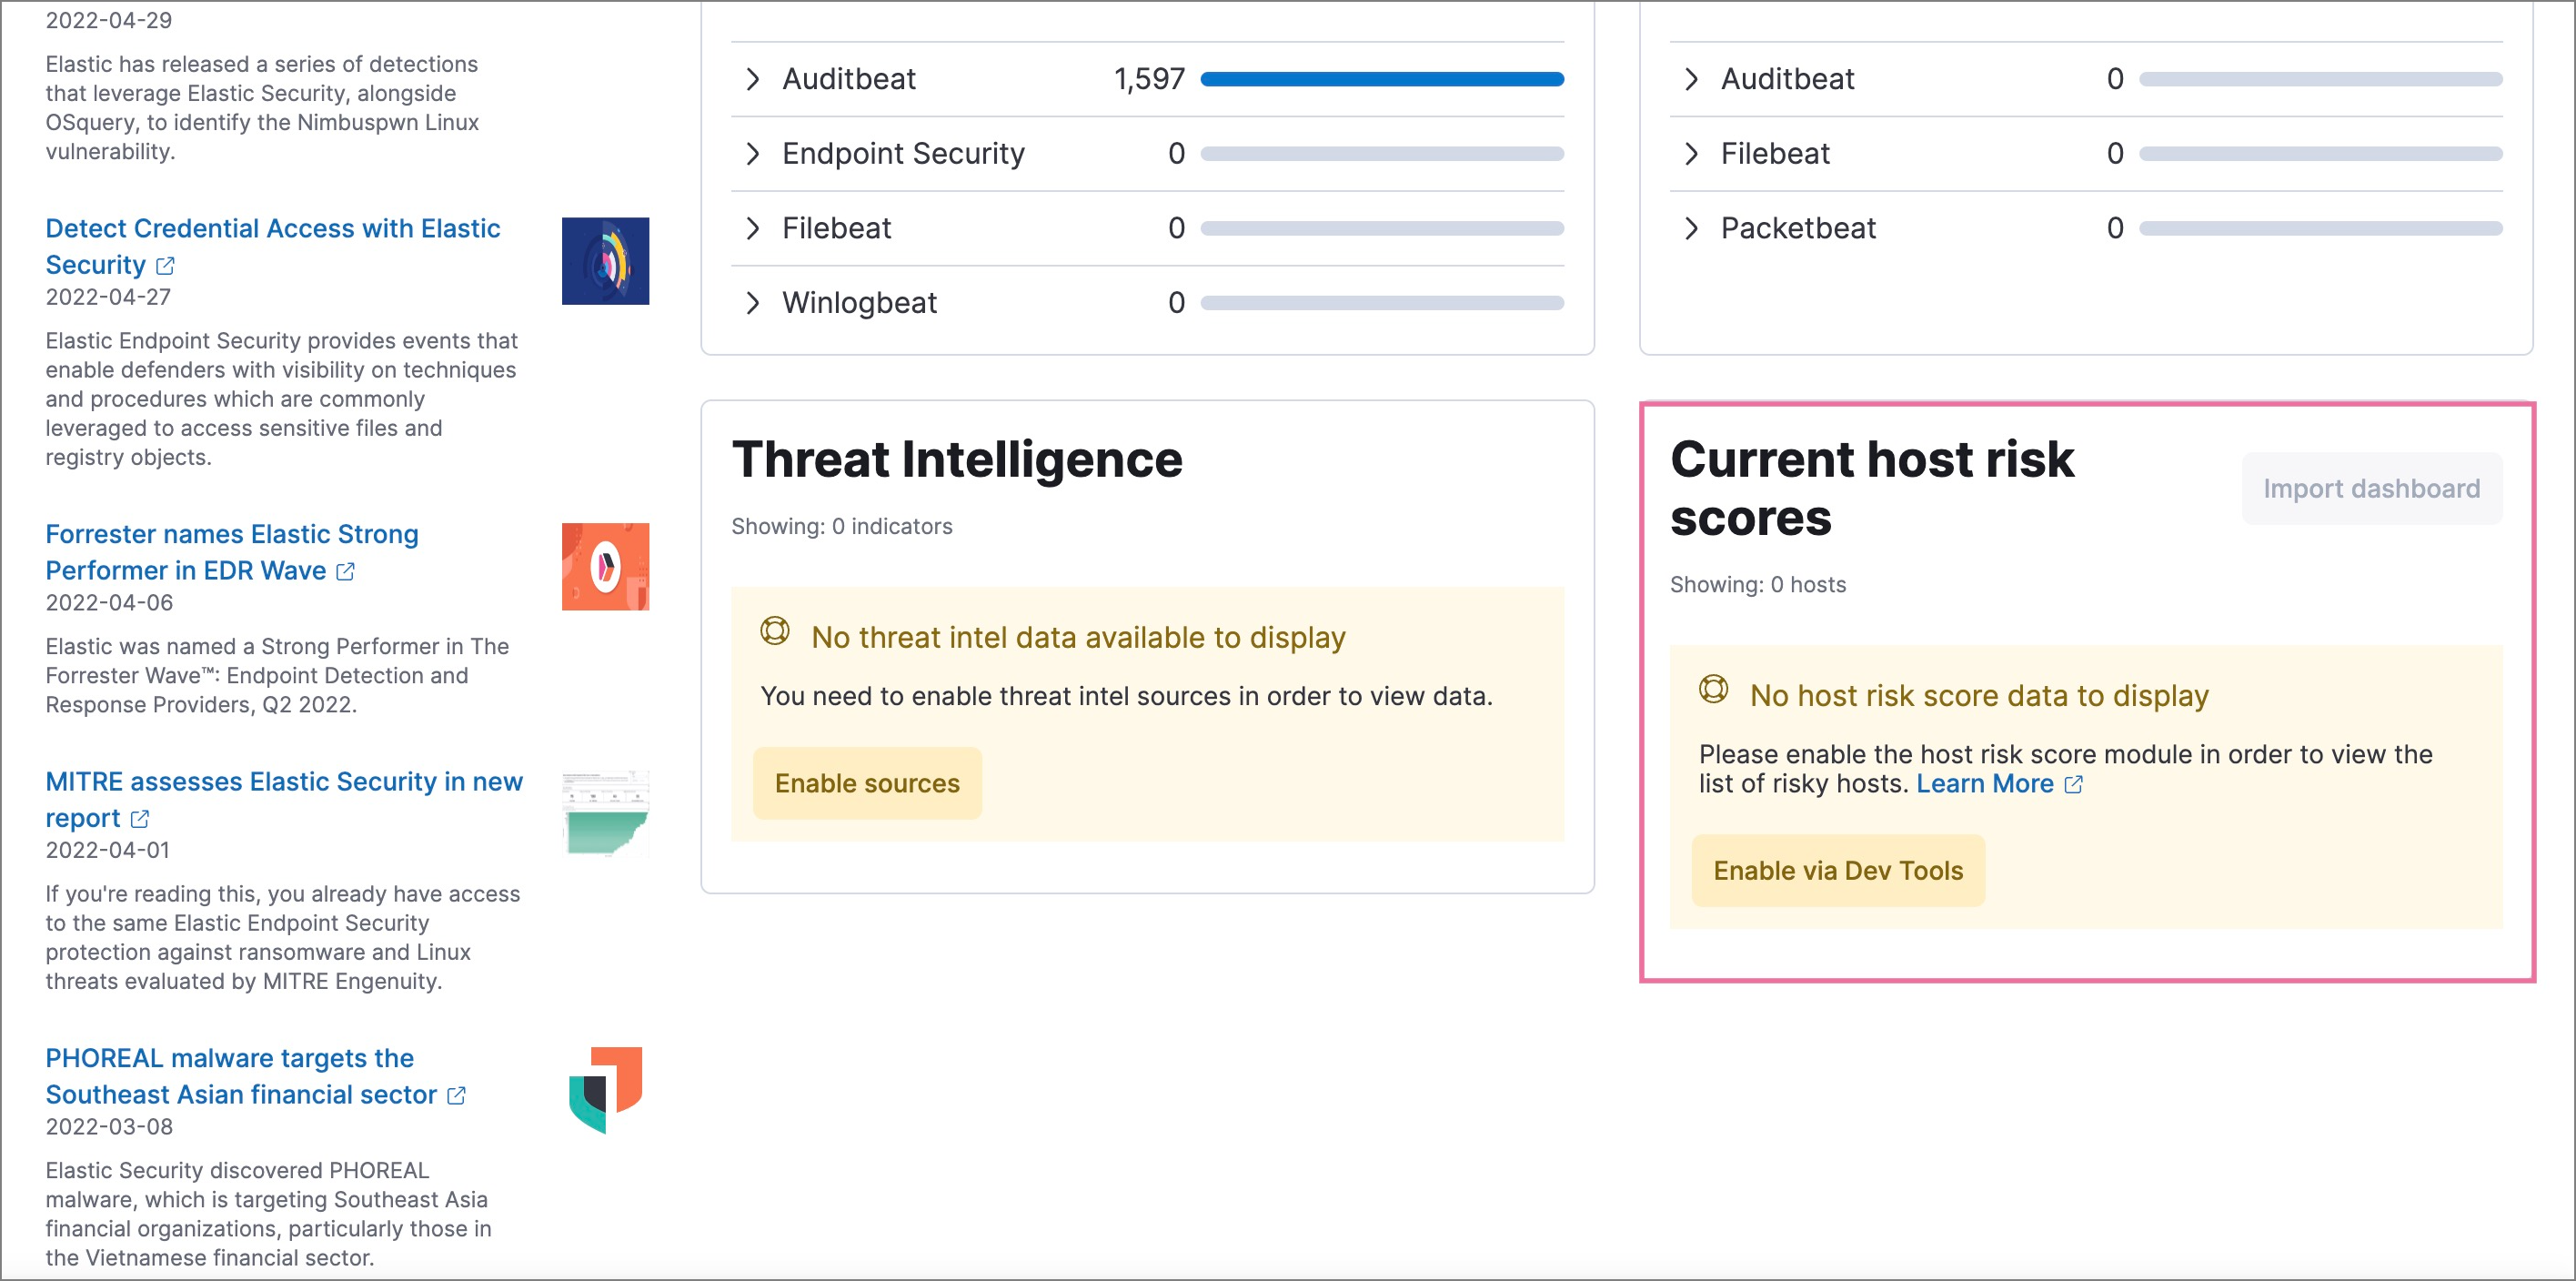
Enhanced workflow for enabling host risk score
editEnabling host risk score is now easier, with enhancements that guide you through the process and pre-populate the Kibana Dev Tools Console with the required scripts.