Host risk score
editHost risk score
editThis feature is available for Elastic Stack versions 7.16.0 and newer.
The host risk score feature highlights risky hosts from within your environment. It utilizes a transform with a scripted metric aggregation to calculate host risk scores based on alerts that were generated within the past five days. The transform runs hourly to update the score as new alerts are generated.
Each rule’s contribution to the host risk score is based on the rule’s risk score (signal.rule.risk_score) and a time decay factor to reduce the impact of stale alerts. The risk score is calculated using a weighted sum where rules with higher time-corrected risk scores also have higher weights. Each host risk score is normalized on a scale of 0 to 100.
Specific host attributes can boost the final risk score. For example, alert activity on a server poses a greater risk than that on a laptop. Therefore, the host risk score is 1.5 times higher if the host is a server. This boosted score is finalized after calculating the weighted sum of the time-corrected risks.
The following table shows how risk levels are applied to a host, based on the normalized risk score:
| Risk level | Host risk score |
|---|---|
Unknown |
< 20 |
Low |
20-40 |
Moderate |
40-70 |
High |
70-90 |
Critical |
> 90 |
Deploy host risk score
editTo enable the host risk score feature, you must have alerts in your environment. If you have none, the Enable via Dev Tools button will be greyed out.
To deploy the host risk score framework in your environment:
-
Enable the
riskyHostsEnabledfeature flag. -
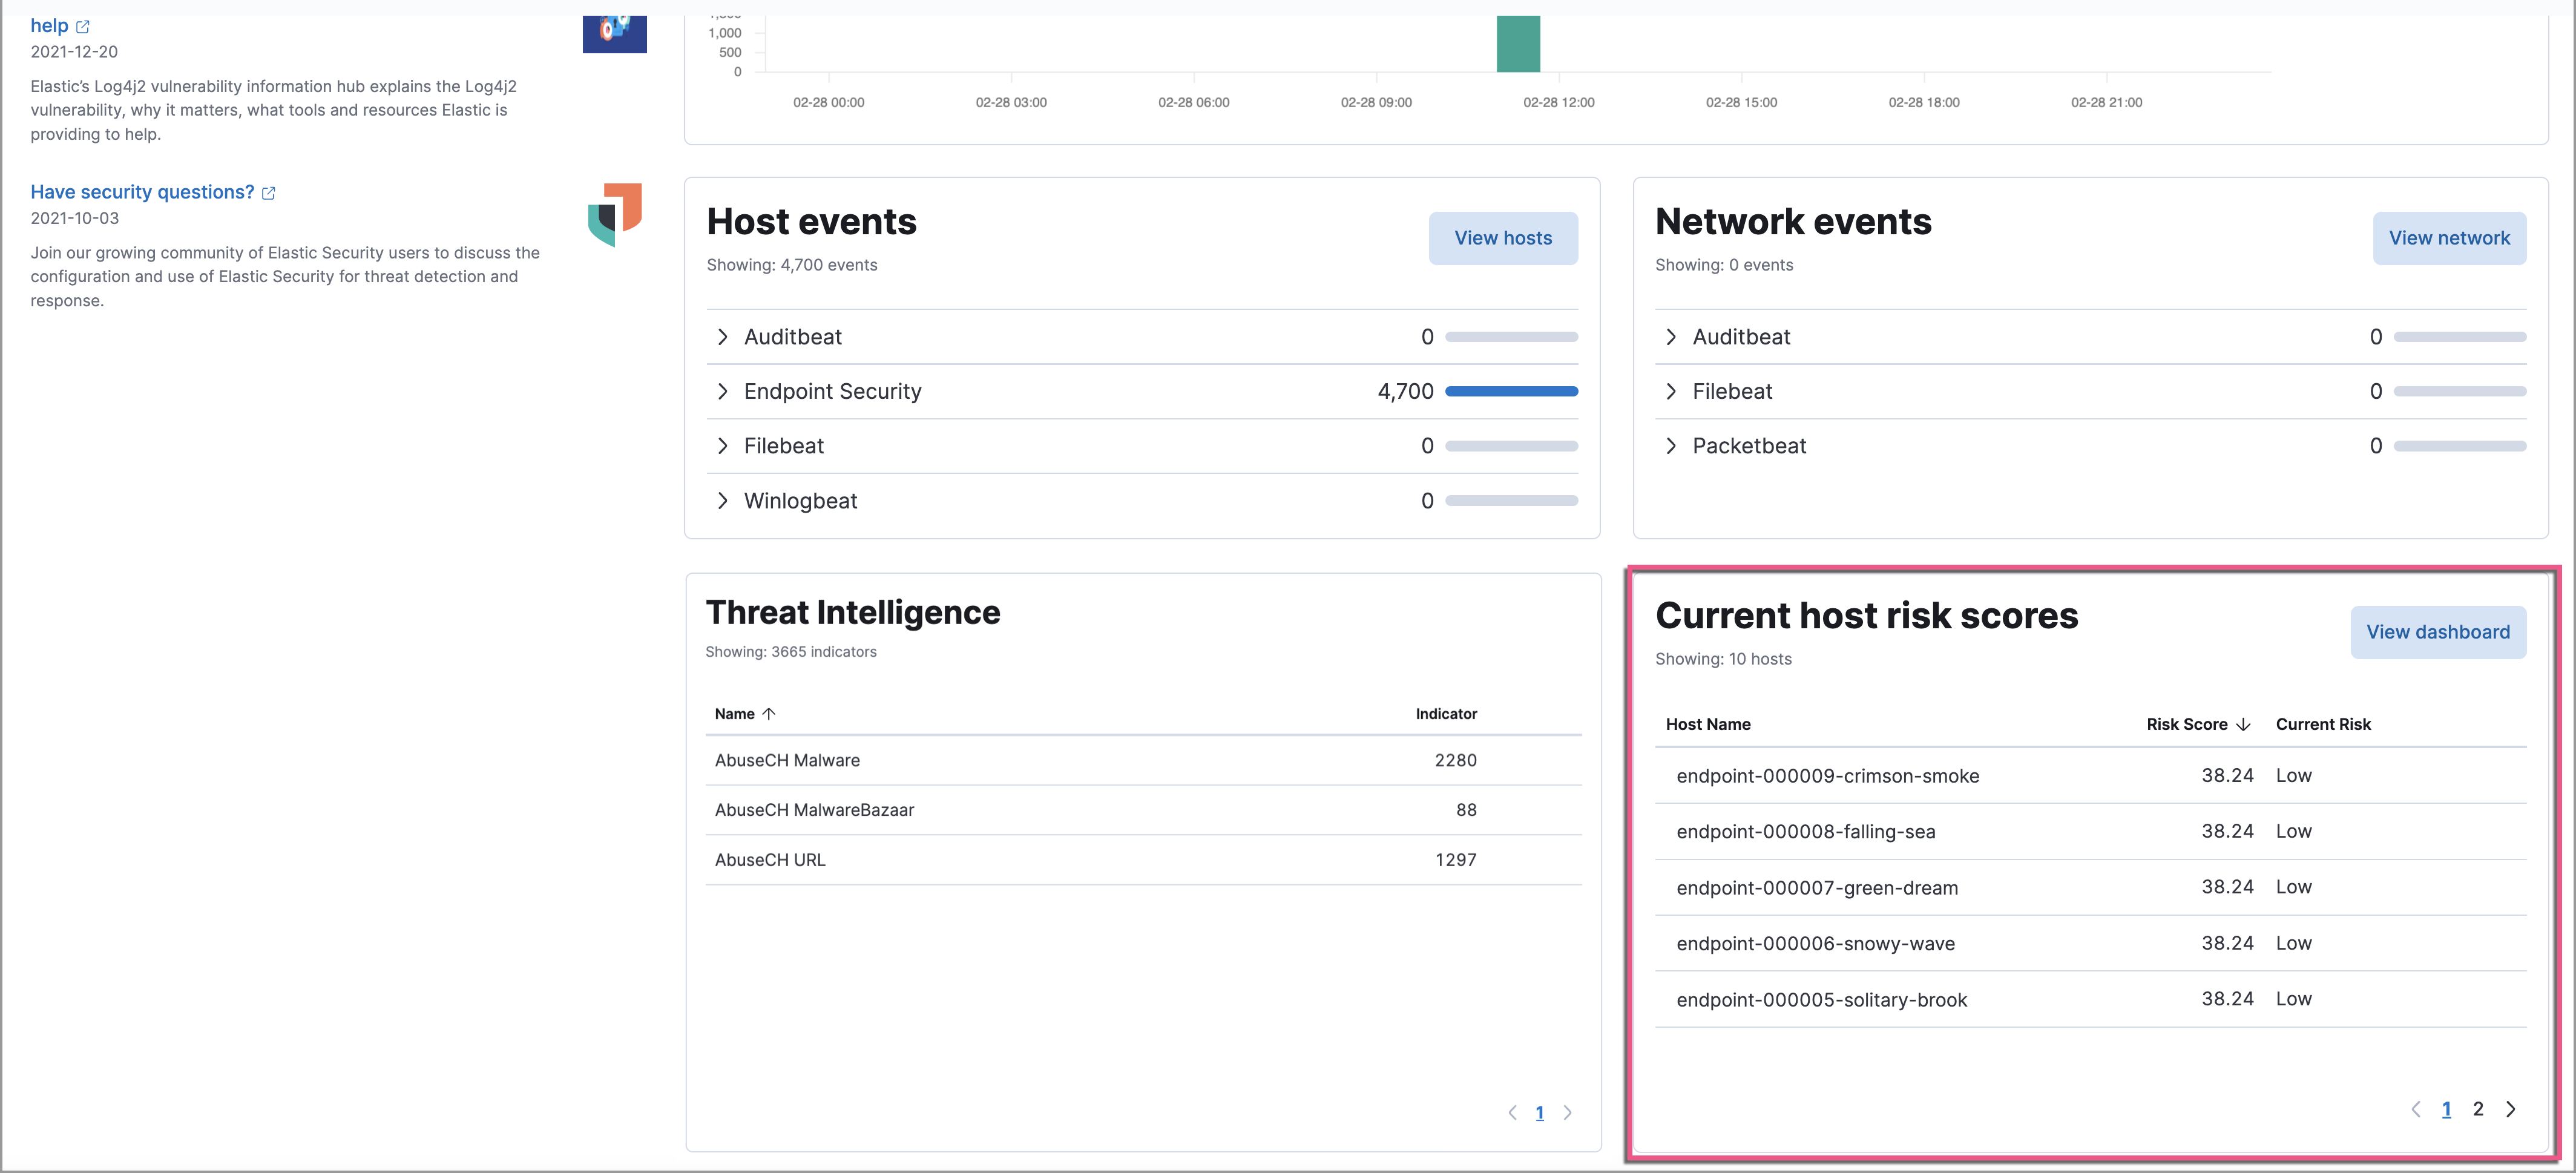
In the Elastic Security app, go to Dashboards → Overview, then locate the Current host risk scores card in the lower-right corner.
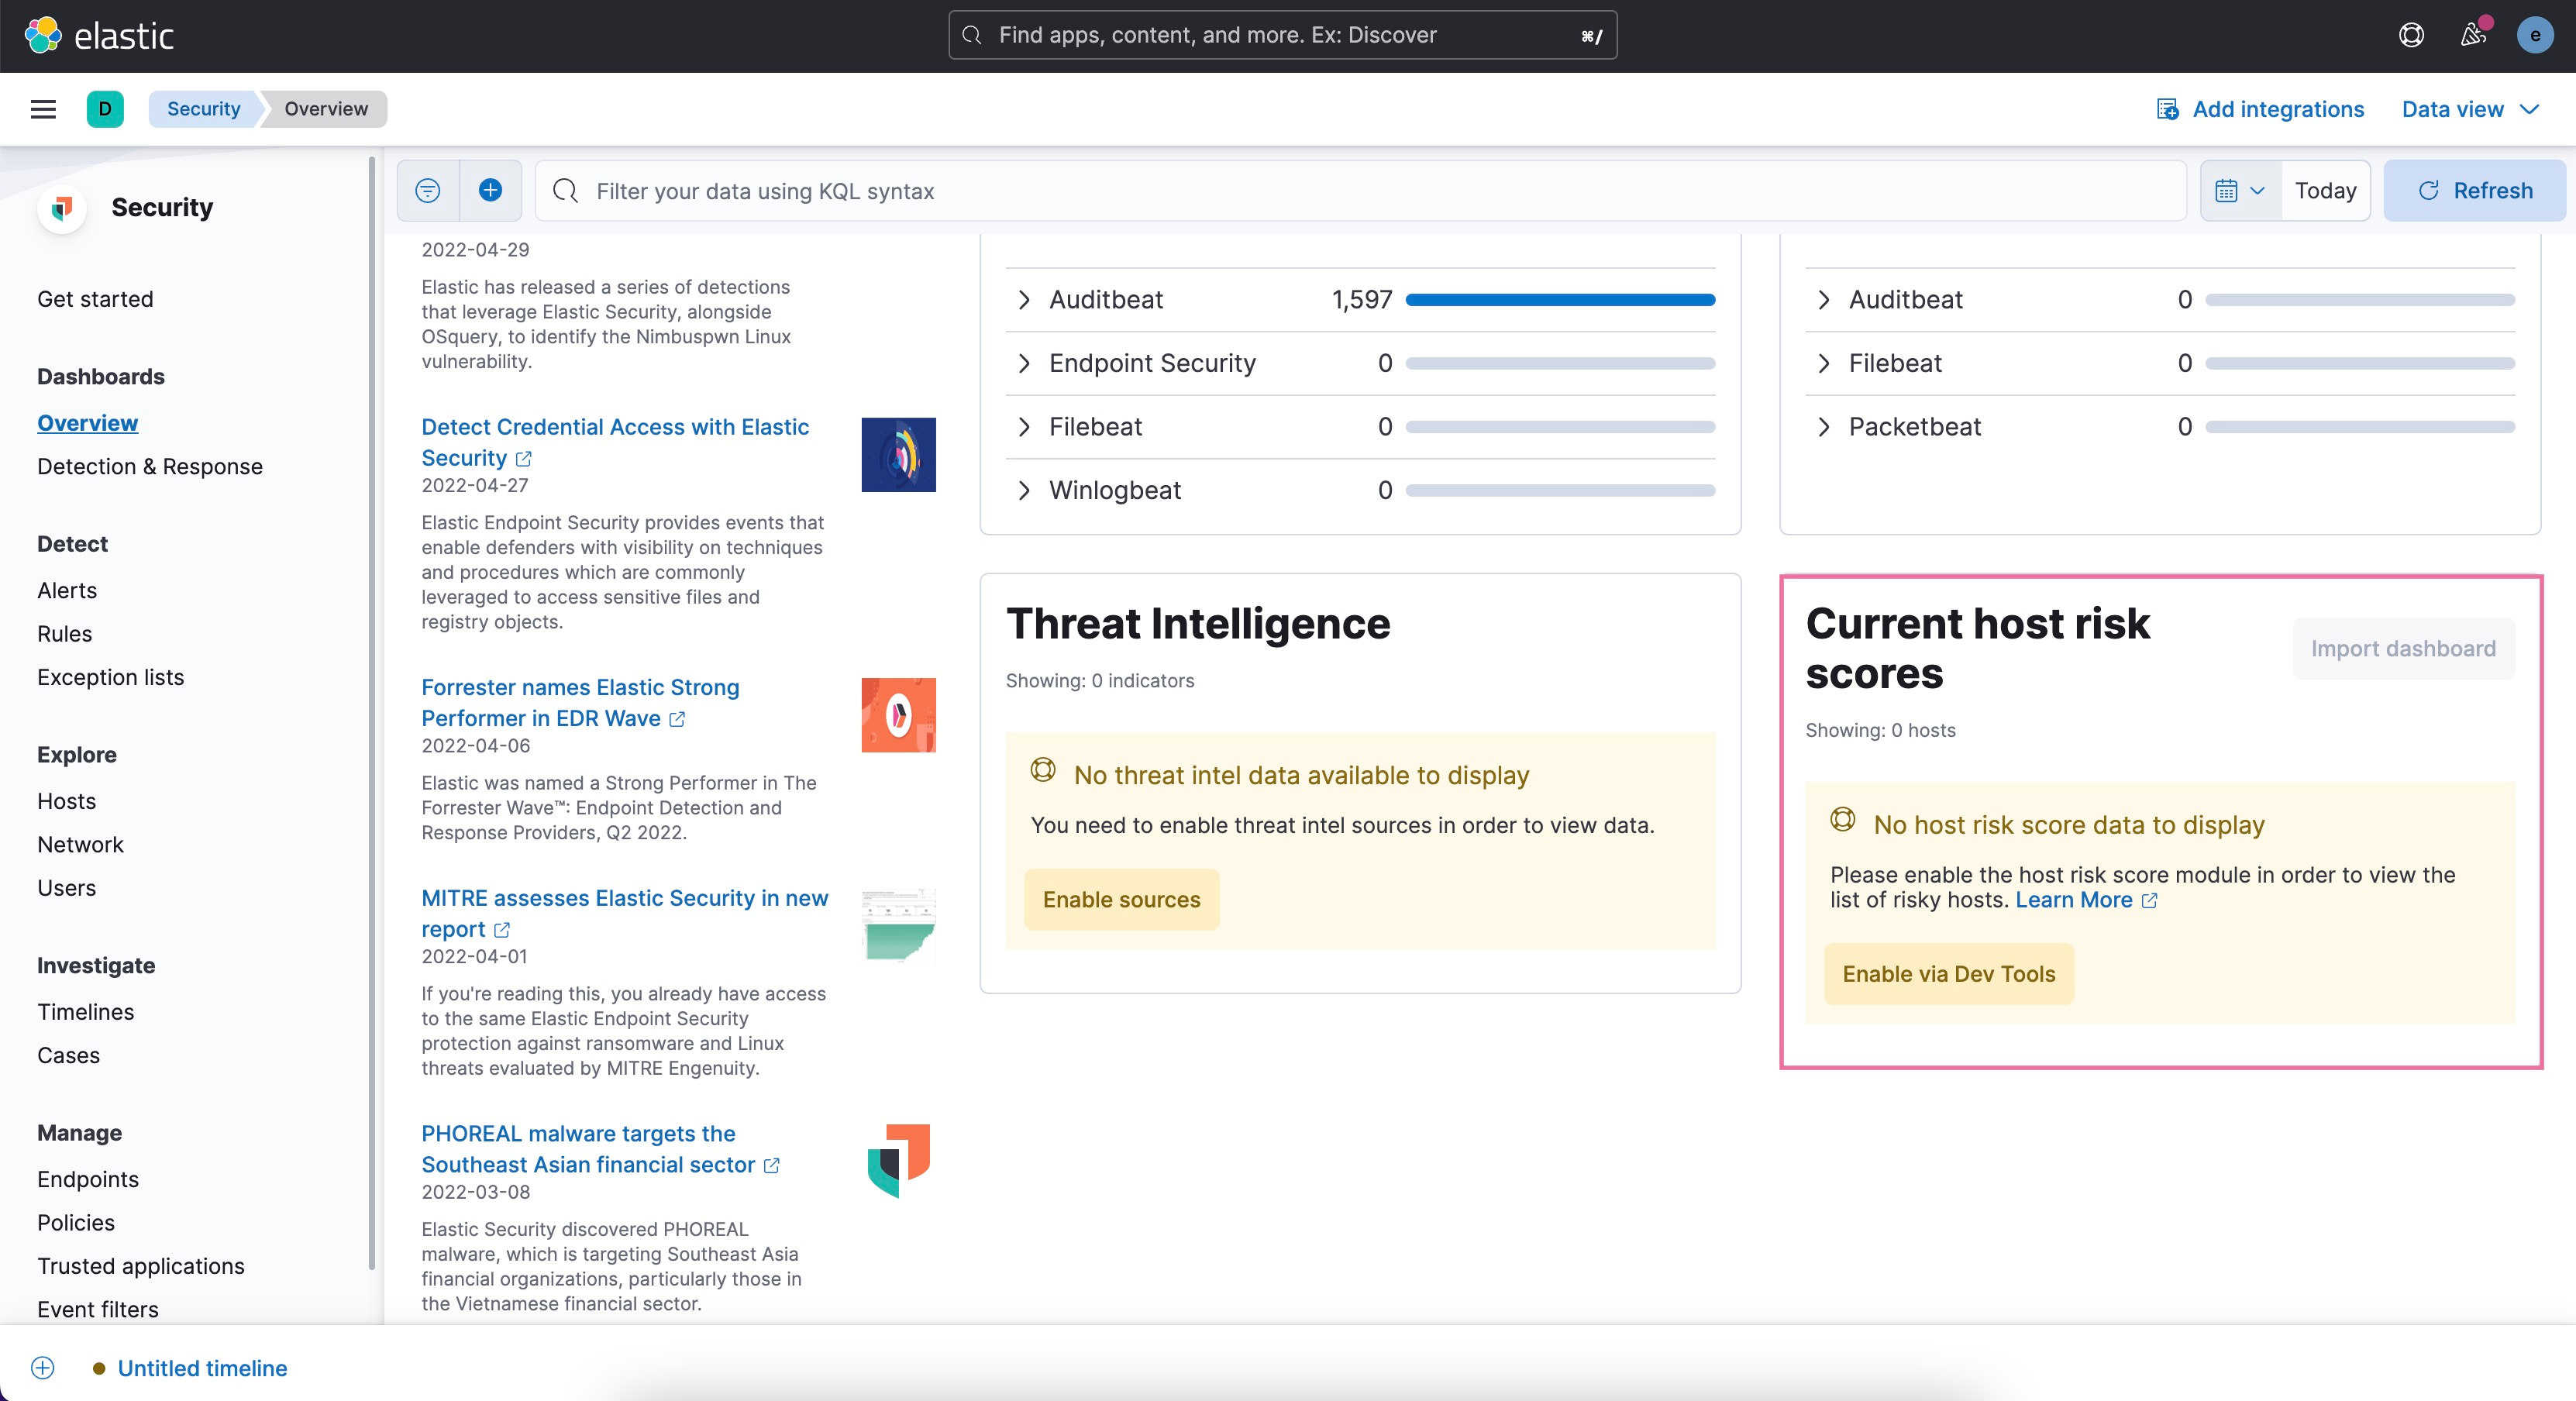
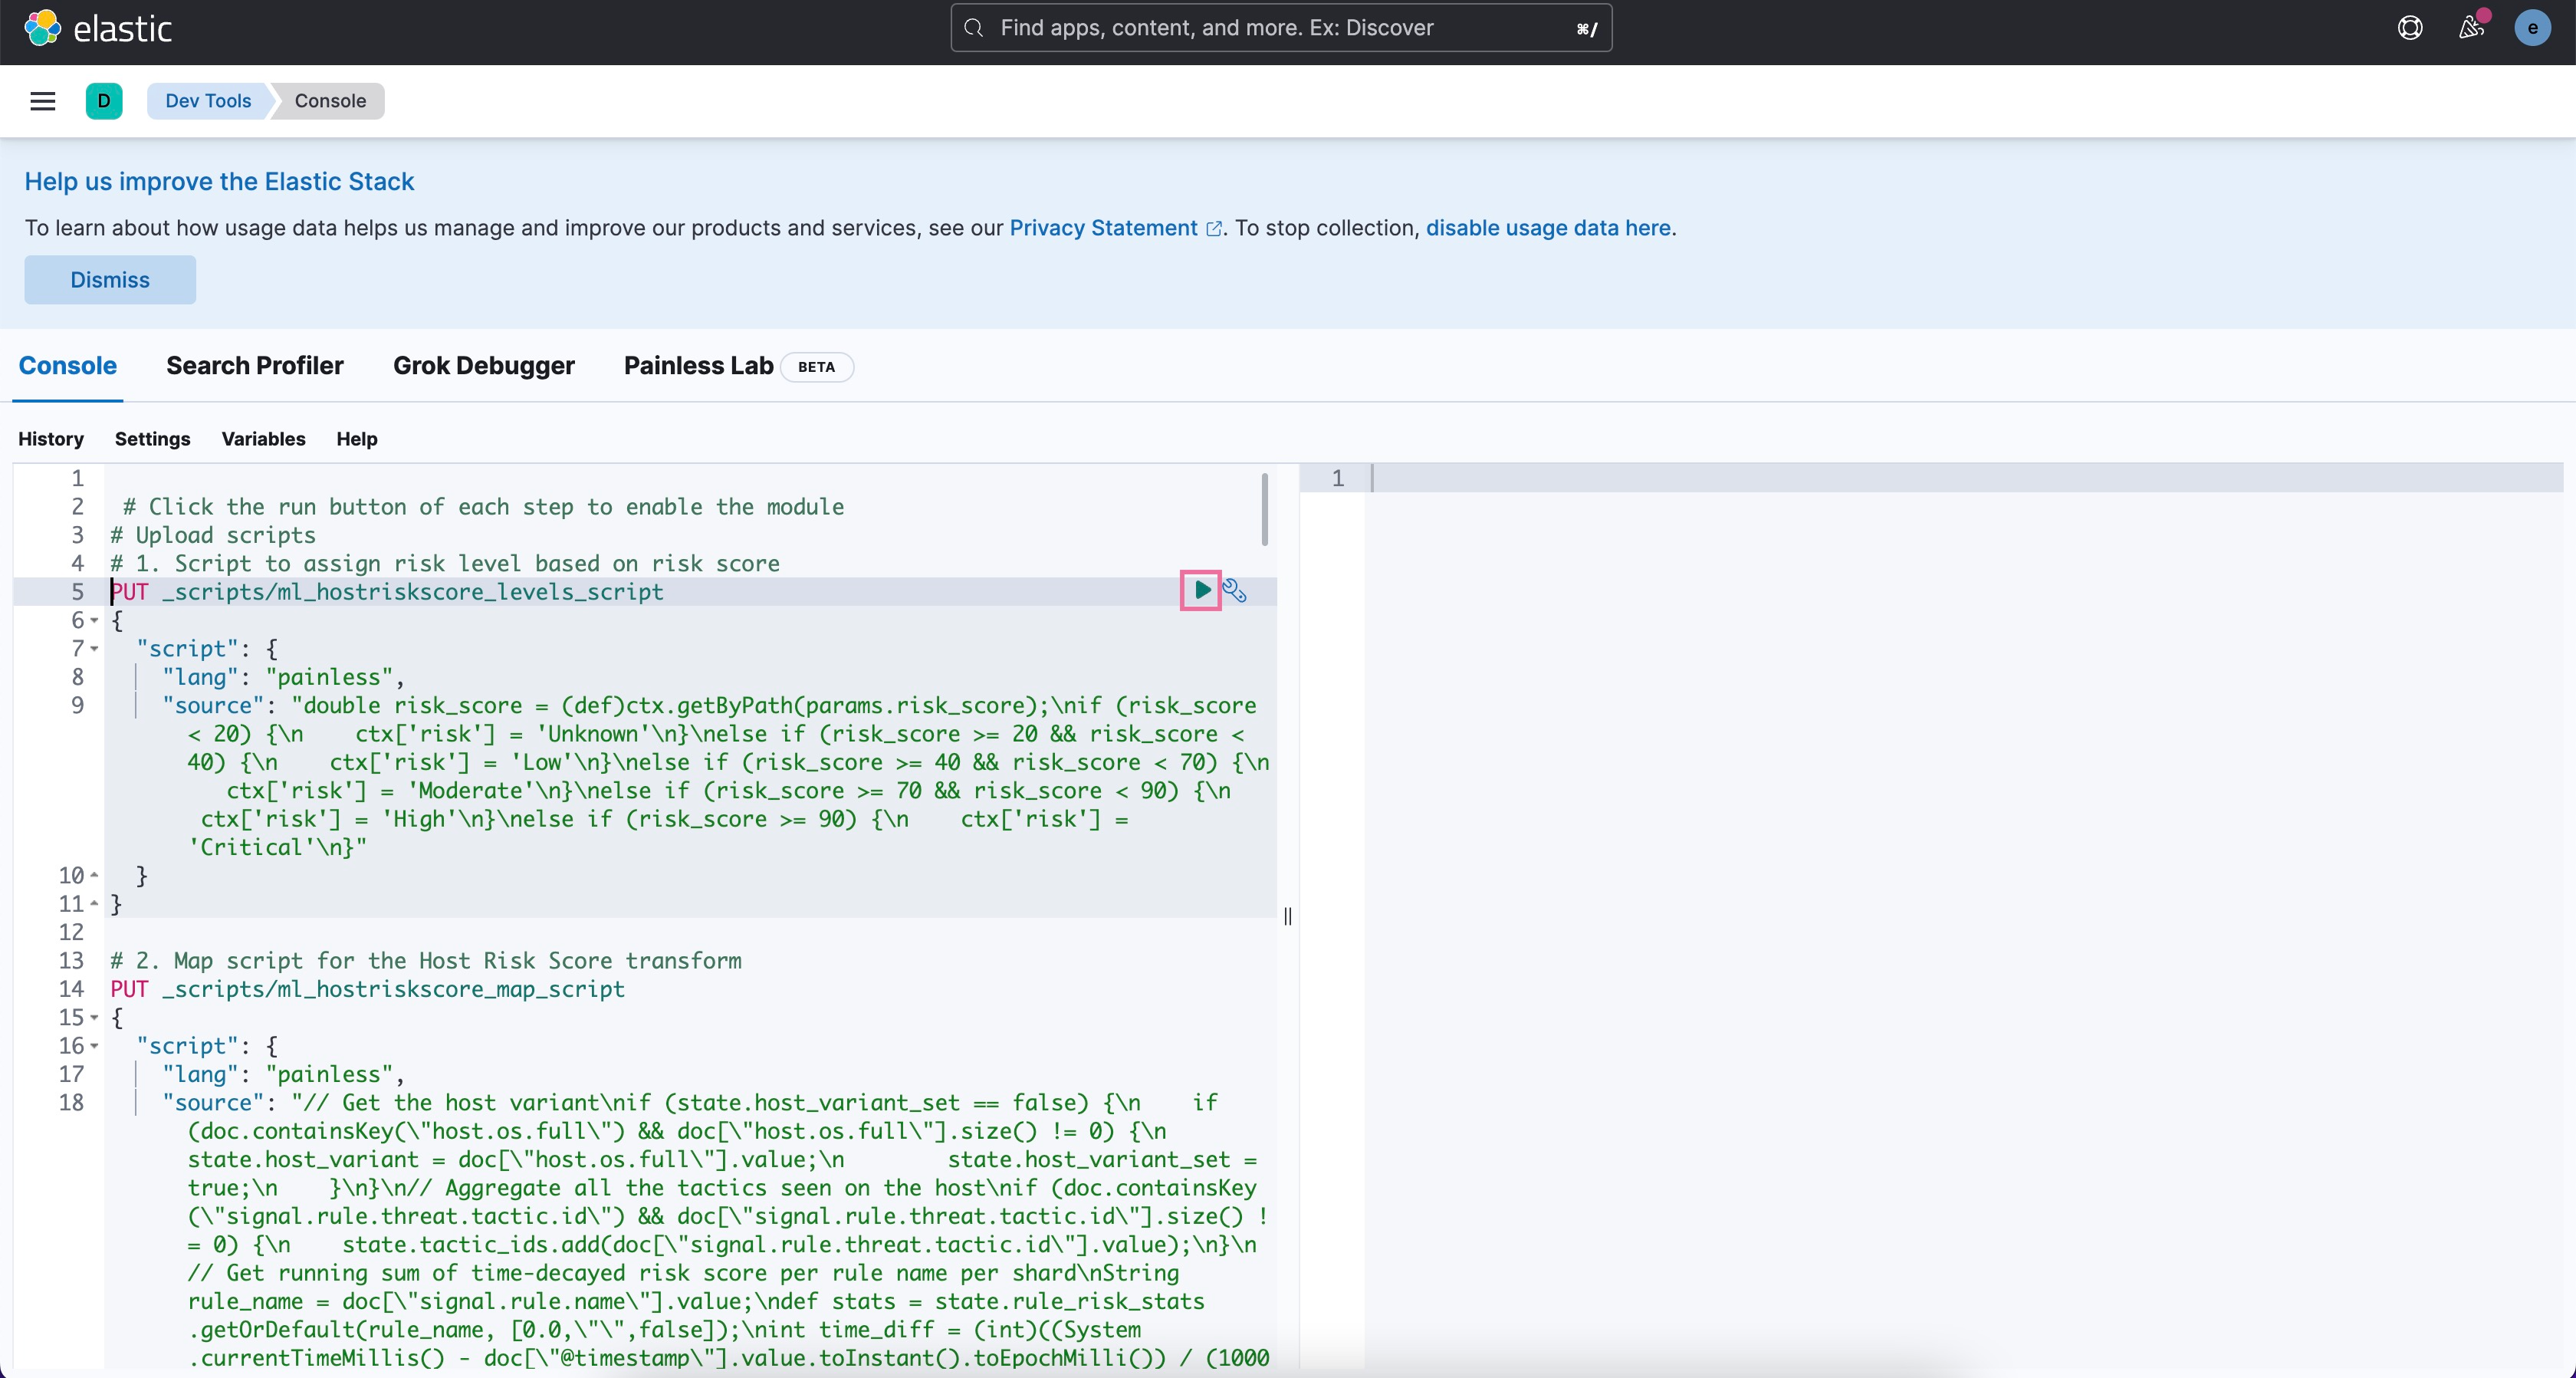
- Click Enable via Dev Tools. This will open the Dev Tools Console in Kibana, which will be pre-populated with the scripts required to enable the host risk score feature.
-
Click the Play button to run each of the scripts, in their numbered order from 1 to 11.
Import the host risk score dashboard
editAfter you have set up the framework for the host risk score feature, import pre-built dashboards to analyze risky hosts in your environment:
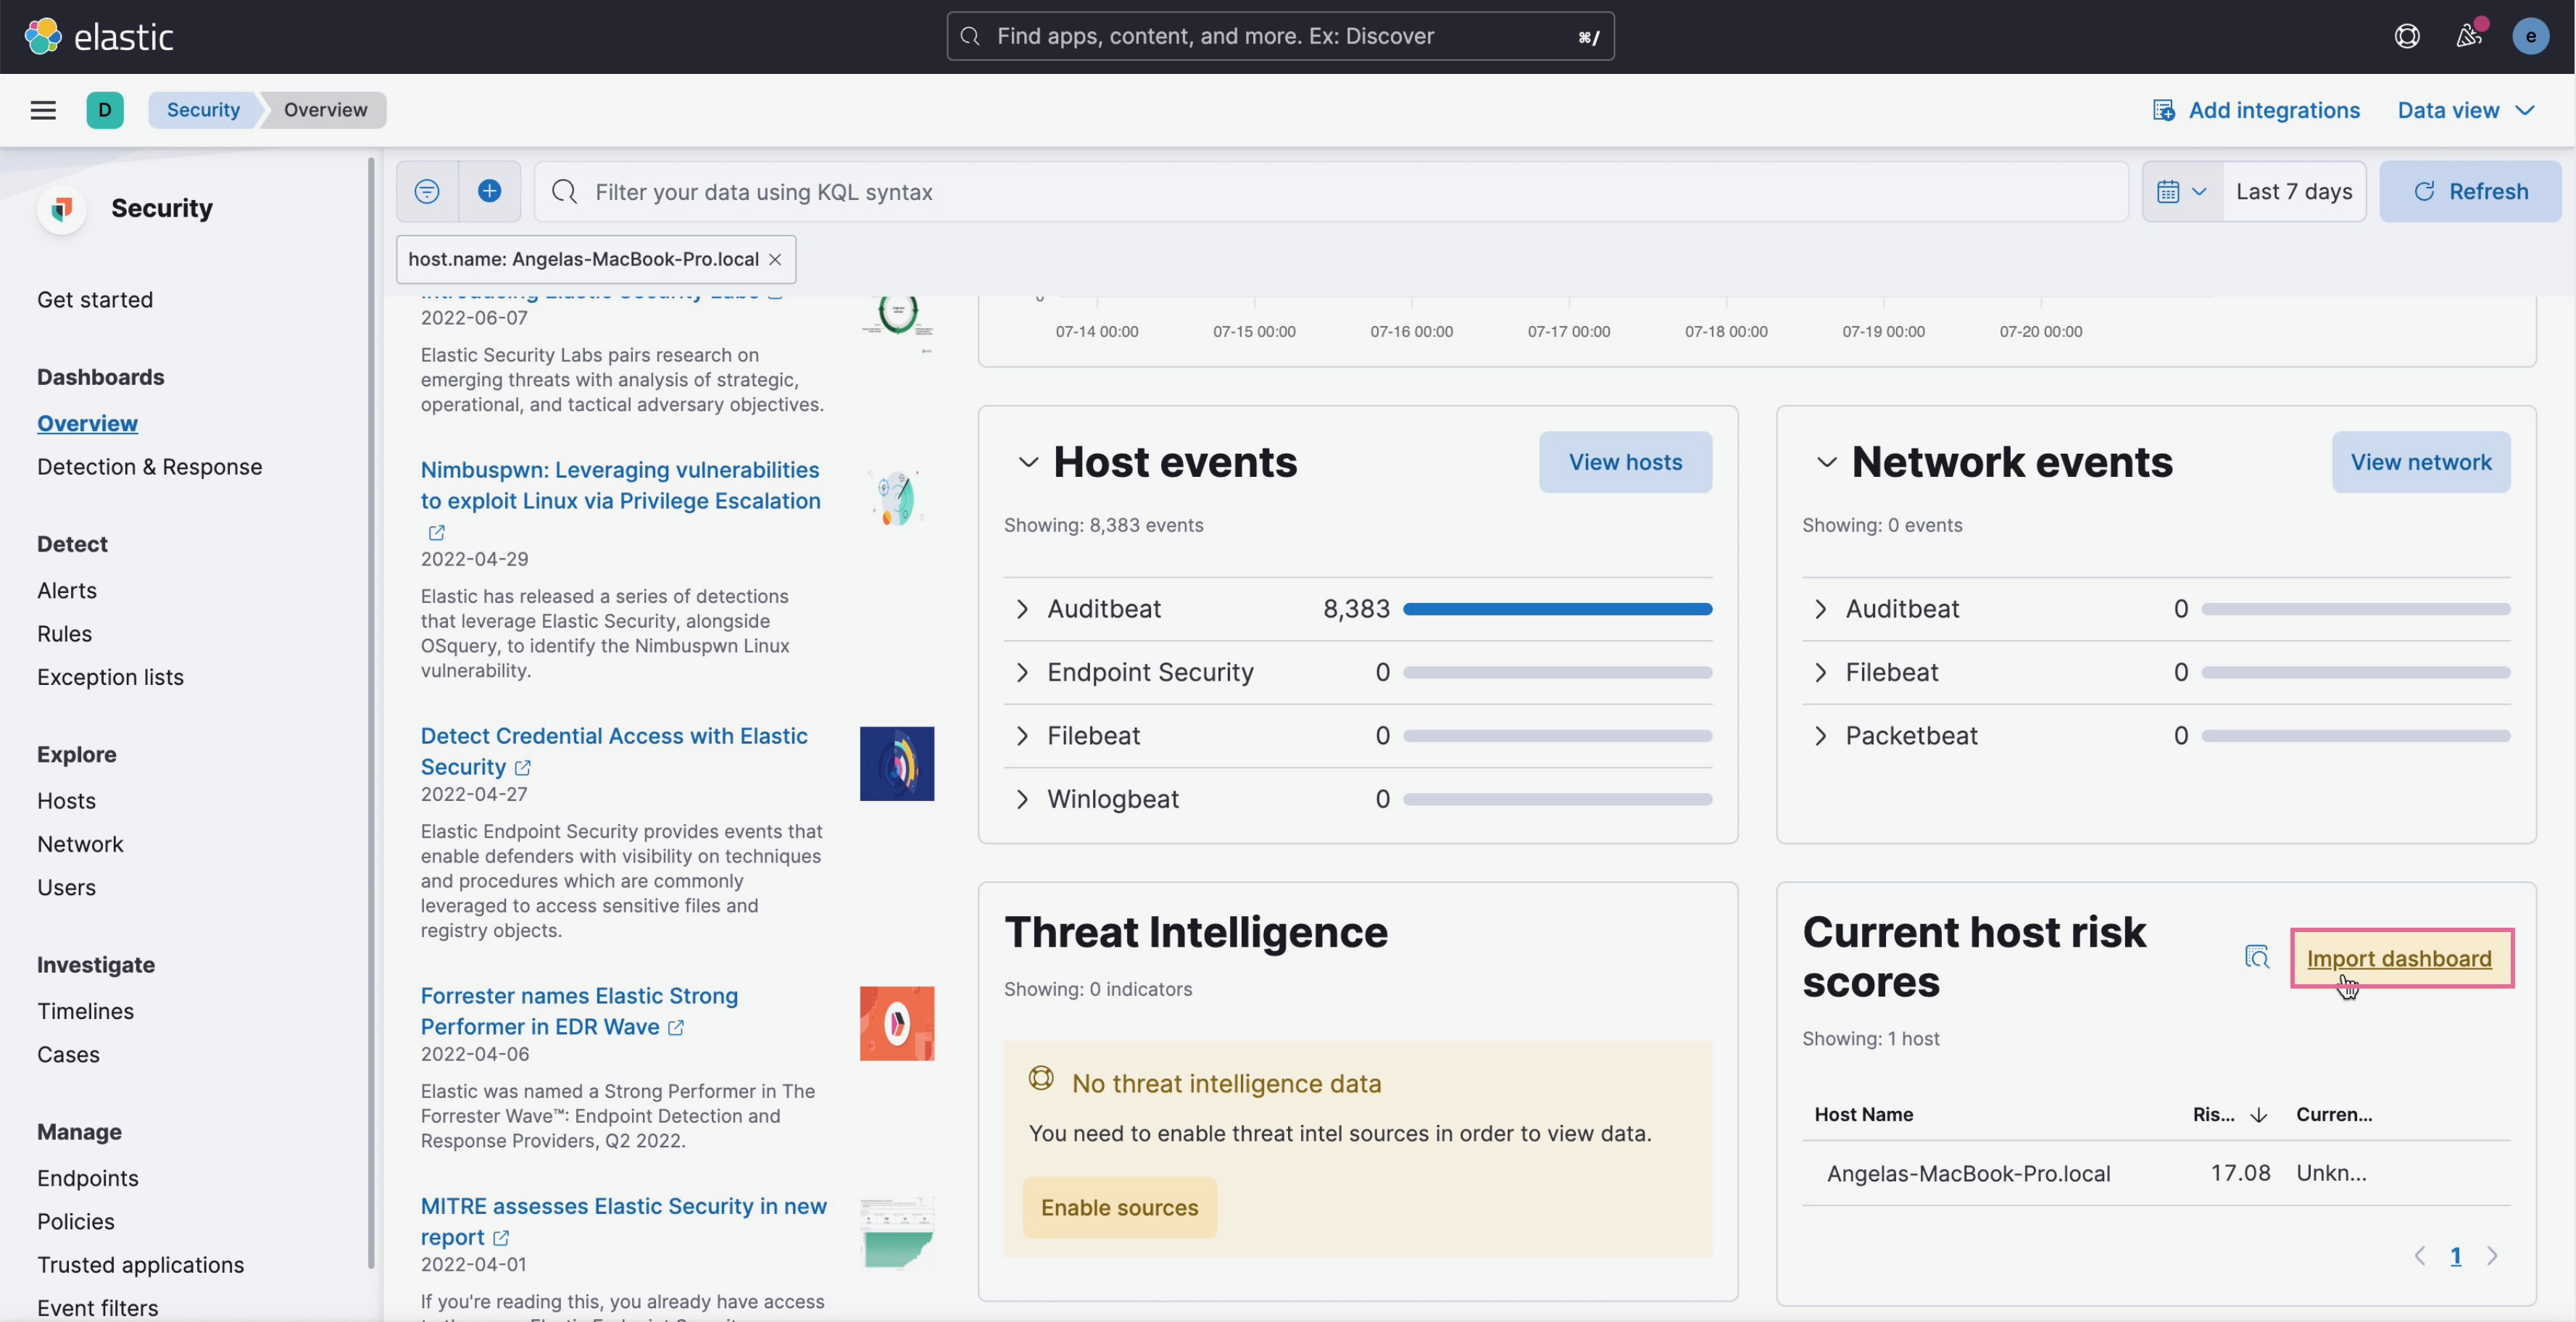
- Navigate to the Current host risk scores card (Dashboards → Overview).
-
Click Import dashboard.
View host risk score data
editFrom the Current host risk scores card, click View dashboard.
It is recommended you analyze hosts with the highest risk scores — or those in the Critical and Moderate categories first.
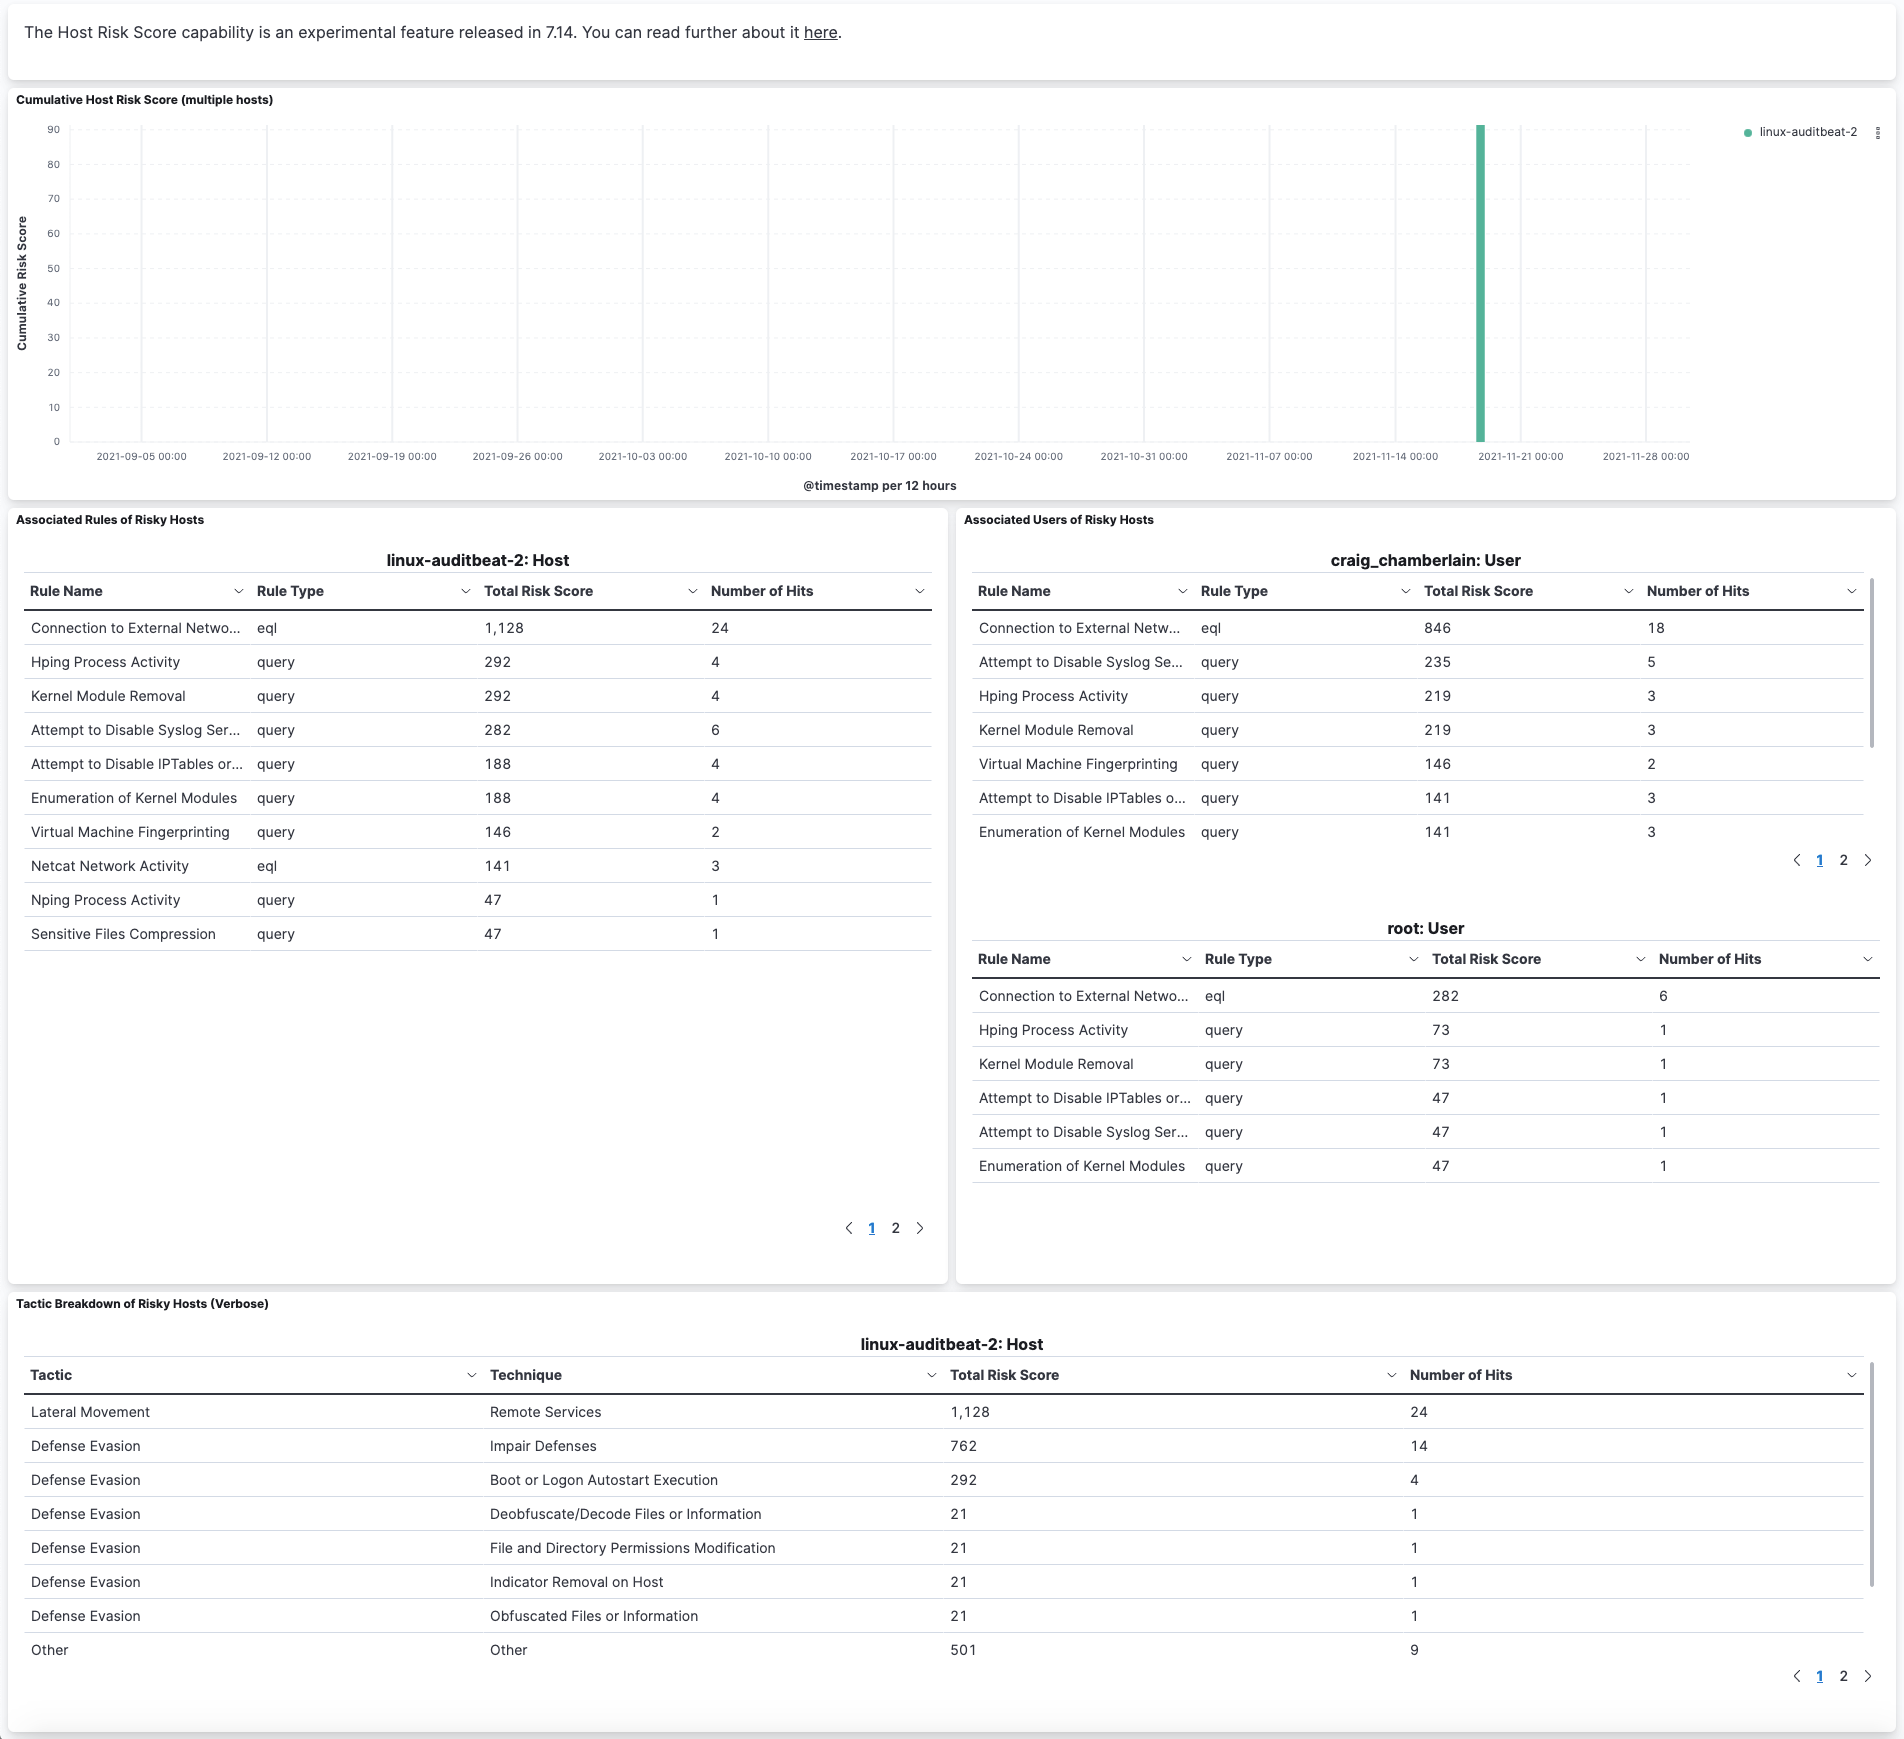
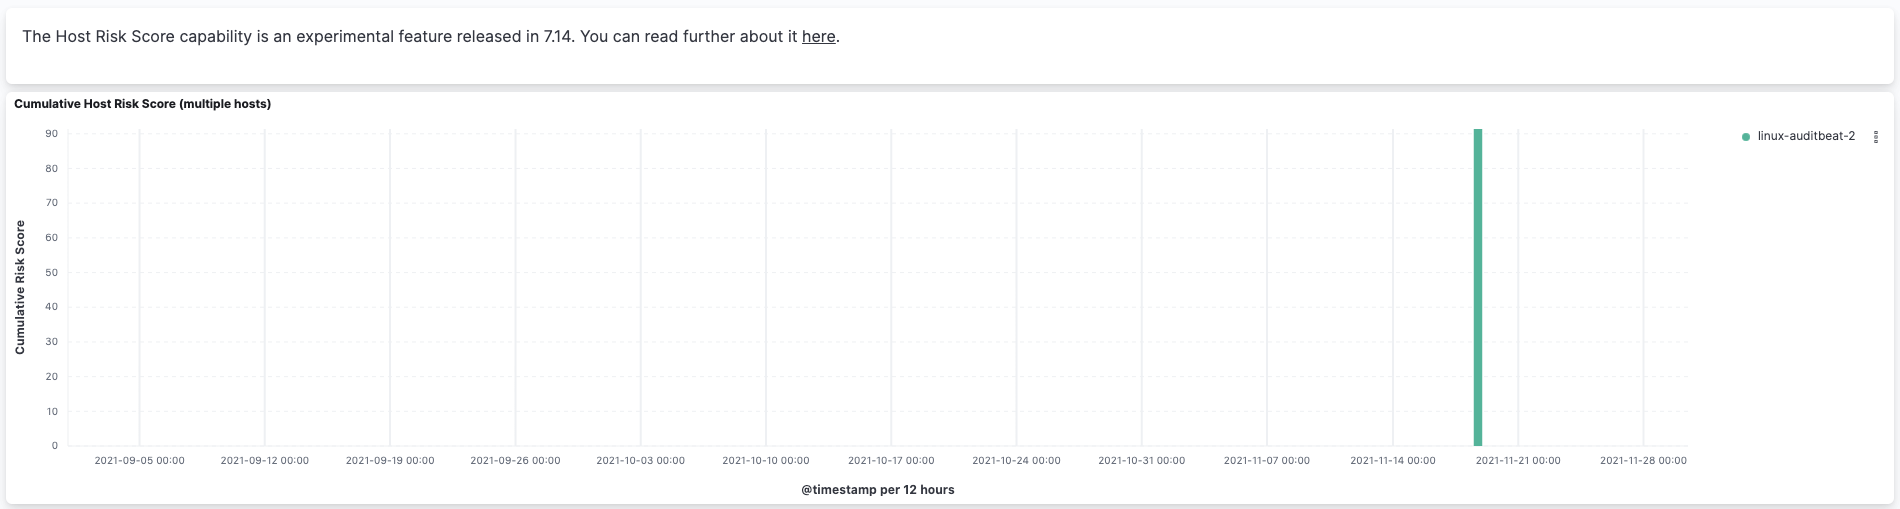
Use the histogram to track how the risk score for a particular host has changed over time. To specify a date range, use the date and time picker, or drag and select a time range within the histogram.
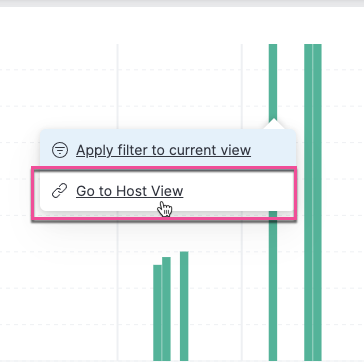
To go to the host’s detail page, left-click any host’s corresponding bar in the histogram, then select Go to Host View.
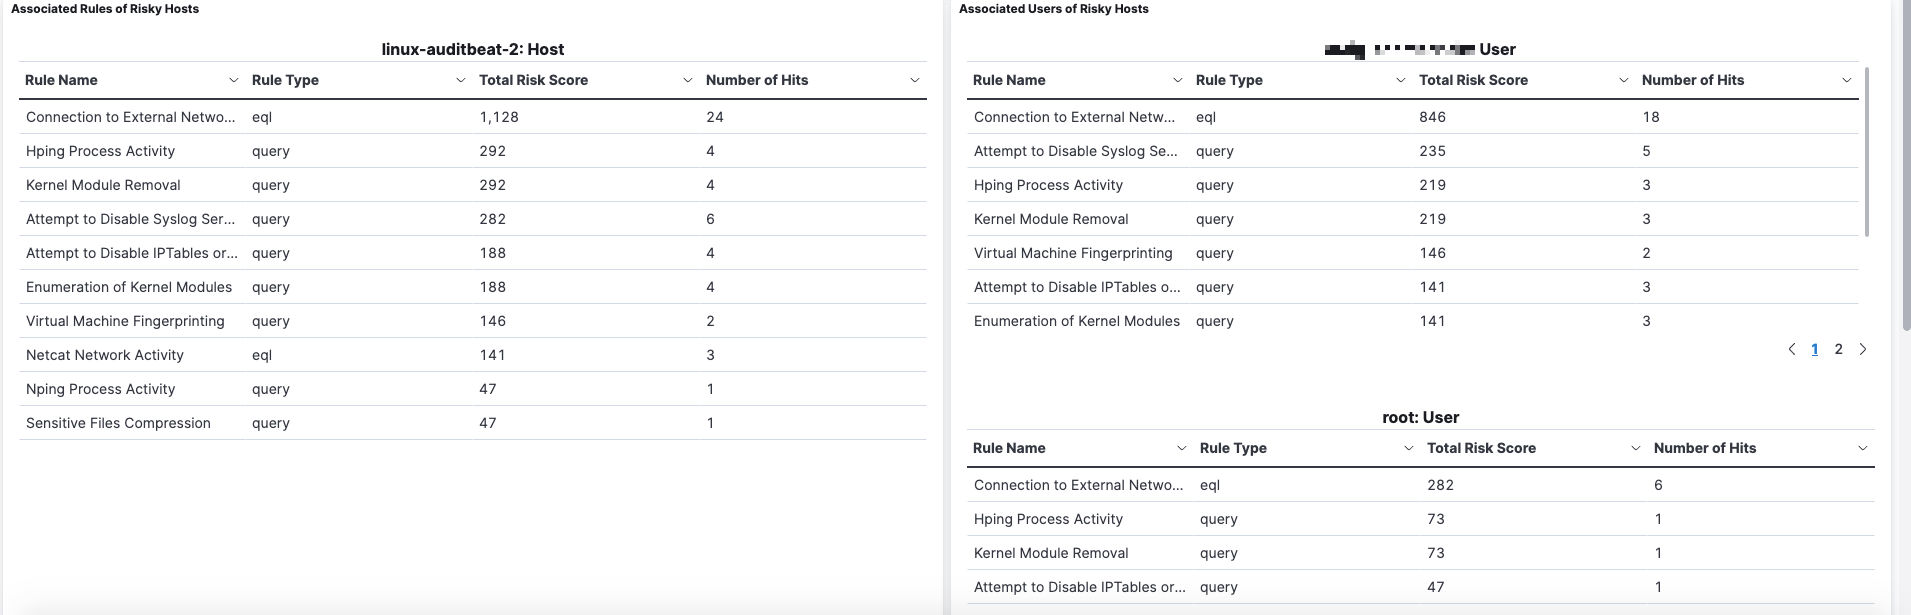
The data tables beneath the histogram display associated rules, users, and MITRE ATT&CK tactics of risky hosts. The table data is sorted in reverse chronological order by default, with the highest total risk score at the top. Use this information to triage alerts with the highest risk in your network.
Additional places to visualize host risk score data
editYou can also visualize host risk score data in the following places in the Elastic Security app:
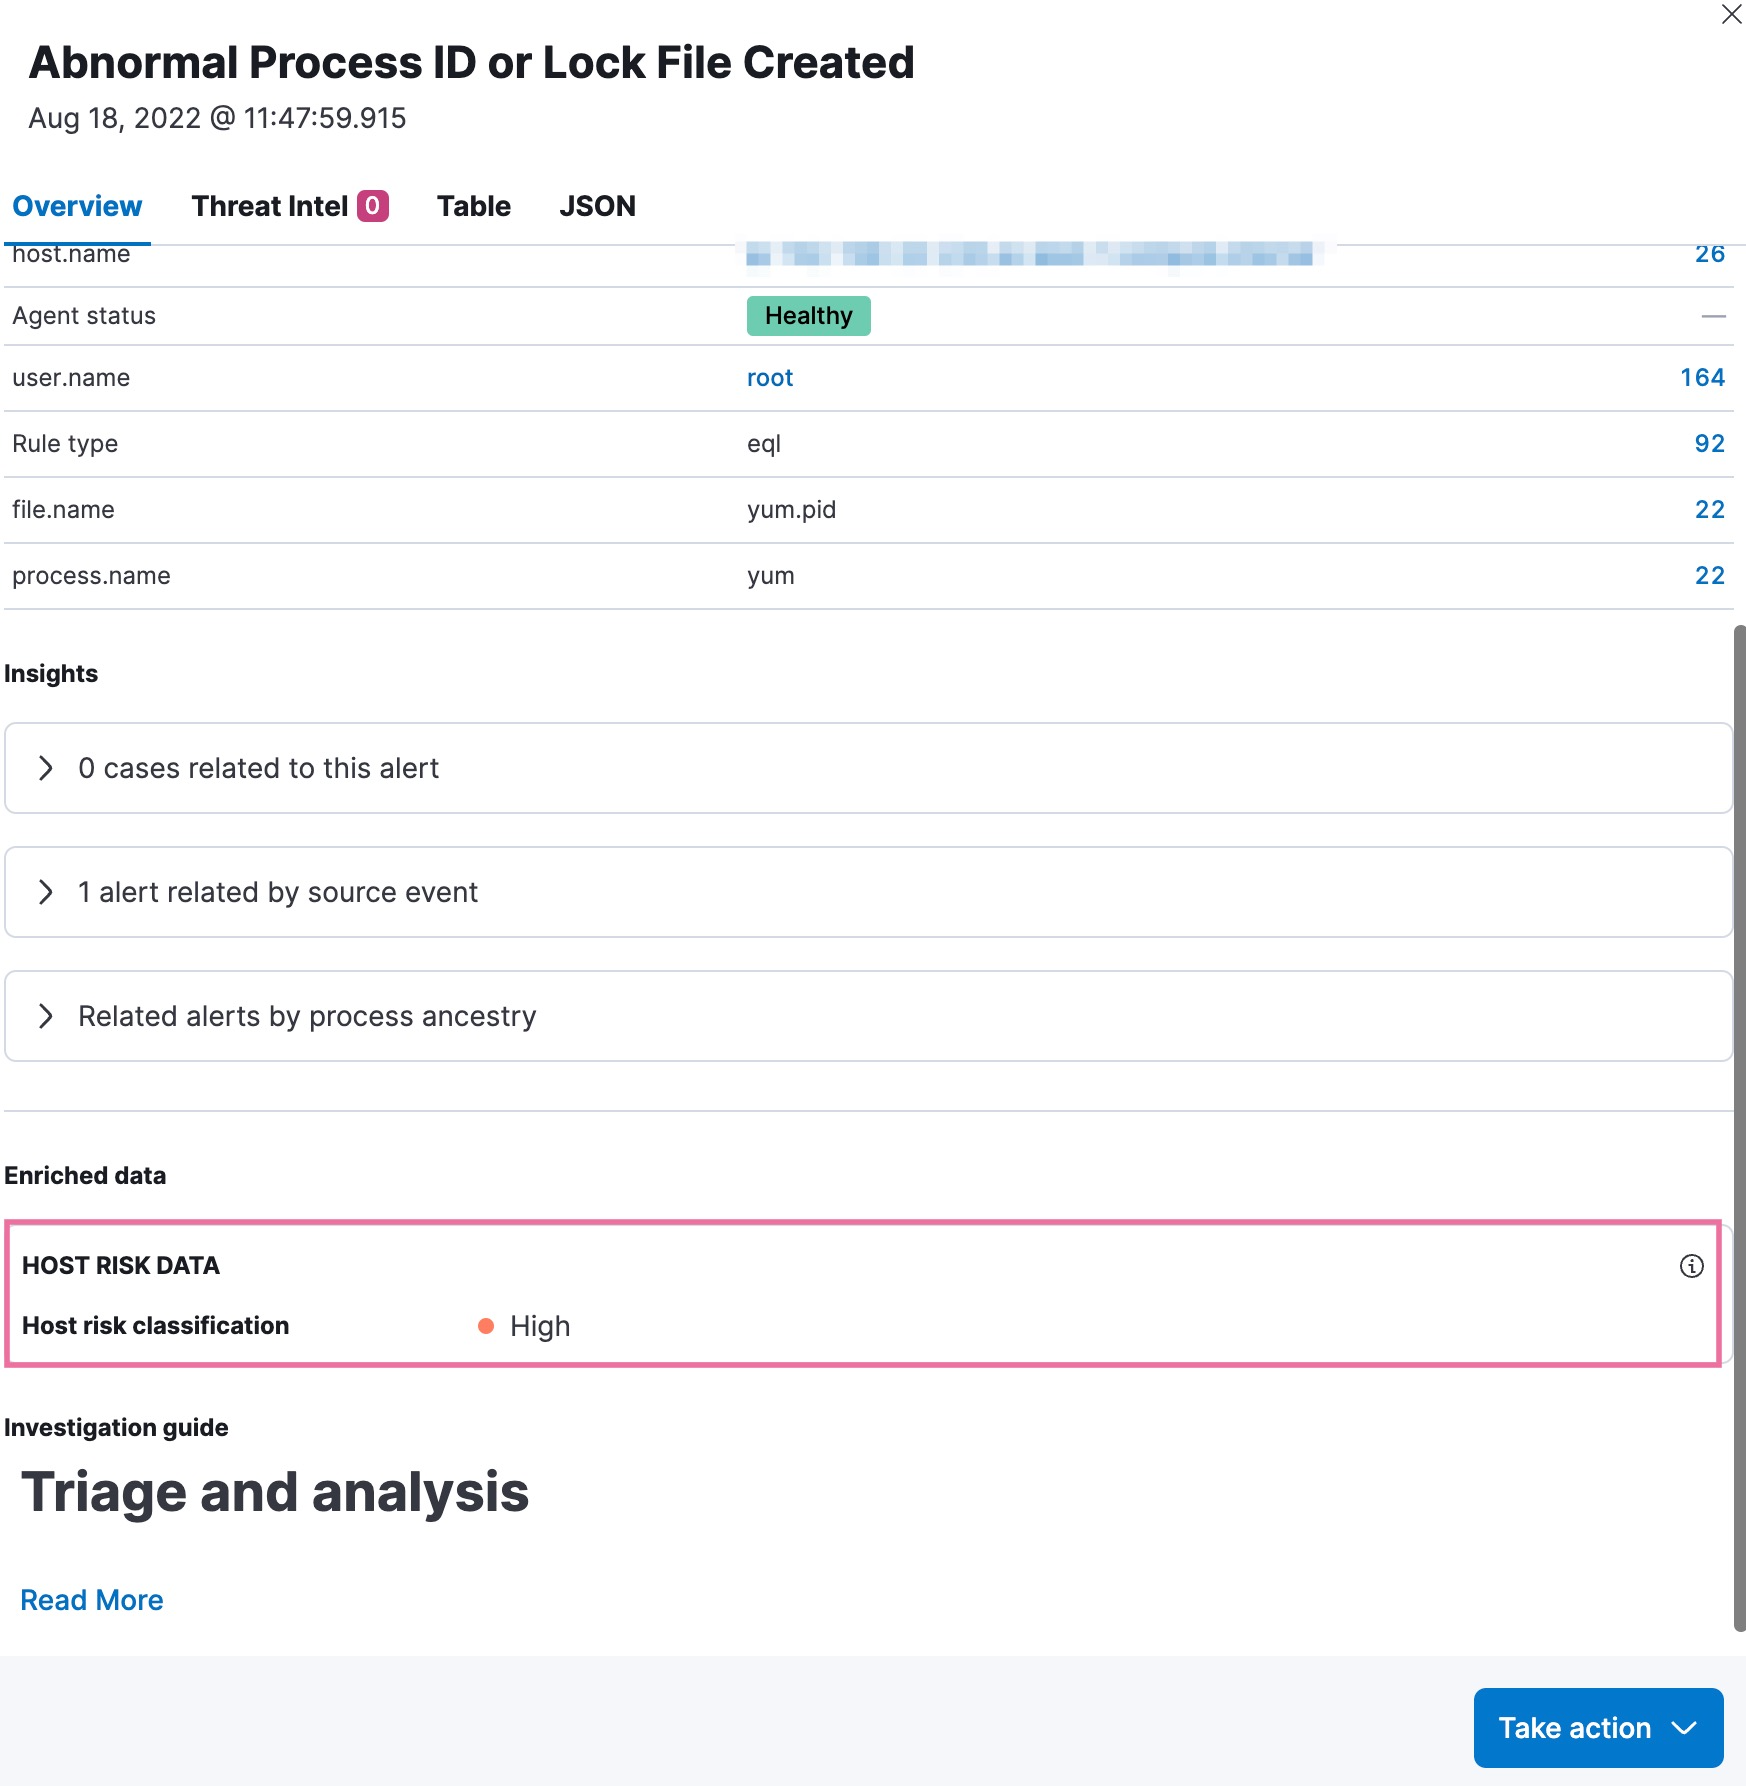
The Overview tab on the Alert details flyout:
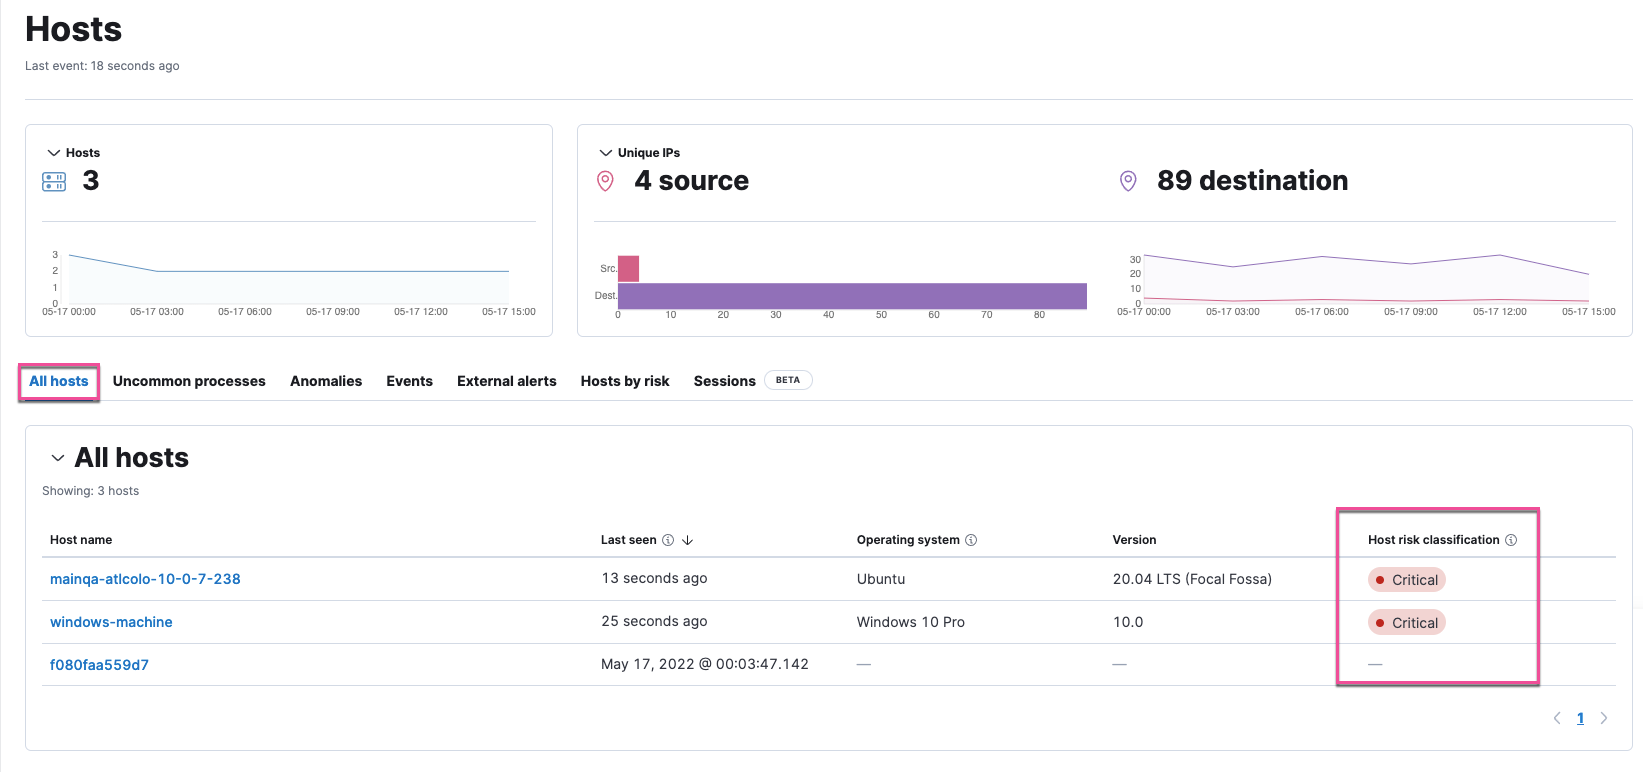
The Host risk classification column in the All hosts table on the Hosts page:
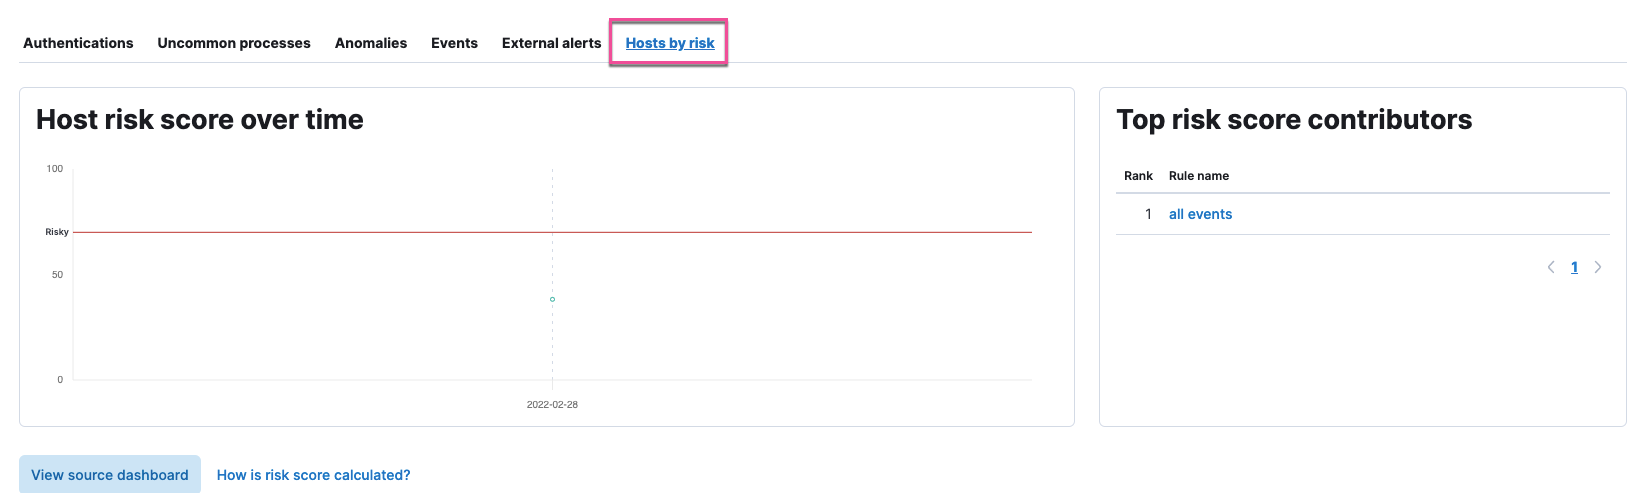
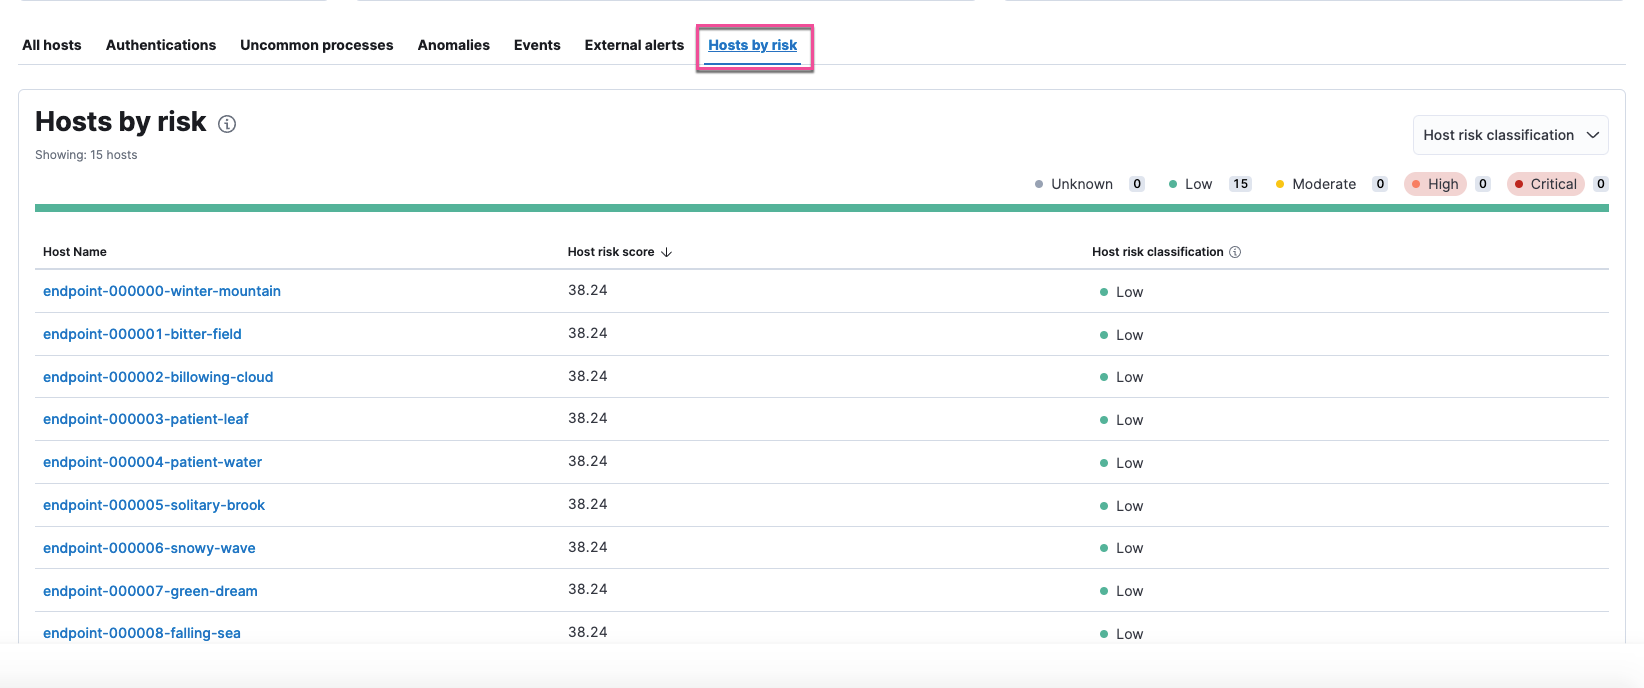
The Hosts by risk tab on the Hosts page:
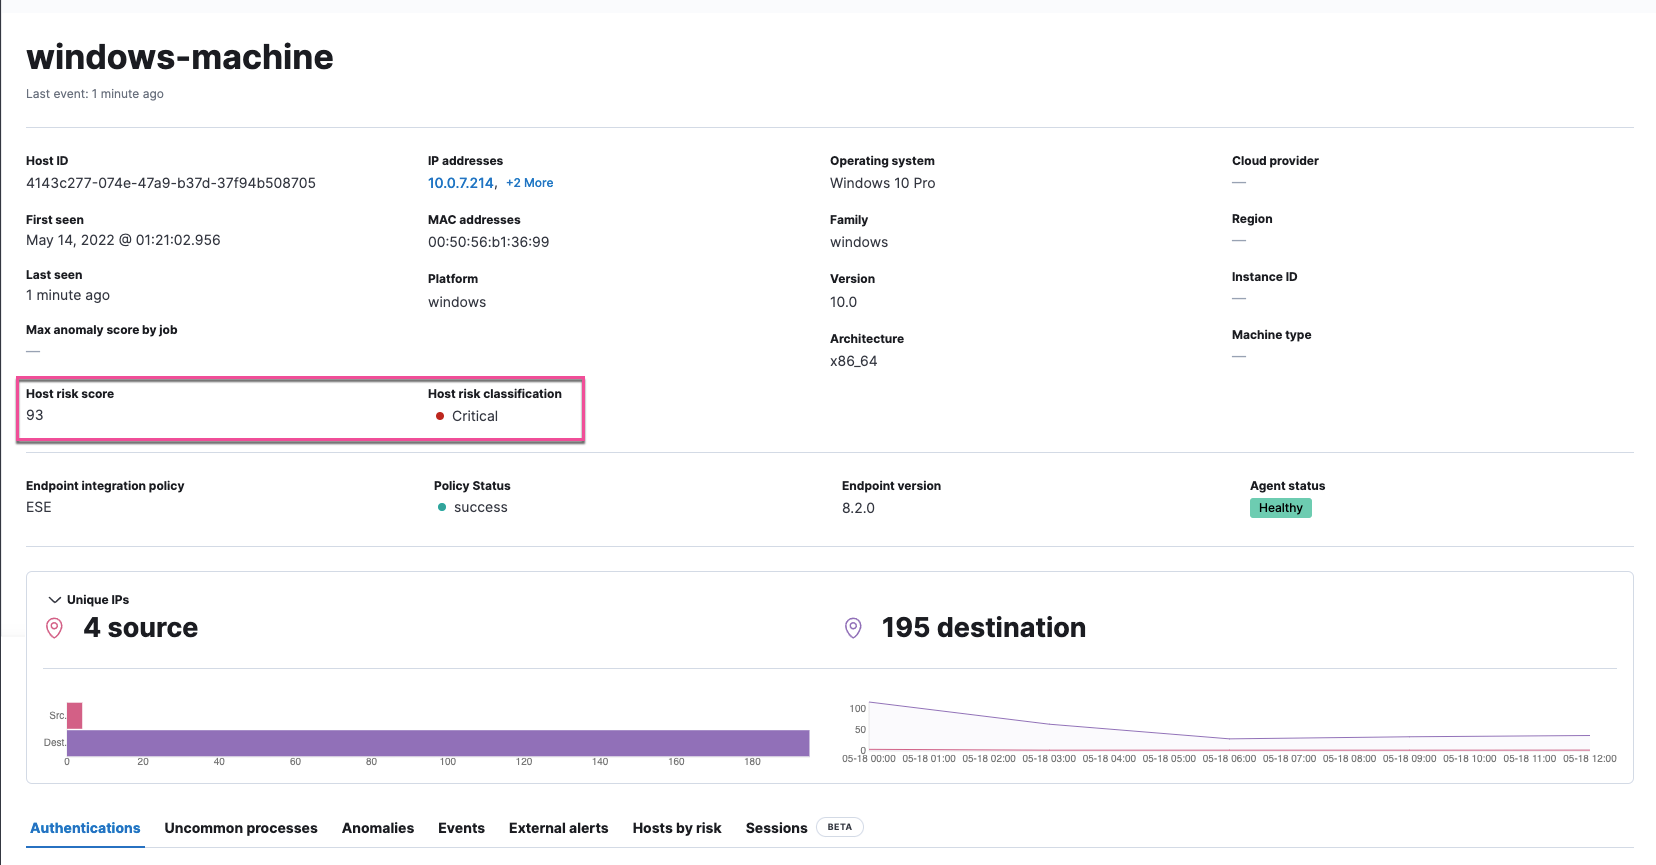
The Overview section on the Host details page:
The Hosts by risk tab on the Host details page: