User risk score
editUser risk score
editThis feature is available for Elastic Stack versions 8.3.0 and newer.
The user risk score feature highlights risky usernames in your environment. It utilizes a transform with a scripted metric aggregation to calculate user risk scores based on alerts generated within the past 90 days. The transform runs hourly to update scores as new alerts are generated.
Each alert’s contribution to the user risk score is based on the alert’s risk score (signal.rule.risk_score). The risk score is calculated using a weighted sum where rules with higher time-corrected risk scores also have higher weights. Each risk score is normalized on a scale of 0 to 100.
The following table shows how risk levels are applied to a username, based on the normalized risk score:
| Risk level | User risk score |
|---|---|
Unknown |
< 20 |
Low |
20-40 |
Moderate |
40-70 |
High |
70-90 |
Critical |
> 90 |
Deploy the user risk score package
editTo deploy the user risk score framework in your environment, follow these steps. To view user risk score data in the Elastic Security app, you must enable the riskyUsersEnabled feature flag. However, enabling the feature flag is not required to view the Lens dashboards.
Update user risk score artifacts after you upgrade the Elastic Stack. To do this, download a release bundle that’s compatible with the new Elastic Stack version and repeat all the steps referenced above. Failure to do so might cause views in the Elastic Security app to break.
View user risk score data
editIf the riskyUsersEnabled feature flag is enabled:
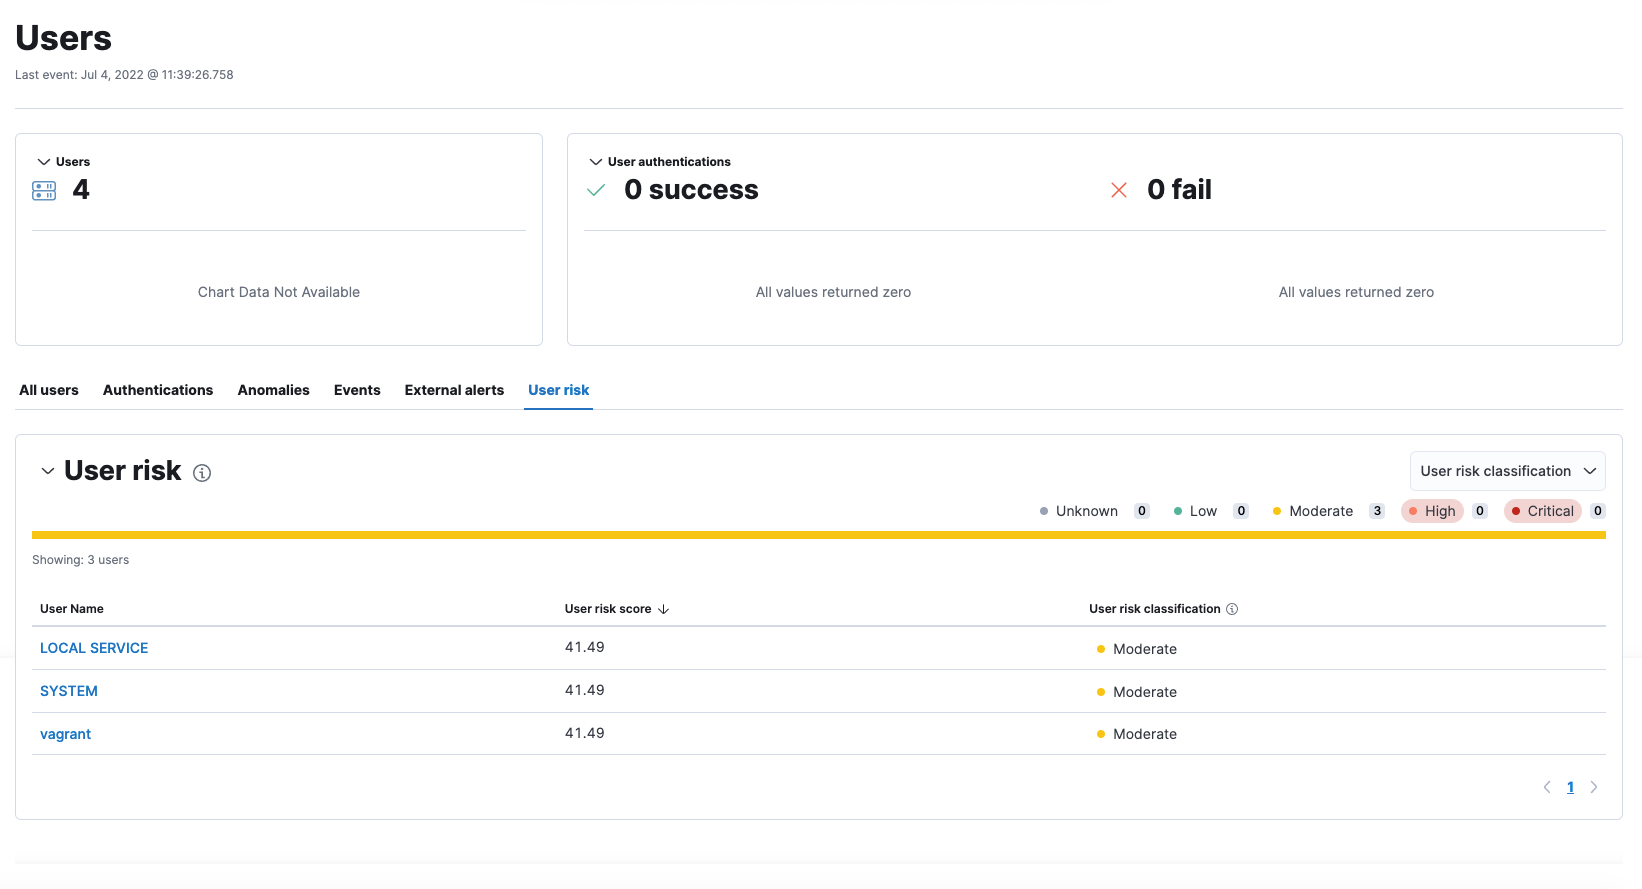
- In the Elastic Security app, go to Explore → Users.
- On the Users page, select the User risk tab.
The User risk table shows a list of usernames, their assigned risk scores, and user risk classifications. The table appears in reverse chronological order, with the most recently authenticated user at the top. Select the User risk classification menu to filter the table by the classification type.
The User risk table is not affected by the KQL time range.
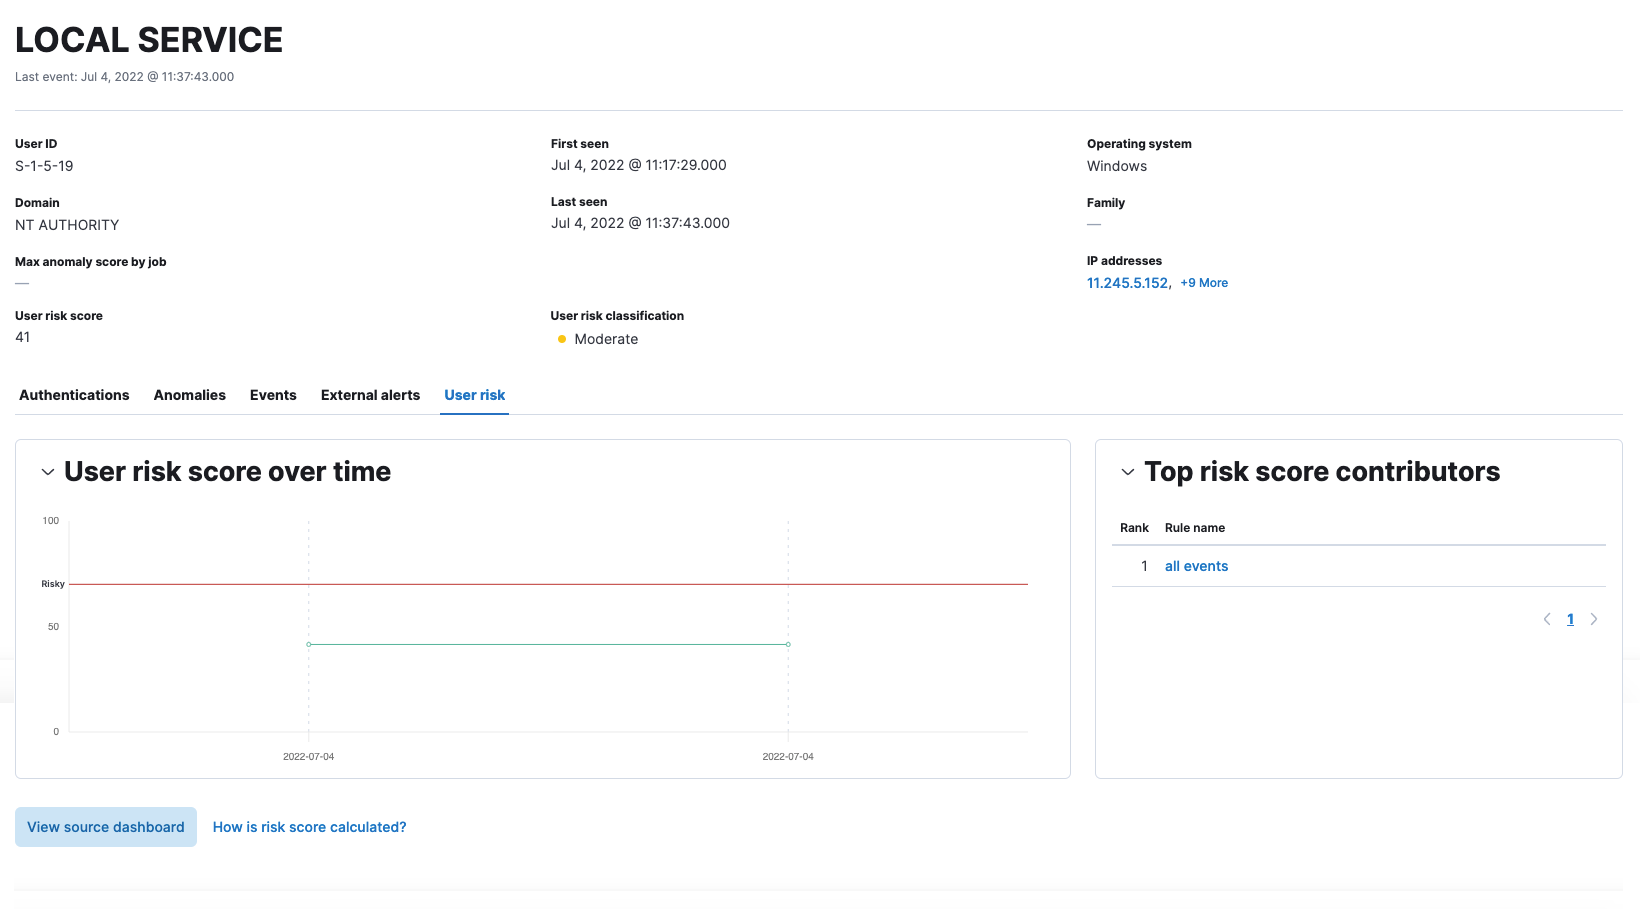
Click a username to view the user risk details page, which shows how the risk score for that user has changed over time. The Top risk score contributors table shows rules with the highest user risk score. Click a rule name to view the rule details page.
The data on this page is affected by the KQL time range; therefore, modify the date and time picker to filter your results.
If the riskyUsersEnabled feature flag is not enabled:
- In Kibana, go to Analytics → Dashboard, then search for "risk score".
- Select the Drilldown of User Risk Score dashboard.
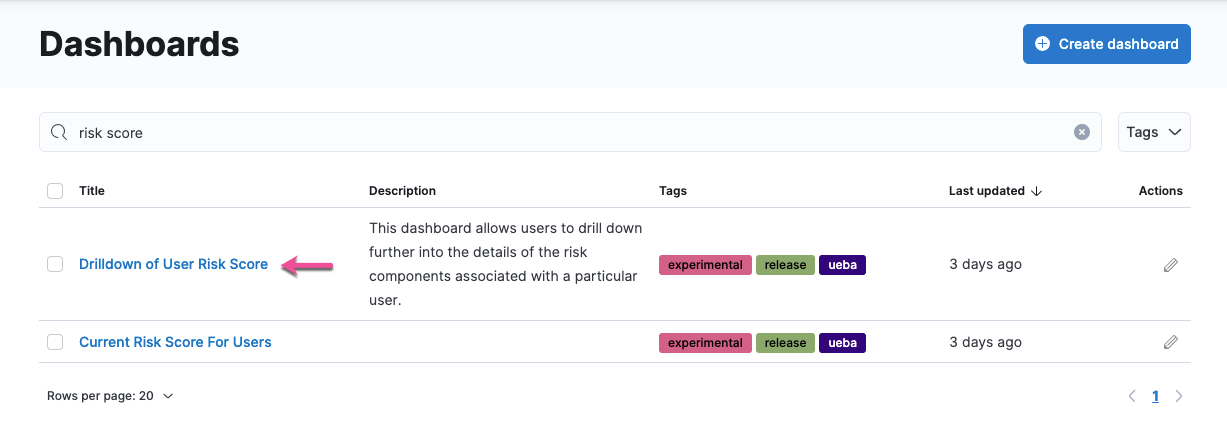
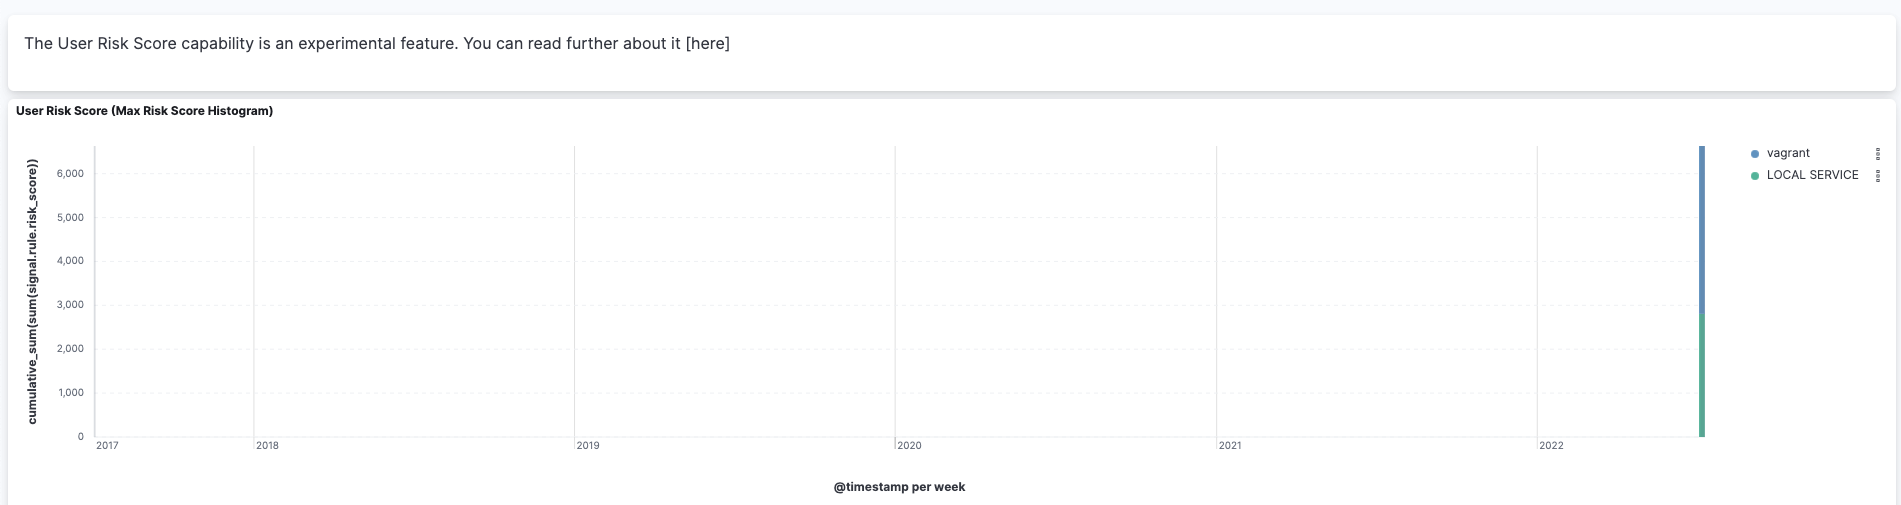
Use the histogram to track how the risk score for a particular user has changed over time. To specify a date range, use the date and time picker or drag and select a time range within the histogram. Click View source dashboard to view the top values of user.name and risk.keyword.
The data tables beneath the histogram display alert counts by users, alert counts by host, and associated MITRE ATT&CK tactics of risky users. The table data is sorted in reverse chronological order by default, with the highest total risk score at the top. Use this information to triage users with the highest risk in your network.