View detection alert details
editView detection alert details
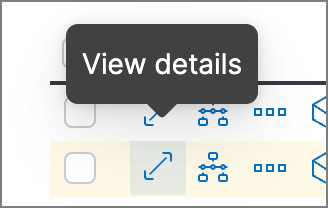
editTo inspect a detection alert, click the View details button from the Alerts table. The alert details flyout appears with several options to view alert data.
The alert details flyout contains these informational tabs:
- Overview: A summary of the alert, including relevant fields and selected threat intelligence details. Learn more.
- Threat Intel: A list of individual threats matching the alert. Learn more.
- Table: The alert data in table format. Data is organized into field-value pairs.
- JSON: The alert data in JSON format.
Overview tab
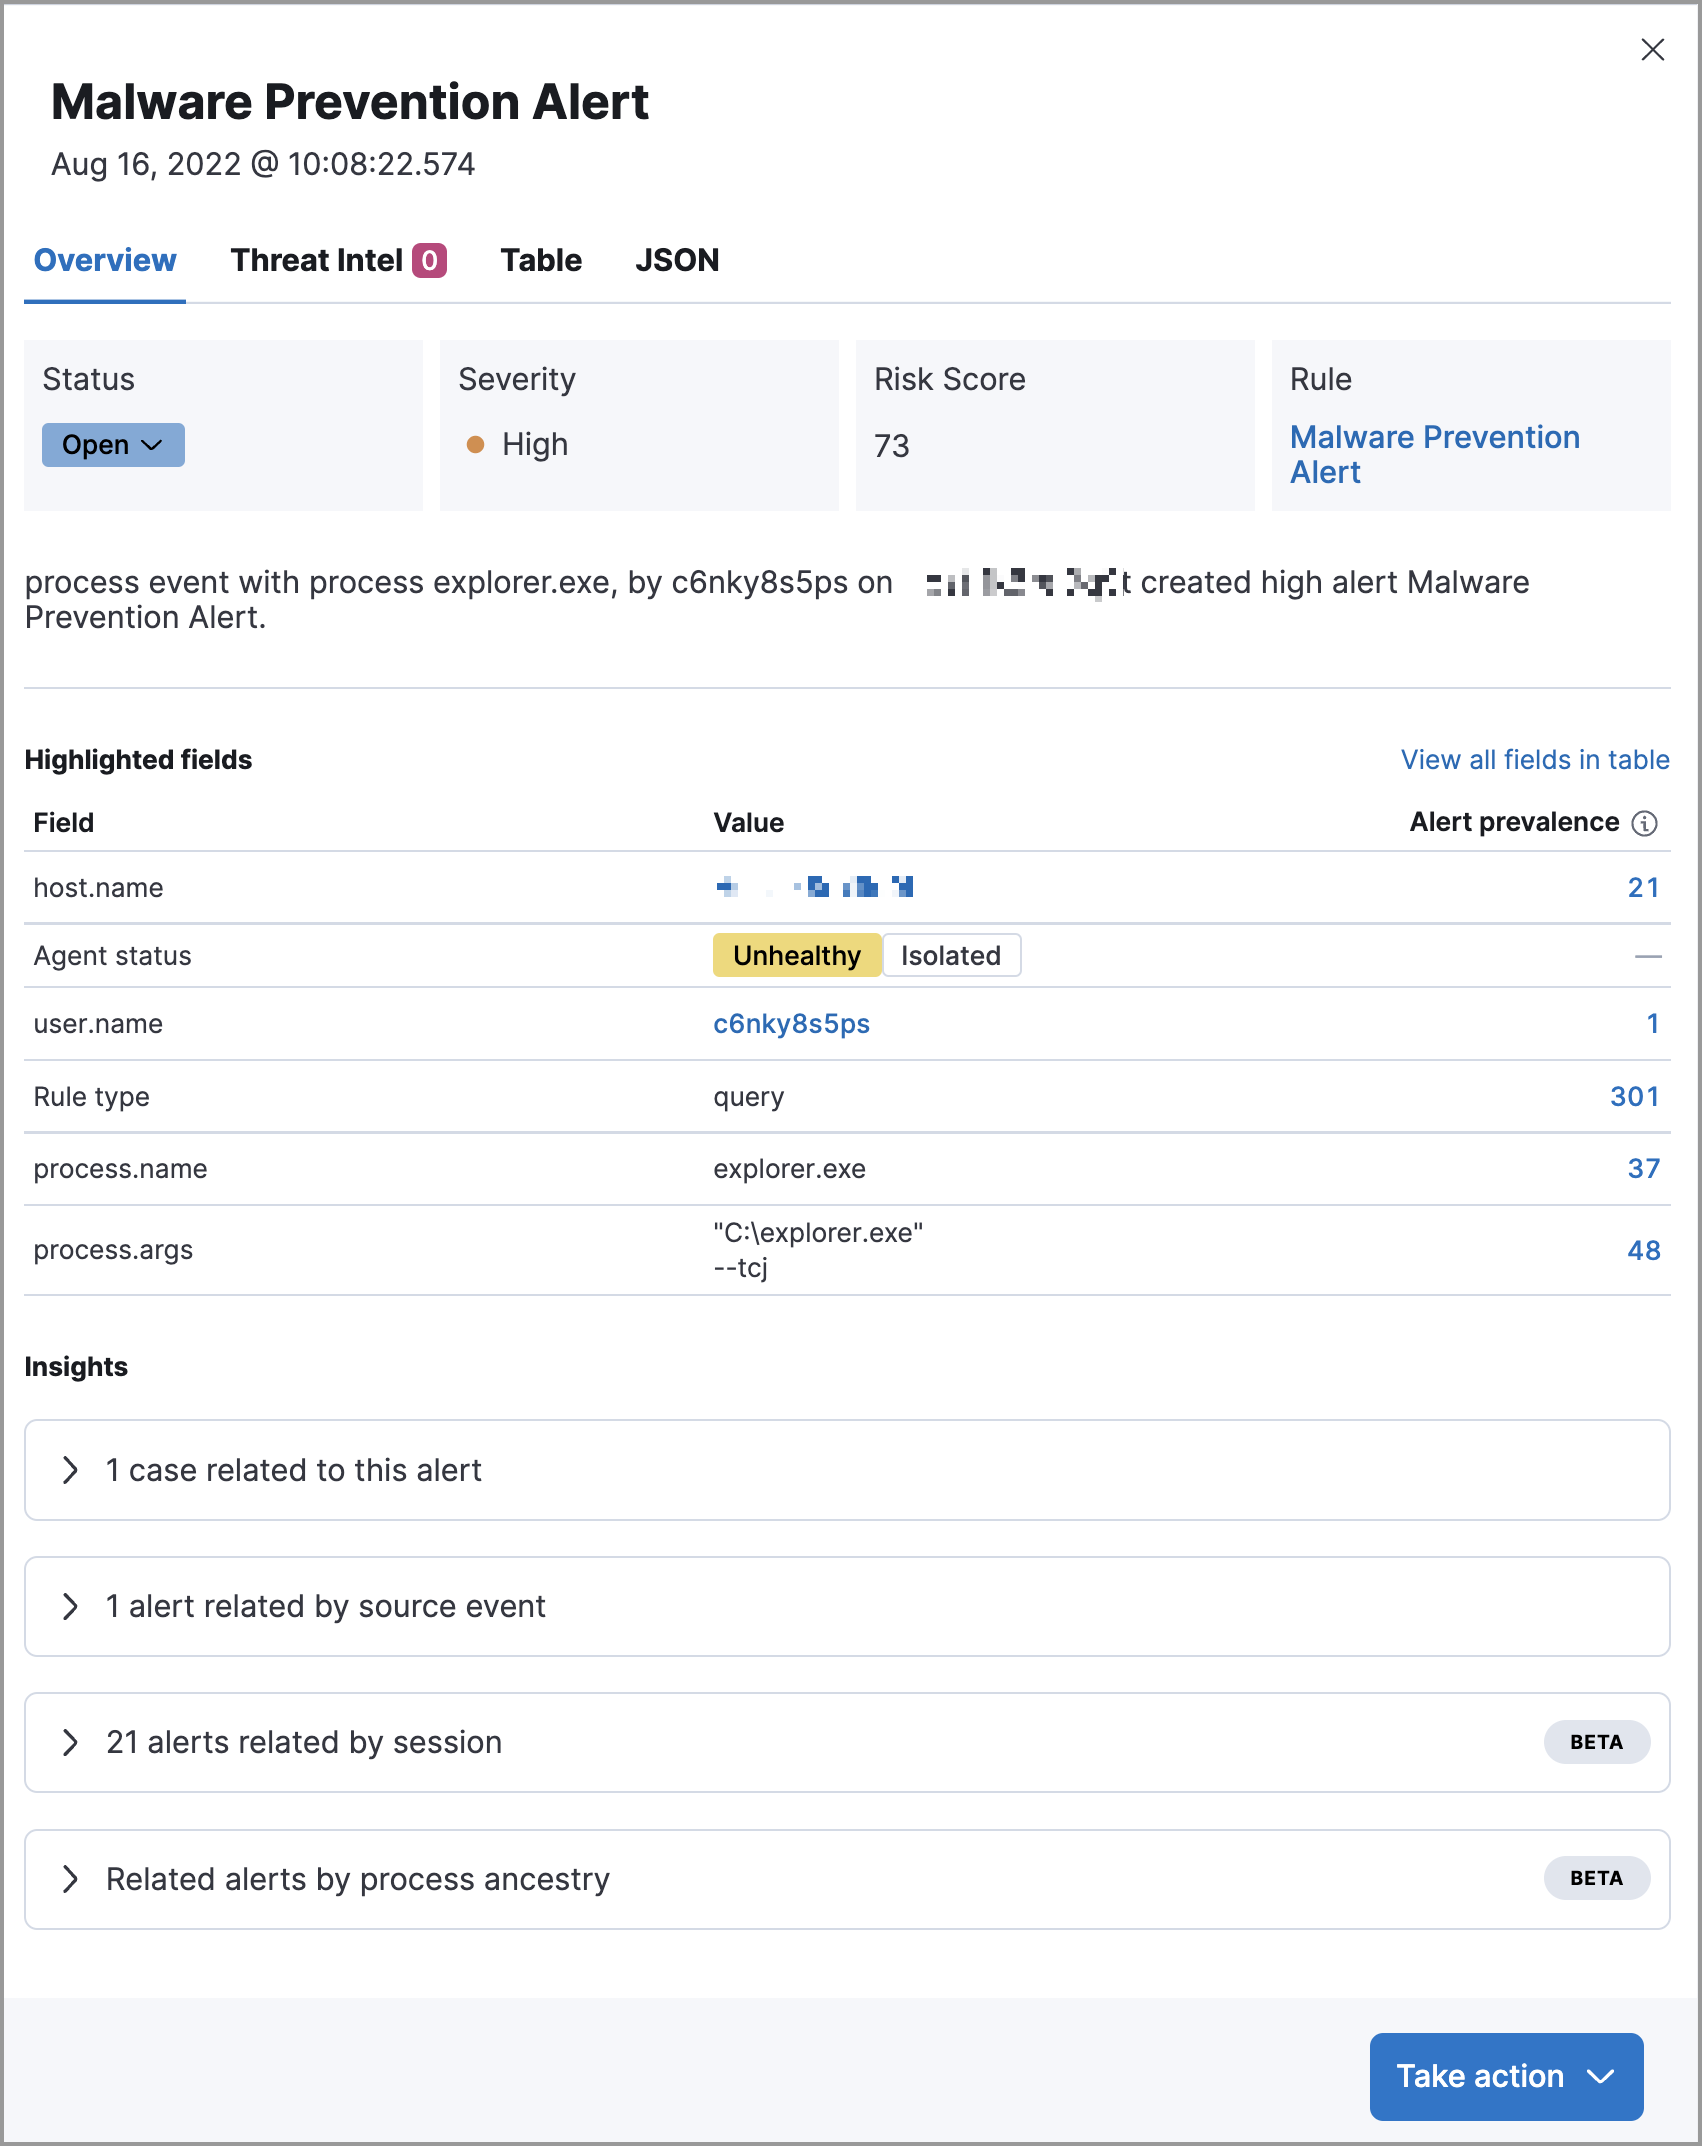
editThe Overview tab summarizes the alert and shows relevant threat intelligence details. Use this information to understand what generated the alert so you can triage and resolve it.
The Overview tab contains these features:
- Summary: Displays general details such as the alert’s status, severity, risk score, and a link to the detection rule that produced the alert.
- Reason statement: Provides a description of what generated the alert and provides general alert details. You can use this to understand the alert’s origin and determine if the alert is relevant to your investigation.
- Highlighted fields: Surfaces the most relevant fields for the alert type. Use this to inform your triage efforts as you investigate the alert.
-
Alert prevalence: Shows the total number of alerts within the selected time frame that have identical values. For example, an alert prevalence of 3 for
host.namemeans three alerts with the samehost.namevalue exist within the time frame.Alert prevalence data can help you investigate relationships with other alerts and gain context about the events producing alerts. You can also click the alert prevalence count to explore the alerts in Timeline.
Before investigating alert prevalence data in Timeline, save any Timelines you’re working on to ensure you can access them later.
- Insights: Shows relationships with associated alerts to help you quickly identify patterns. Refer to Insights on alerts for more information.
-
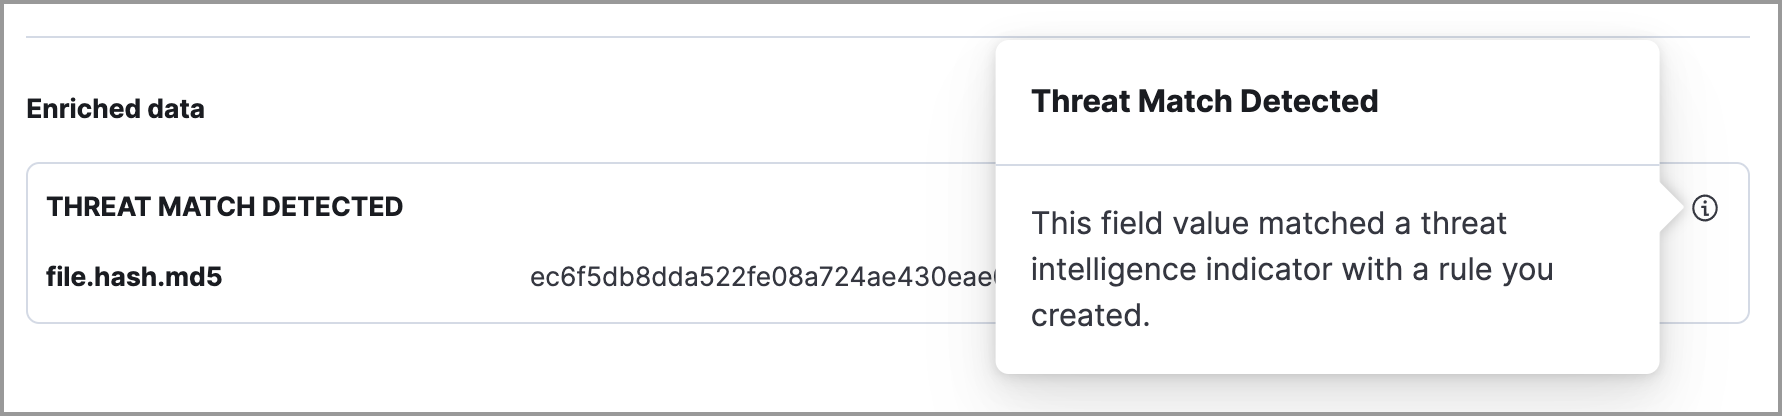
Enriched data: Displays available threat indicator matches and threat intelligence data. This section only displays when examining alerts with intelligence data. Click the info icon to learn more about what data is collected. Refer to Enriched data on alerts for more information.
Insights on alerts
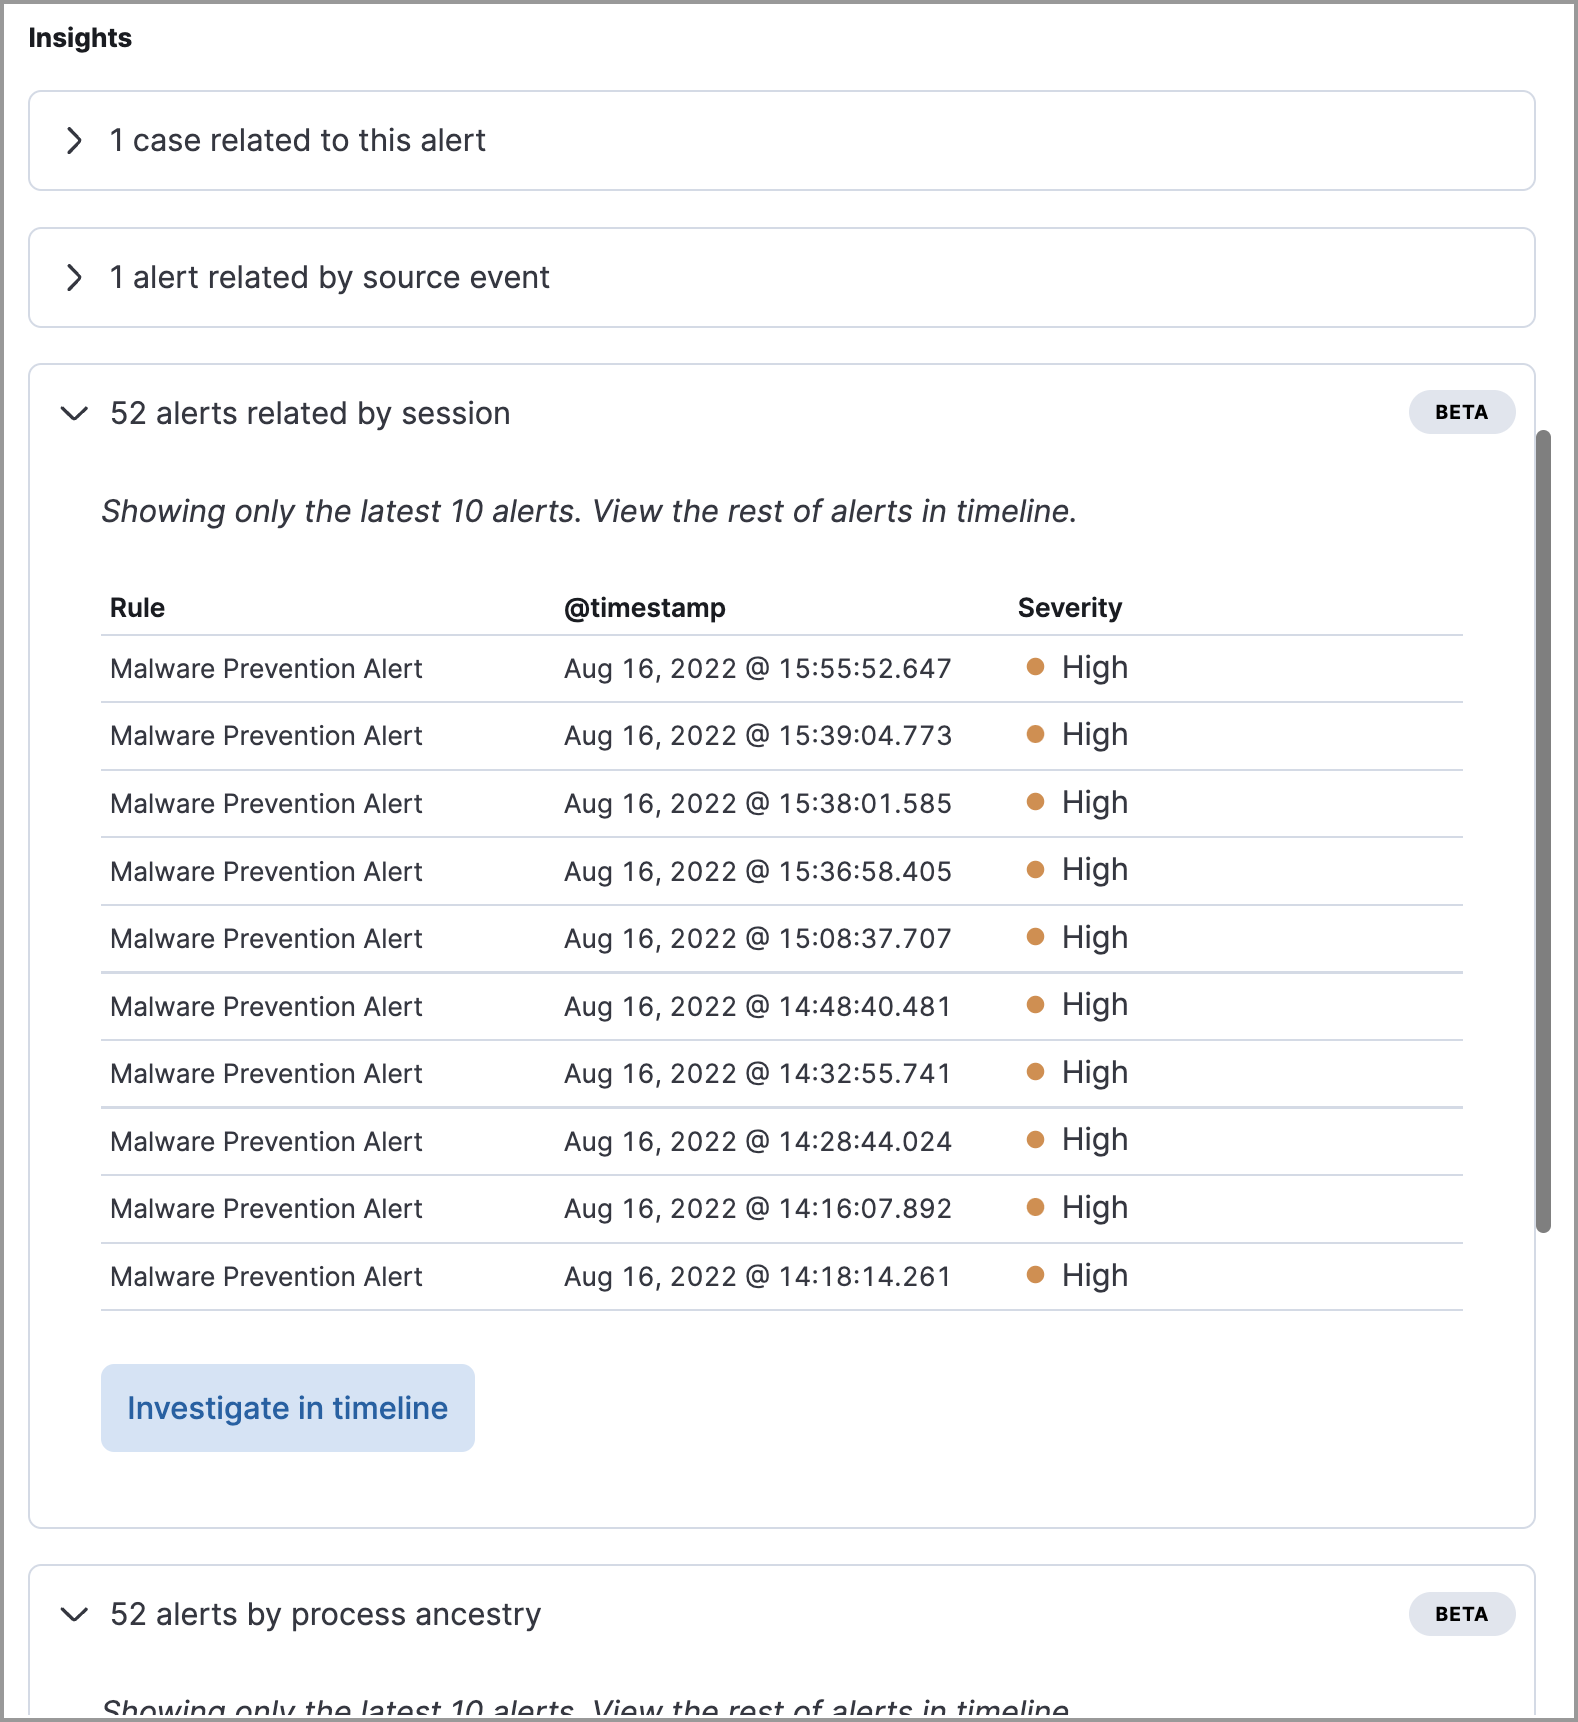
editThe Insights section shows you how an alert is related to other alerts and offers ways to investigate related alerts. You can use this information to quickly find patterns between alerts and then take action.
Within the Insights section, you can click on the title for each insight to expand or collapse it.
The Insights section provides the following details:
- Cases related to the alert - Shows the total number and names of cases to which the alert has been added. Click a case’s name to open its details.
- Alerts related by source event - Shows the ten most recent alerts created by the same source event. This can help you find alerts with a shared origin and provide more context about the source event. Click the Investigate in timeline button to examine related alerts in Timeline.
-
Alerts related by session ID - Shows the ten most recent alerts generated during the same session. These alerts share the same Session ID, which is a unique ID for tracking a given Linux session.
This functionality is in beta and is subject to change. The design and code is less mature than official GA features and is being provided as-is with no warranties. Beta features are not subject to the support SLA of official GA features.
This feature requires a Platinum or Enterprise subscription. In addition, the Include session data setting must be enabled on your Endpoint and Cloud Security integration policy. Refer to Enable Session View data for more information.
-
Alerts related by process ancestry - Shows alerts that are related by process events on the same linear branch. Note that alerts generated from processes on child or related branches are not shown. To further examine alerts, click Investigate in timeline.
This functionality is in beta and is subject to change. The design and code is less mature than official GA features and is being provided as-is with no warranties. Beta features are not subject to the support SLA of official GA features.
This feature requires a Platinum or Enterprise subscription. In addition, to display it within the Insights section, you must also add the following feature flag to the
kibana.ymlfile:xpack.securitySolution.enableExperimental: ['insightsRelatedAlertsByProcessAncestry']
Enriched data on alerts
editWhen gathering threat intelligence data for an alert, Elastic Security queries the alert for indicator matches from the past 30 days. The query looks for the following fields:
-
file.hash.md5: The MD5 hash -
file.hash.sha1: The SHA1 hash -
file.hash.sha256: The SHA256 hash -
file.pe.imphash: Imports in a PE file -
file.elf.telfhash: Imports in an ELF file -
file.hash.ssdeep: The SSDEEP hash -
source.ip: The IP address of the source (IPv4 or IPv6) -
destination.ip: The event’s destination IP address -
url.full: The full URL of the event source -
registry.path: The full registry path, including the hive, key, and value
If these fields aren’t available, Elastic Security does not perform the query and does not display threat intelligence data for the alert.
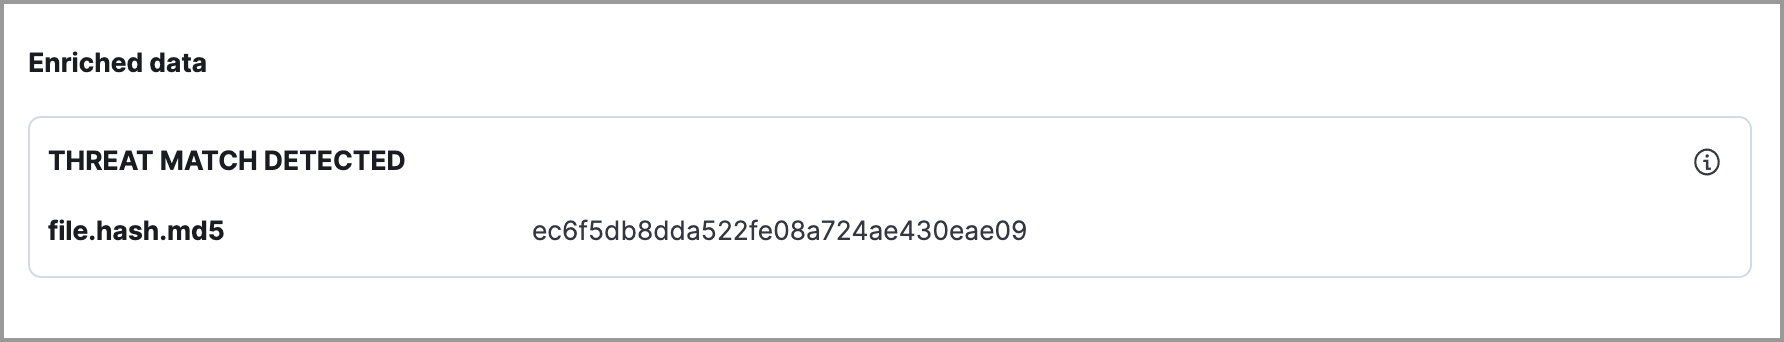
Discovered threat indicator match data is placed under the Threat Match Detected subsection of the Overview tab.
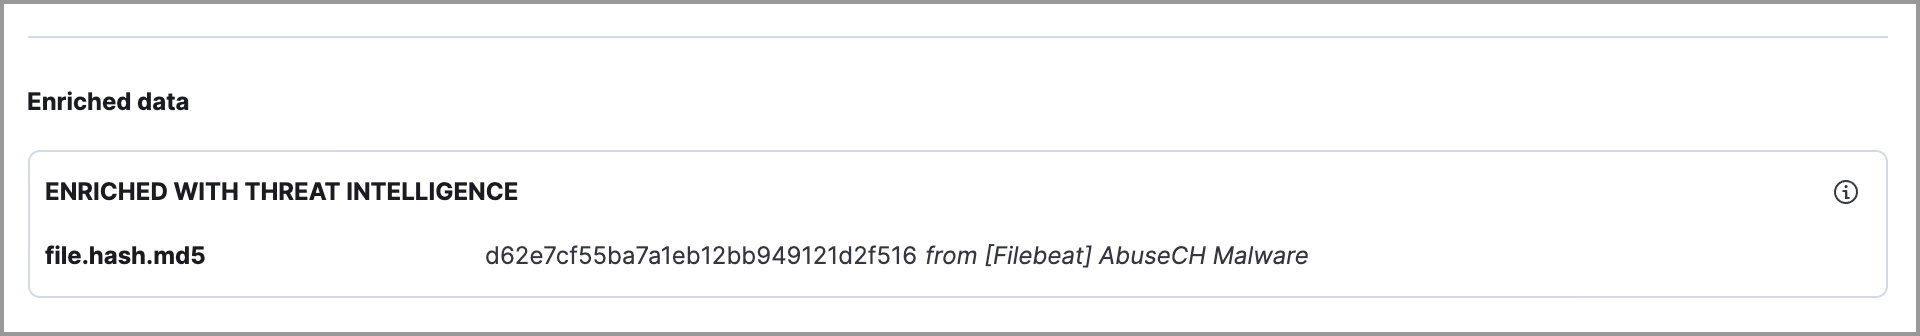
All other available threat intelligence data is placed under the Enriched with Threat Intelligence subsection of the Overview tab.
To learn more about the query, select the Threat Intel tab, then click the Inspect button next to the threat you want to inspect.
Additional threat intelligence data is generated for indicator match alerts when indicators are matched with source events, as outlined by the conditions in the relevant indicator match rule. Indicator match alerts always populate the Threat Matched Detected section under the Threat Intel tab with additional threat match data.
After upgrading to Elastic Stack version 7.15.0 or newer from release versions 7.12.0 through 7.14.2, you need to migrate detection alerts enriched with threat intelligence data to ensure threat intelligence properly displays in Elastic Security. For more information, refer to instructions for migrating detection alerts enriched with threat intelligence data.
Threat Intel tab
editThe Threat Intel tab shows the number of individual threats matching the alert. You can expand and collapse threat details by clicking the arrow button at the end of the threat label. Each threat is labelled with values from the matched.field and matched.atomic fields and displays the threat intelligence provider. If the alert does not contain threat intelligence data, the Threat Intel tab displays a message that none is available.
Matched threats are organized into several sections, described below. Within each section, matched threats are shown in reverse chronological order, with the most recent at the top. All mapped fields are displayed for each matched threat.
- Threat Matched Detected: This section is solely reserved for threat indicator matches identified by an indicator match rule. Threat indicator matches are produced whenever event data matches a threat indicator field value in your indicator index. If indicator threat matches are not discovered, the section displays a message that none are available.
- Enriched with Threat Intelligence: This section shows indicator matches that Elastic Security found when querying the alert for fields with threat intelligence. You can use the date time picker to modify the query time frame, which looks at the past 30 days by default. Click the Inspect button, located on the far right of the threat label, to view more information on the query. If threat matches are not discovered within the selected time frame, the section displays a message that none are available.
The event enrichment query uses the indices specified in the securitySolution:defaultThreatIndex advanced setting. For more information, refer to Update default Elastic Security threat intelligence indices.