Session View
editSession View
editThis functionality is in beta and is subject to change. The design and code is less mature than official GA features and is being provided as-is with no warranties. Beta features are not subject to the support SLA of official GA features.
Session View is an investigation tool that allows you to examine Linux process data organized in a tree-like structure according to the Linux logical event model, with processes organized by parentage and time of execution. It displays events in a highly readable format that is inspired by the terminal. This makes it a powerful tool for monitoring and investigating session activity on your Linux infrastructure and understanding user and service behavior.
Session View displays:
edit- Interactive and non-interactive processes: Processes and services with or without a controlling tty.
- User information: The Linux user that executed each session or process, and any exec user changes.
- Process and event telemetry: Process information included in the Linux logical event model.
- Nested sessions: Sessions started by processes descended from the entry session.
- Alerts: Alerts in the context of the processes which caused them.
To view Linux session data from your Kubernetes infrastructure, you’ll need to set up the Kubernetes dashboard.
Enable Session View data
editSession View uses process data collected by the Endpoint and Cloud Security integration, but this data is not collected by default. To enable Session View data, go to Manage → Policies and edit one or more of your Endpoint and Cloud Security integration policies. On the Policy settings tab, scroll down to the Linux event collection section near the bottom of the page and turn on the Include session data toggle. Session View can only display data that was collected by Endpoint and Cloud Security when this setting was enabled. For more information about the additional fields collected by Endpoint and Cloud Security when this setting is enabled, refer to the Linux event model RFC.
Open Session View
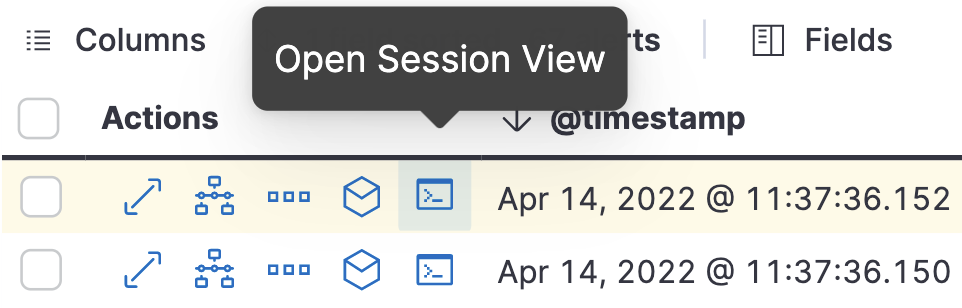
editSession View is accessible from the Hosts, Alerts, and Timelines pages, as well as the Kubernetes dashboard. Events and sessions that you can investigate in Session View have a rectangular Open Session View button in the Actions column. For example:
-
On the Alerts page, scroll down to view the Alerts table. Look for alerts that have the Open Session View button in the Actions column:
-
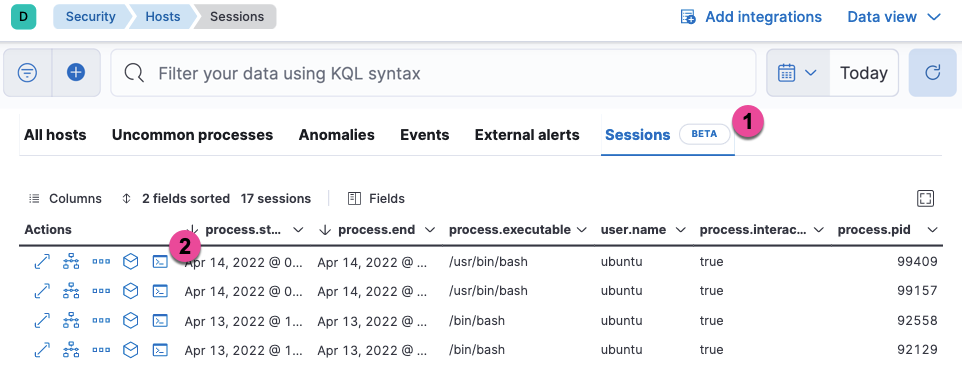
On the Hosts page (Explore → Hosts), select the Sessions or the Events tab. From either of these tabs, click the Open Session View icon for an event or session. Labeled below are 1) the Sessions tab, and 2) the Open Session View icon:
Session View UI
editThe Session View UI has the following features:
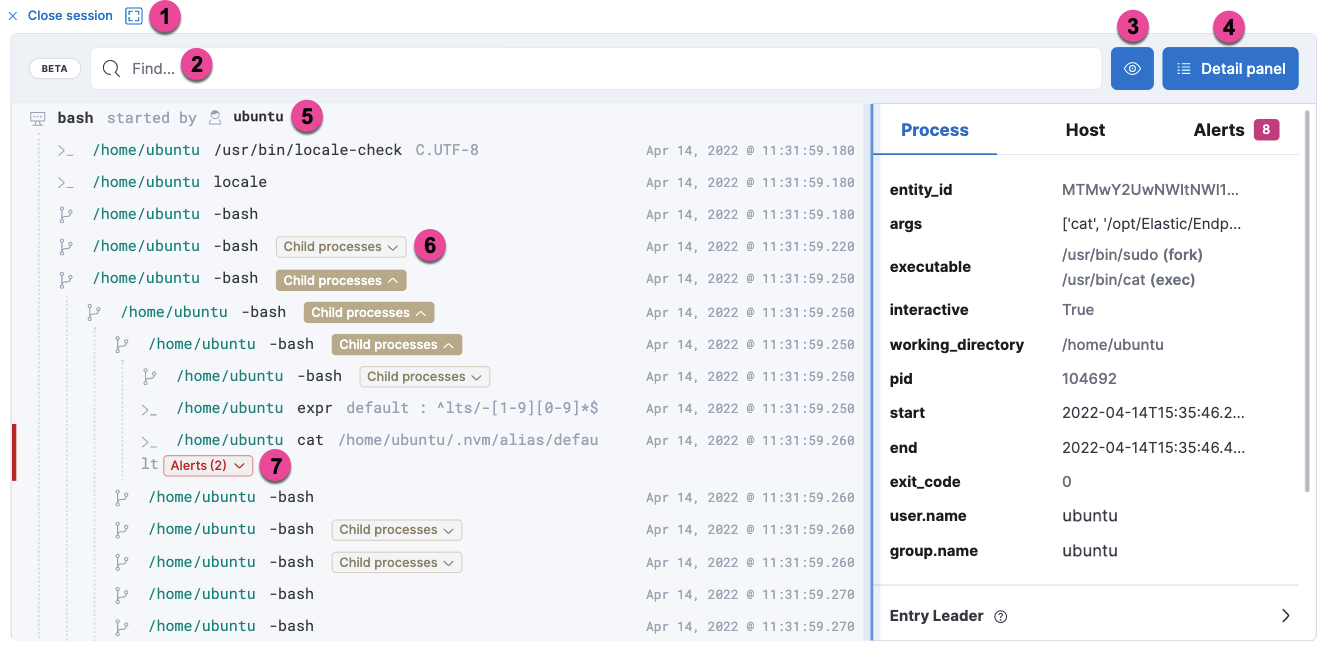
- The Close Session and Full screen buttons.
- The search bar. Use it to find and highlight search terms within the current session. The buttons on the right side of the search bar allow you to jump through search results.
- The display settings button. Click to toggle Timestamps and Verbose mode. With Verbose mode enabled, Session View shows all processes created in a session, including shell startup, shell completion, and forks caused by built-in commands. It defaults to off to highlight the data most likely to be user-generated and non-standard.
- The Detail panel button. Click it to toggle the Detail panel, which appears below the button and displays a wide range of additional information about the selected process’s ancestry and host, and any associated alerts. To select a process in Session View, click on it.
- The startup process. In this example, it shows that the session was a bash session. It also shows the Linux user "Ubuntu" started the session.
- The Child processes button. Click to expand or collapse a process’s children. You can also expand collapsed alerts and scripts where they appear. Collapsed processes will automatically expand when their contents match a search.
- The Alerts button. Click to show alerts caused by the parent process. Note the red line to the left of the process that caused the alert.
Session View includes an additional badge not pictured above:
-
The Exec user change badge highlights exec user changes, such as when a user escalates to root:
