What’s new in 8.5
editWhat’s new in 8.5
editHere are the highlights of what’s new and improved in Elastic Security. For detailed information about this release, check out the Release notes.
Other versions: 8.4 | 8.3 | 8.2 | 8.1 | 8.0 | 7.17 | 7.16 | 7.15 | 7.14 | 7.13 | 7.12 | 7.11 | 7.10 | 7.9
Introducing Elastic Defend
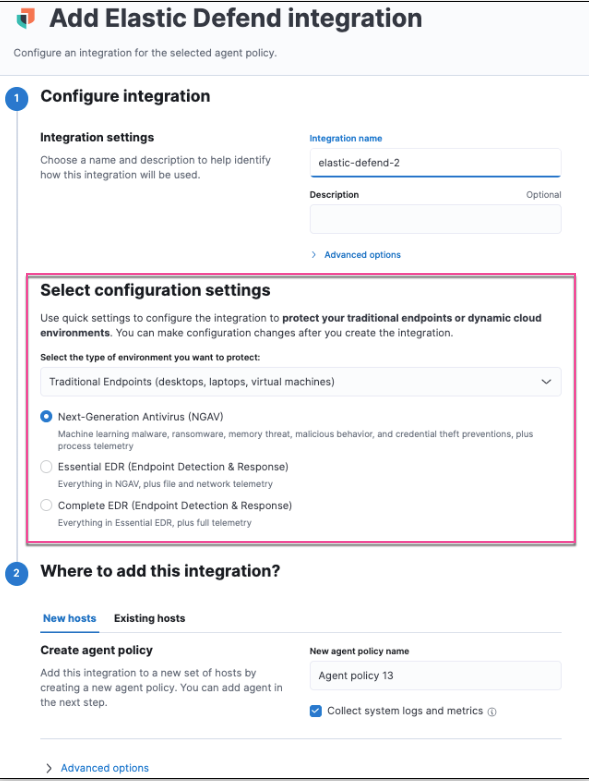
editThe integration that monitors events and provides threat prevention and detection on your hosts has been renamed from Endpoint and Cloud Security to Elastic Defend.
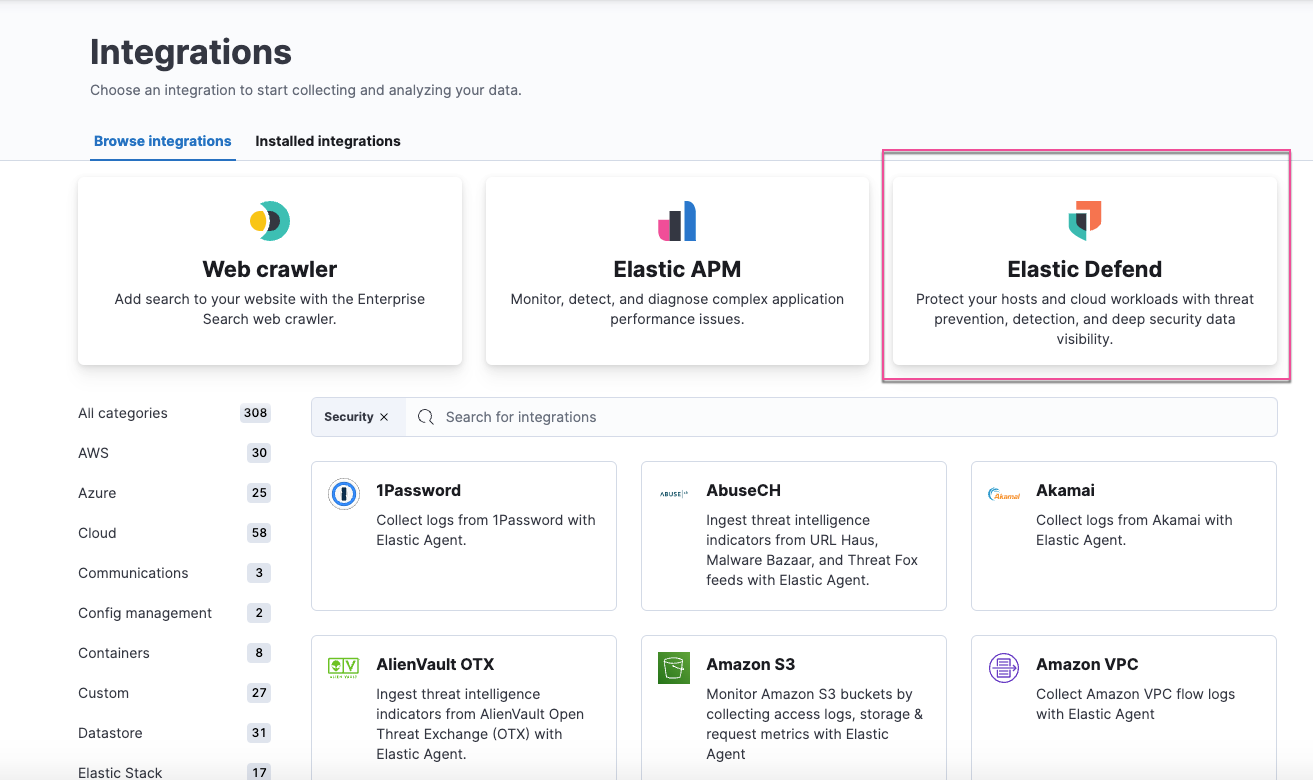
When installing the Elastic Defend integration, you can now select from several pre-configured use cases, which you can customize as needed. For more information on how to get started, refer to Configure and install the Elastic Defend integration.
Kubernetes and Cloud Security Posture enhancements
editTerminal output collection
Elastic Defend can now collect terminal output, which allows Session View to provide a complete history of Linux sessions through the terminal output viewer.
Test Kubernetes clusters with Kubernetes Security Posture Management (KSPM) integration
In addition to unmanaged clusters, you can now use the KSPM integration to test the security of your Kubernetes clusters managed by Amazon EKS.
Detection rules enhancements
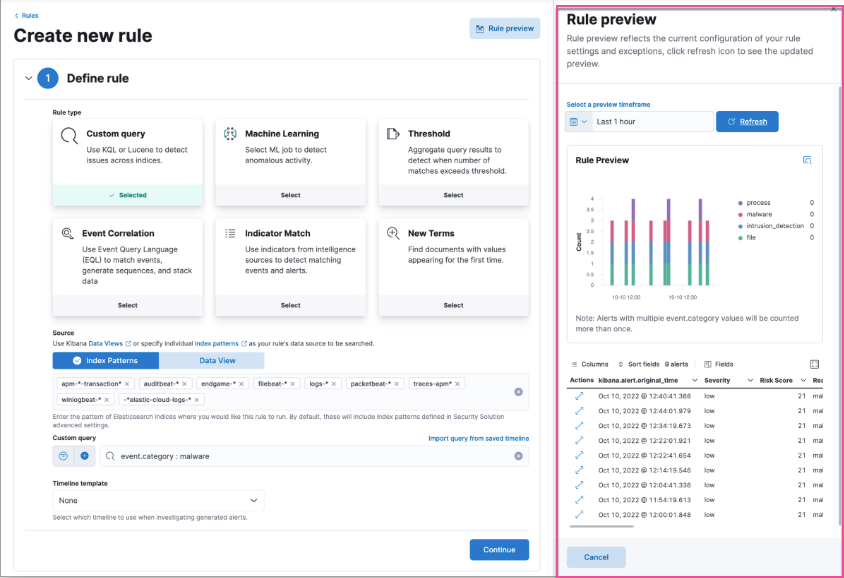
editEnhancements to rule preview
You can now preview a rule at any step of creating or editing a rule, and can preview Elastic prebuilt rules. Rule previews also now include exceptions and field overrides.
Choose saved query behavior with custom query rules
When selecting a saved query to define a custom query rule, you can now choose whether to use the saved query on every rule execution or to use it once to populate the rule’s query settings.
New bulk edit rule options
You can now bulk edit rule actions and rule schedules on multiple detection rules.
Enhancements to rule exceptions
There are several enhancements and UI improvements to rule exceptions:
- When adding a rule exception, you can now create value lists for all rule types. Note that you can’t use text type value lists for event correlation and threshold rules.
- If a rule has or allows endpoint exceptions, there are two exception tabs: the Rule exceptions tab and a new Endpoint exceptions tab. The Endpoint exceptions tab provides an easy way to manage endpoint exceptions.
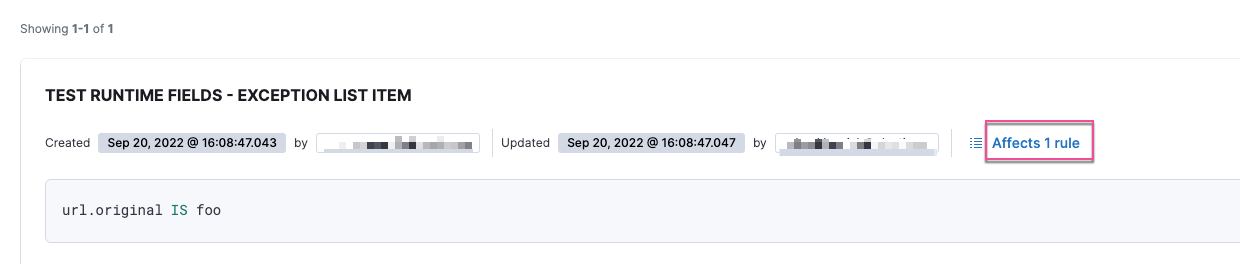
- You can now check how many other rules are affected by an exception by clicking Affects X rules next to an exception list item.
New prebuilt rules
28 new prebuilt rules were added in 8.5.0.
Endpoint response enhancements
editUpdated messaging in response console
The response console UI now displays a message if response action commands aren’t supported by an installed version of Elastic Agent, which must be 8.4 or later.
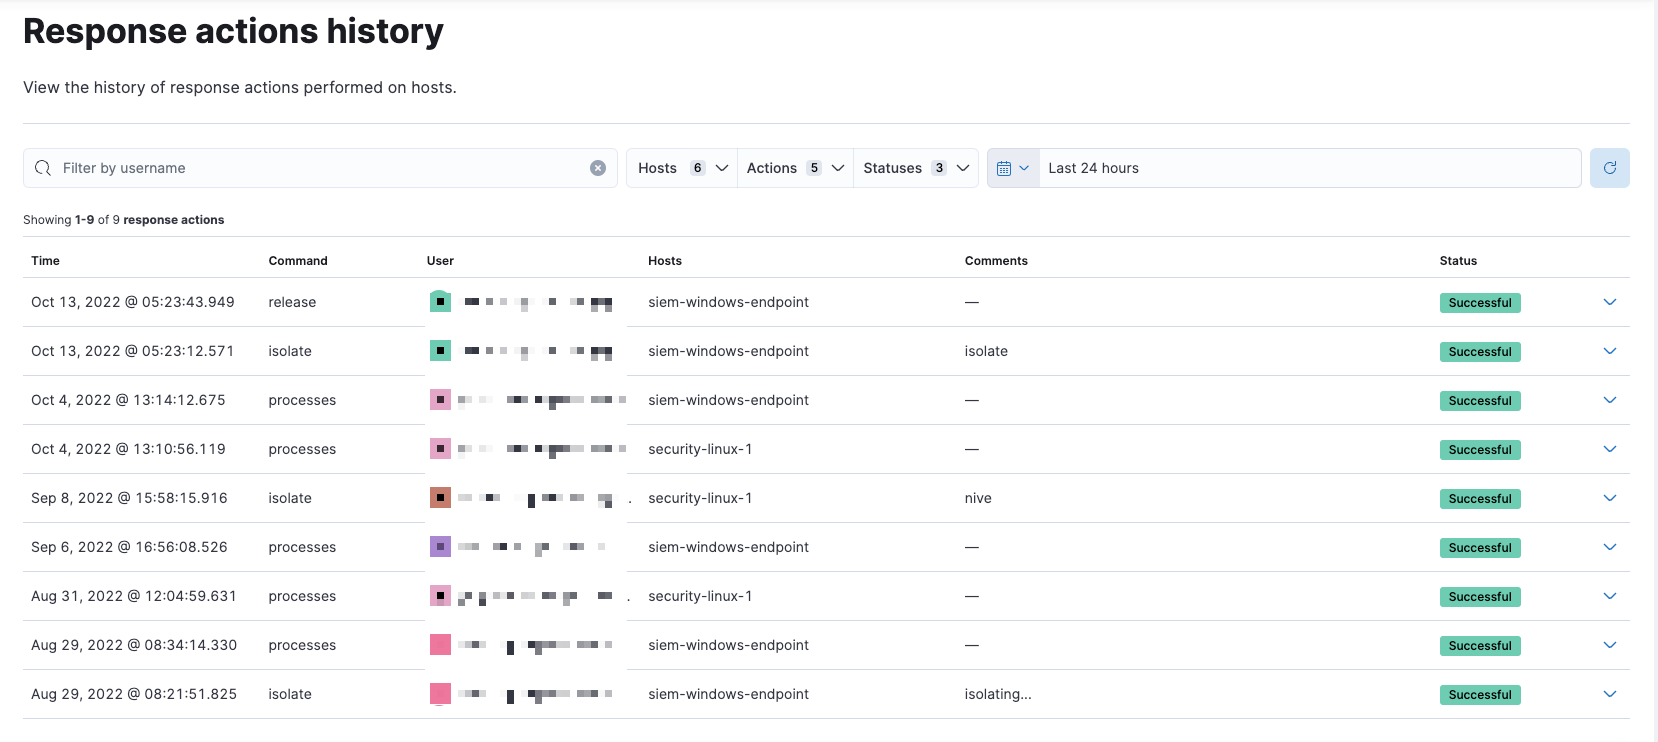
Response actions history log for all endpoints
You can now filter and search endpoint response actions history for an endpoint. In addition, there’s now a standalone Response actions history page that shows an action log of all endpoints.
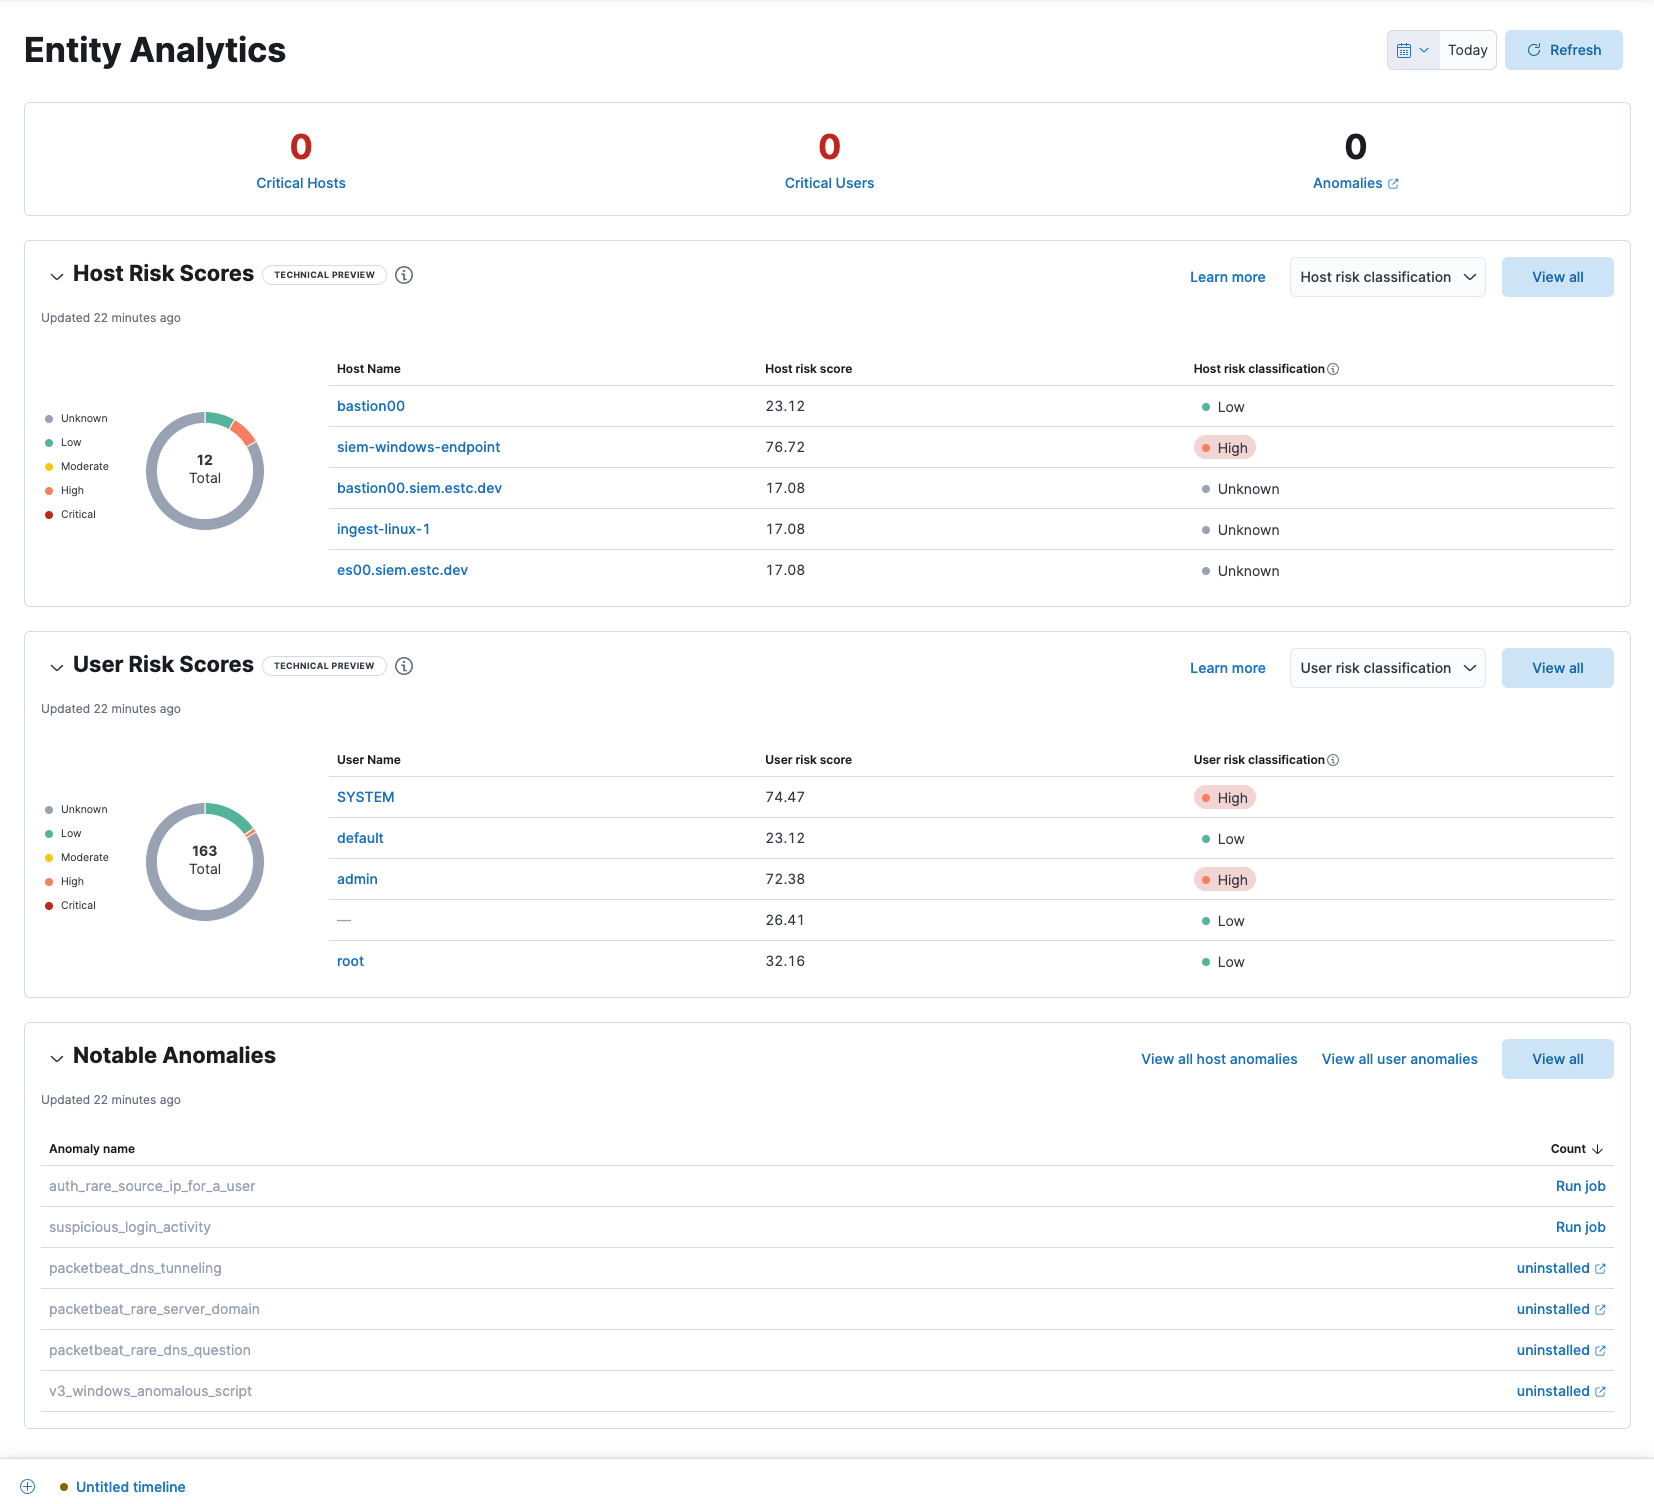
New Entity Analytics dashboard
editThe Entity Analytics dashboard provides a centralized view of emerging insider threats — including host risk, user risk, and notable anomalies from within your network. Use it to triage, investigate, and respond to emerging threats.
You can also enable host risk score and user risk score directly from this dashboard simply by clicking the Enable button. To learn more, refer to Host risk score and User risk score.
Alerts enhancements
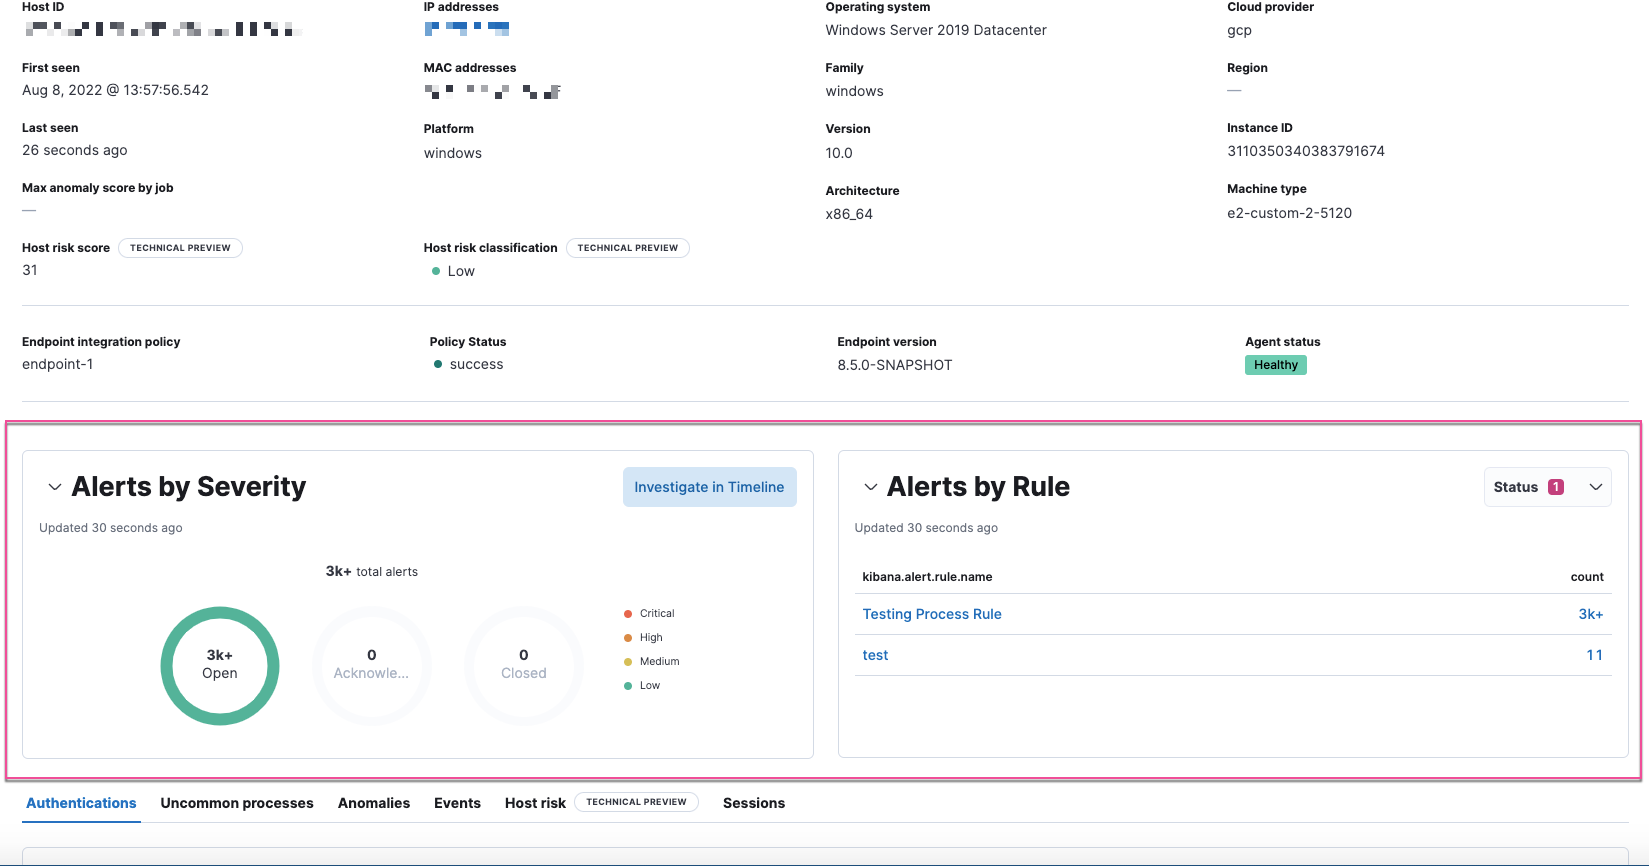
editAlert counts displayed on Explore detail pages
Each of the Explore detail pages (host details, network details, and user details) now displays alert metrics that show the total number of alerts by severity, rule, and status.
Visual event analyzer enhancements
- If you have a Platinum subscription or higher, by default, you can now examine alerts associated with the event.
- The visual event analyzer automatically displays the entire process tree if you select a time range that doesn’t have any process events. You’ll also receive a message that your time range is too narrow.
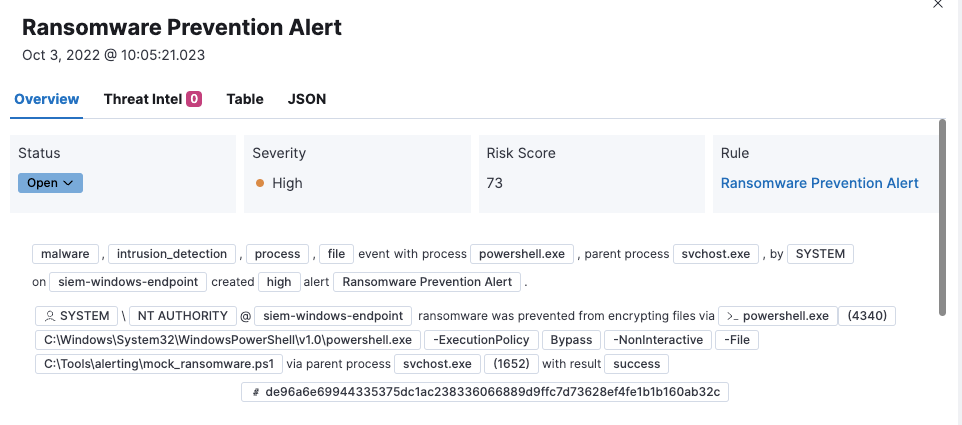
Alert details flyout enhancements
The following enhancements have been made to the alert details flyout. To learn more about analyzing detection alerts, refer to View alert details.
-
Improvements to the Overview tab:
- Reason statement shown in rendered view - The alert rendered view displays event details, such as the alert reason statement, file paths, or process arguments, to provide context for the alert. You can take action (such as Add to Timeline) on individual fields in the statement.
-
Event renderer added to the Overview tab - The event renderer displays relevant event details to provide context for the alert, such as file paths or process arguments. You can take actions on any of the fields provided.
-
If you have a Platinum subscription or higher, these details are included in the Insights section:
- Alerts related by session ID - Shows the ten most recent alerts generated during the same session. These alerts share the same session ID, a unique ID for tracking a given Linux session. To use this feature, you must enable the Include session data setting in your Elastic Defend integration policy.
- Alerts related by process ancestry - Shows alerts that are related by process events on the same linear branch.
- Risk score data included - Risk score classification data is displayed in the Enriched data section. If the current risk classification has changed from the original, both scores display to show the difference.
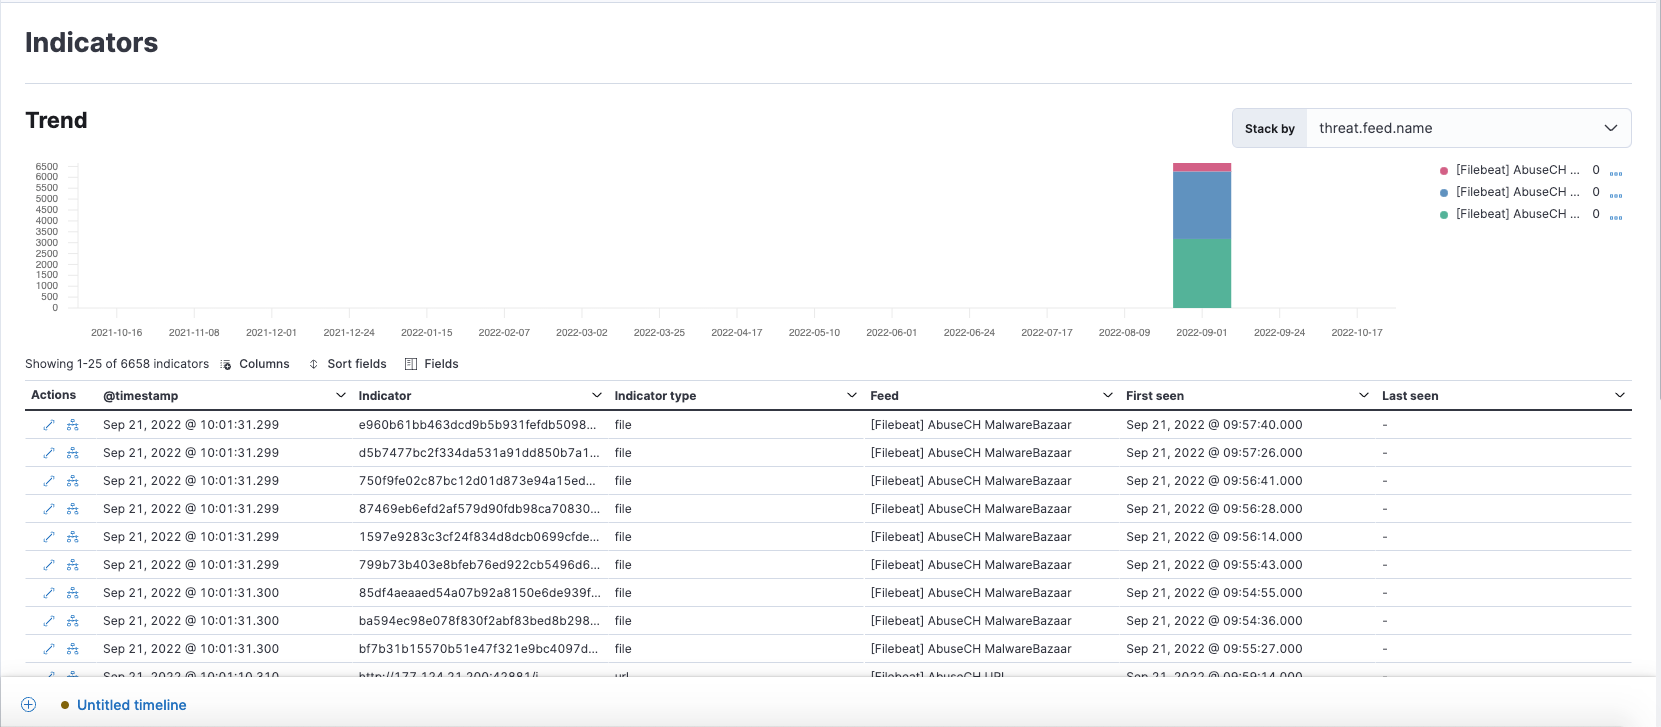
New Indicators page
editThe Indicators page provides a centralized view for threat intelligence analysts to view and investigate indicators of compromise (IoCs). To learn more about this feature, refer to Indicators of compromise.
Assign users to a case
editYou can now assign users to a case if they meet the necessary prerequisites.
Osquery enhancements
edit- Add Osquery results to a case - After users run Osquery from an alert, they can add Osquery results to a new or an existing case.
- Use Osquery Response Action to query hosts - Users can use the Osquery Response Action to immediately query hosts that generate alerts. Note that Osquery Response Actions are currently a technical preview feature.
- Run Osquery queries from an investigation guide - When analyzing an alert, you can now add queries to a rule’s investigation guide and run it as part of your investigation.