Users page
editUsers page
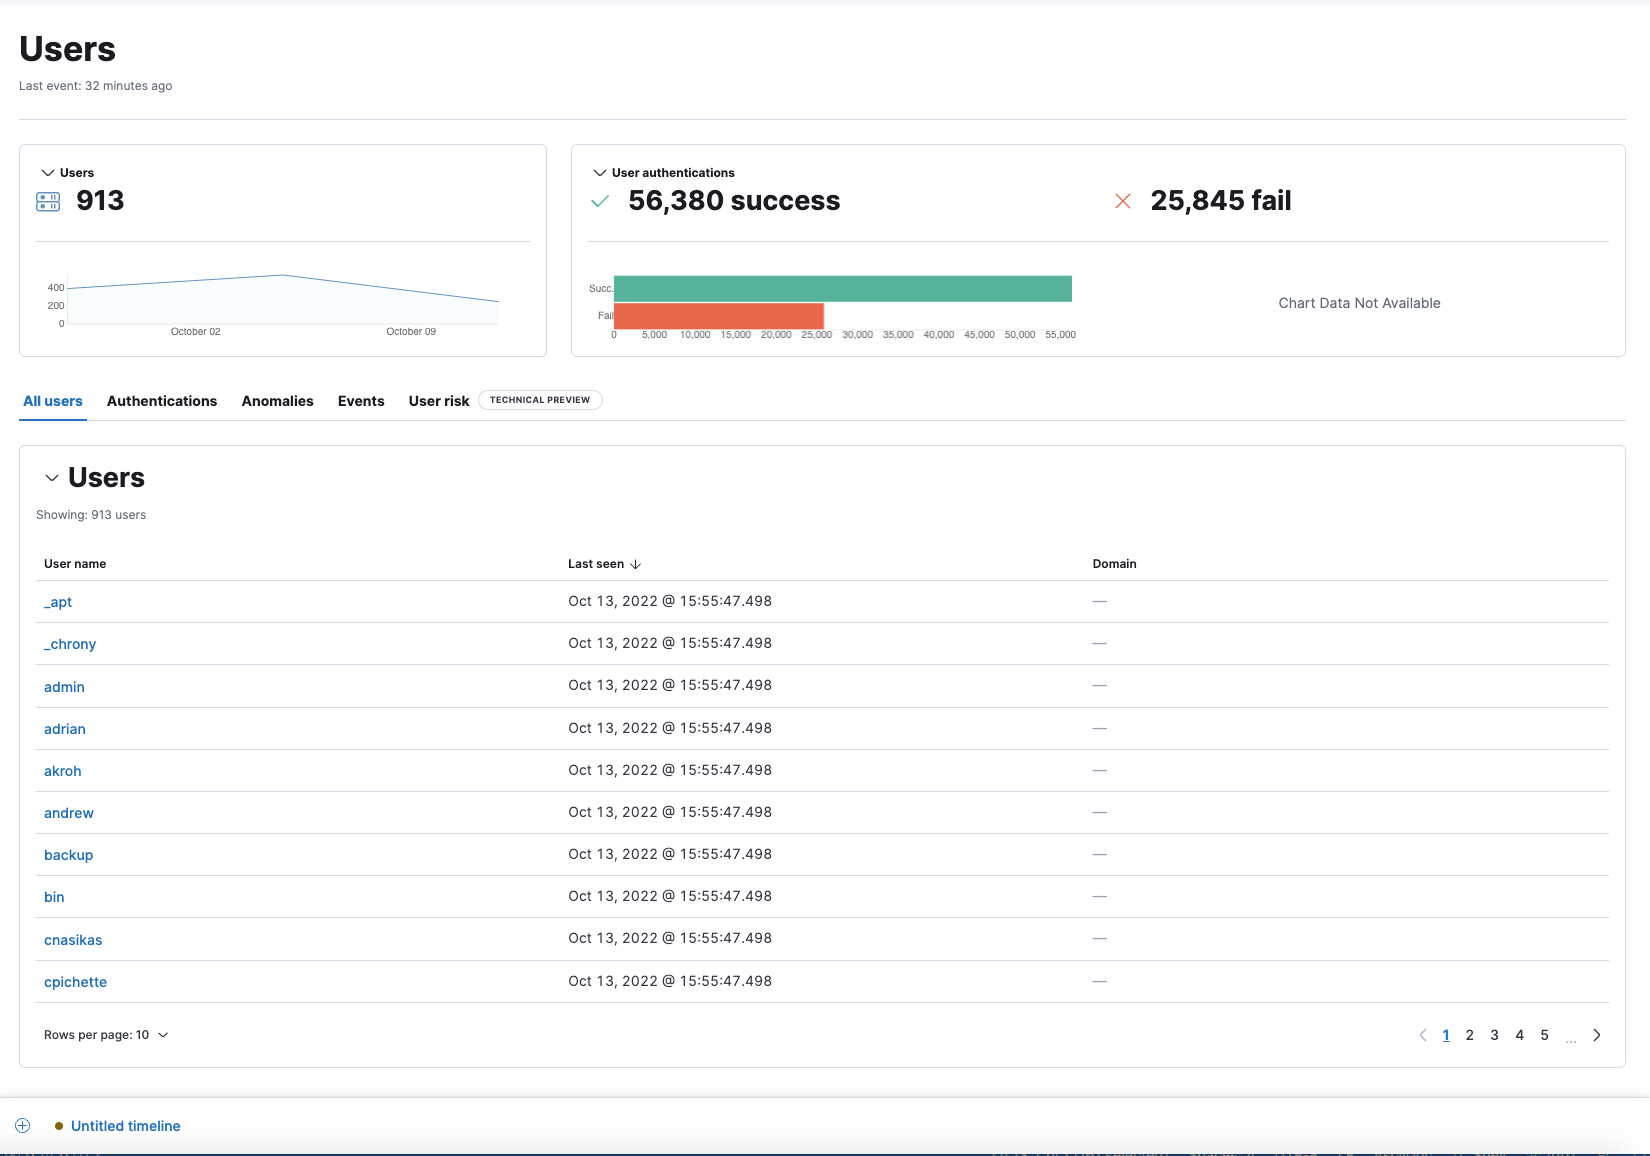
editThe Users page provides a comprehensive overview of user data to help you understand authentication and user behavior within your environment. Key performance indicator (KPI) charts, data tables, and interactive widgets let you view specific data and drill down for deeper insights.
The Users page has the following sections:
User KPI (key performance indicator) charts
editKPI charts show the total number of users and successful and failed user authentications within the time range specified in the date picker. Data in the KPI charts is visualized through linear and bar graphs.
Hover inside a KPI chart to display the actions menu (…), where you can perform these actions: inspect, open in Lens, and add to a new or existing case.
Data tables
editBeneath the KPI charts are data tables, which are useful for viewing and investigating specific types of data. Select the relevant tab to view the following details:
- All users: A chronological list of unique user names, when they were last active, and the associated domains.
- Authentications: A chronological list of user authentication events and associated details, such as the number of successes and failures, and the host name of the last successful destination.
- Anomalies: Unusual activity discovered by machine learning jobs that contain user data.
-
Events: Ingested events that contain the
user.namefield. You can stack by theevent.action,event.dataset, orevent.modulefield. To display alerts received from external monitoring tools, scroll down to the Events table and select Show only external alerts on the right. - User risk: The latest recorded user risk score for each user, and its user risk classification. This feature requires a Platinum subscription or higher and must be enabled to display the data. Click Enable on the User risk tab to get started. To learn more, refer to our user risk score documentation.
The Events table includes inline actions and several customization options. To learn more about what you can do with the data in these tables, refer to Manage detection alerts.
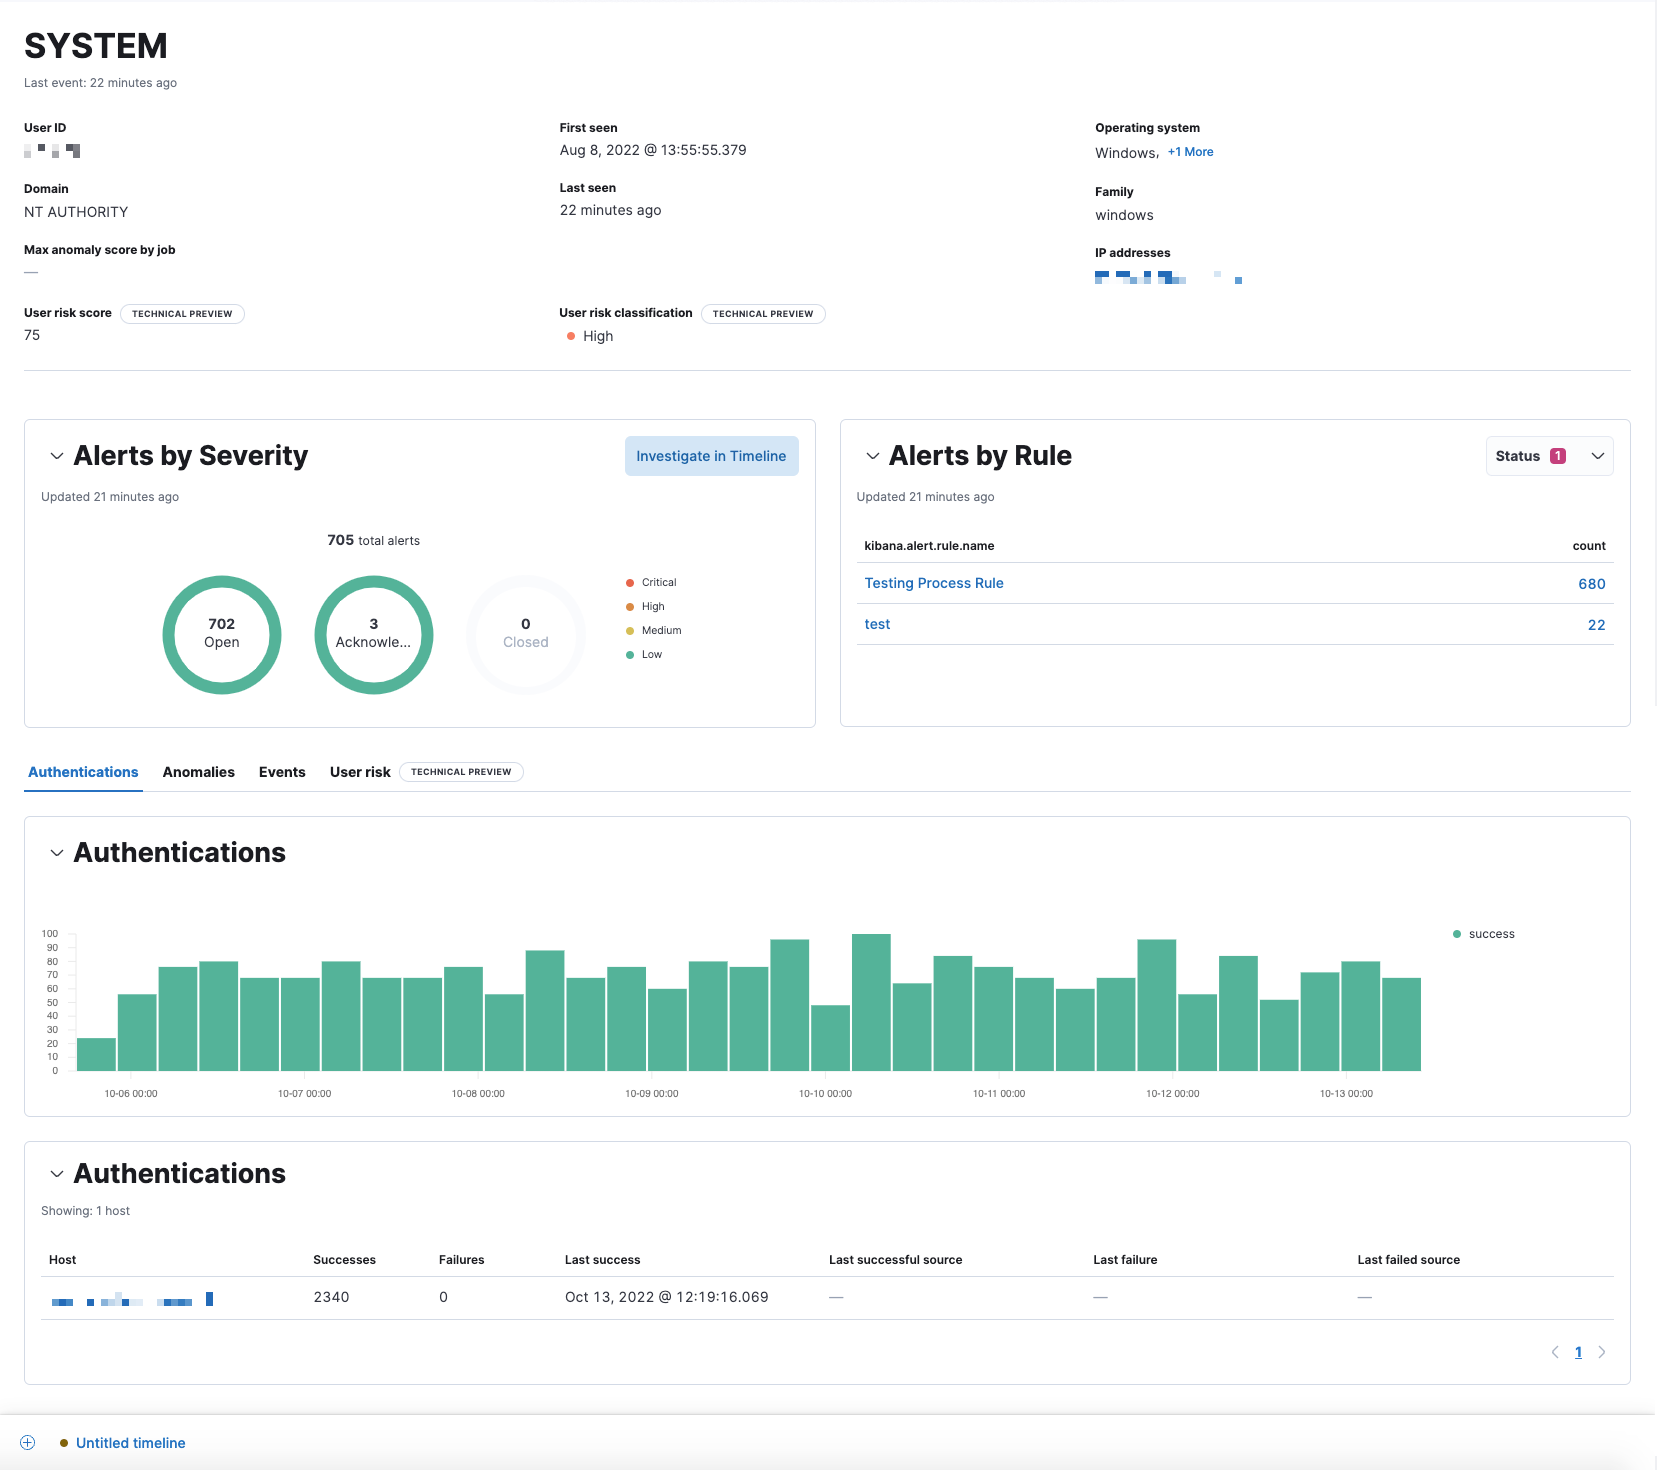
User details page
editA user’s details page displays all relevant information for the selected user. To view a user’s details page, click its User name link from the All users table.
The user details page includes the following sections:
- Summary: Details such as the user ID, when the user was first and last seen, the associated IP address(es), and operating system. If the user risk score feature is enabled, this section also displays user risk score data.
-
Alert metrics: The total number of alerts by severity, rule, and status (
Open,Acknowledged, orClosed). - Data tables: The same data tables as on the main Users page, except with values for the selected user instead of for all users.