Getting started with the Elastic Stack
editGetting started with the Elastic Stack
editLooking for an Elastic Stack ("ELK") guide that shows how to quickly install and configure the Elastic Stack? You’re in the right place! You can install the Elastic Stack on a single VM, or even on your laptop:
Logstash adds powerful data parsing and transformation features, but usually isn’t required. To get started with Logstash, see Getting Started with Logstash.
After completing the installation process, learn how to implement a system monitoring solution that uses Metricbeat to collect server metrics and ship the data to Elasticsearch. Then use Kibana to search and visualize the data.
Implementing security is a critical step in configuring the Elastic Stack. This guide skips security configuration to quickly install a sample installation. Before sending sensitive data across the network, secure the Elastic Stack and enable encrypted communications.
Before you begin
edit- See the Elastic Support Matrix for information about supported operating systems and product compatibility.
- Verify that your system meets the minimum JVM requirements for Elasticsearch.
Install Elasticsearch
editElasticsearch is a real-time, distributed storage, search, and analytics engine. It can be used for many purposes, but one context where it excels is indexing streams of semi-structured data, such as logs or decoded network packets.
You can run Elasticsearch on your own hardware, or use our hosted Elasticsearch Service on Elastic Cloud. The Elasticsearch Service is available on both AWS and GCP. Try out the Elasticsearch Service for free.
To download and install Elasticsearch, open a terminal window and use the commands that work with your system (deb for Debian/Ubuntu, rpm for Redhat/Centos/Fedora, mac or brew for OS X, linux for Linux, and win for Windows):
curl -L -O https://artifacts.elastic.co/downloads/elasticsearch/elasticsearch-7.14.2-amd64.deb
sudo dpkg -i elasticsearch-7.14.2-amd64.deb
sudo /etc/init.d/elasticsearch start
curl -L -O https://artifacts.elastic.co/downloads/elasticsearch/elasticsearch-7.14.2-x86_64.rpm
sudo rpm -i elasticsearch-7.14.2-x86_64.rpm
sudo service elasticsearch start
curl -L -O https://artifacts.elastic.co/downloads/elasticsearch/elasticsearch-7.14.2-darwin-x86_64.tar.gz
tar -xzvf elasticsearch-7.14.2-darwin-x86_64.tar.gz
cd elasticsearch-7.14.2
./bin/elasticsearch
brew tap elastic/tap
brew install elastic/tap/elasticsearch-full
elasticsearch
curl -L -O https://artifacts.elastic.co/downloads/elasticsearch/elasticsearch-7.14.2-linux-x86_64.tar.gz
tar -xzvf elasticsearch-7.14.2-linux-x86_64.tar.gz
cd elasticsearch-7.14.2
./bin/elasticsearch
- Download the Elasticsearch 7.14.2 Windows zip file from the Elasticsearch download page.
-
Extract the contents of the zip file to a directory on your computer, for
example,
C:\Program Files. -
Open a command prompt as an Administrator and navigate to the directory that contains the extracted files, for example:
cd C:\Program Files\elasticsearch-7.14.2
-
Start Elasticsearch:
bin\elasticsearch.bat
For other operating systems, go to the Elasticsearch download page.
The default cluster.name and
node.name are elasticsearch and your hostname,
respectively. If you plan to keep using this cluster or add more nodes, it is a
good idea to change these default values to unique names. For details about
changing these and other settings in the elasticsearch.yml file, see
Configuring Elasticsearch.
To learn more about installing, configuring, and running Elasticsearch, read the Elasticsearch Reference.
Make sure Elasticsearch is up and running
editTo test that the Elasticsearch daemon is up and running, try sending an HTTP GET request on port 9200.
curl http://127.0.0.1:9200
On Windows, if you don’t have cURL installed, point your browser to the URL.
You should see a response similar to this:
{
  "name" : "QtI5dUu",
  "cluster_name" : "elasticsearch",
  "cluster_uuid" : "v8OWkR1OQO-rgV8o_lRhEA",
  "version" : {
    "number" : "7.14.2",
    "build_flavor" : "default",
    "build_type" : "tar",
    "build_hash" : "f4d76bd413ecfbd5122c3aa5dc85465960f18afe",
    "build_date" : "2021-04-23T15:58:28.336786977Z",
    "build_snapshot" : false,
    "lucene_version" : "8.8.2",
    "minimum_wire_compatibility_version" : "6.8.0",
    "minimum_index_compatibility_version" : "6.0.0-beta1"
  },
  "tagline" : "You Know, for Search"
}
Install Kibana
editKibana is an open source analytics and visualization platform designed to work with Elasticsearch. You use Kibana to search, view, and interact with data stored in Elasticsearch indices. You can easily perform advanced data analysis and visualize your data in a variety of charts, tables, and maps.
Running our hosted Elasticsearch Service on Elastic Cloud? Kibana is enabled automatically in most templates, or manually with the flick of a switch.
We recommend that you install Kibana on the same server as Elasticsearch,
but it is not required. If you install the products on different servers, you’ll
need to change the URL (IP:PORT) of the Elasticsearch server in the Kibana configuration
file, kibana.yml, before starting Kibana.
To download and install Kibana, open a terminal window and use the commands that work with your system:
deb, rpm, or linux:
curl -L -O https://artifacts.elastic.co/downloads/kibana/kibana-7.14.2-linux-x86_64.tar.gz
tar xzvf kibana-7.14.2-linux-x86_64.tar.gz
cd kibana-7.14.2-linux-x86_64/
./bin/kibana
mac:
curl -L -O https://artifacts.elastic.co/downloads/kibana/kibana-7.14.2-darwin-x86_64.tar.gz
tar xzvf kibana-7.14.2-darwin-x86_64.tar.gz
cd kibana-7.14.2-darwin-x86_64/
./bin/kibana
brew:
brew tap elastic/tap
brew install elastic/tap/kibana-full
kibana
win:
- Download the Kibana 7.14.2 Windows zip file from the Kibana download page.
-
Extract the contents of the zip file to a directory on your computer, for
example,
C:\Program Files. -
Open a command prompt as an Administrator and navigate to the directory that contains the extracted files, for example:
cd C:\Program Files\kibana-7.14.2-windows
-
Start Kibana:
bin\kibana.bat
For other operating systems, go to the Kibana download page.
To learn more about installing, configuring, and running Kibana, read the Kibana Reference.
Launch the Kibana web interface
editTo launch the Kibana web interface, point your browser to port 5601. For example, http://127.0.0.1:5601.
Install Beats
editThe Beats are open source data shippers that you install as agents on your servers to send operational data to Elasticsearch. Beats can send data directly to Elasticsearch or via Logstash, where you can further process and enhance the data.
Each Beat is a separately installable product. In this guide, you learn how
to install and run Metricbeat with the system module enabled to collect system
metrics.
To learn more about installing and configuring other Beats, see the Getting Started documentation:
| Elastic Beats | To capture |
|---|---|
Audit data |
|
Log files |
|
Cloud data |
|
Availability monitoring |
|
Systemd journals |
|
Metrics |
|
Network traffic |
|
Windows event logs |
Install Metricbeat
editTo download and install Metricbeat, open a terminal window and use the commands that work with your system:
deb:
curl -L -O https://artifacts.elastic.co/downloads/beats/metricbeat/metricbeat-7.14.2-amd64.deb
sudo dpkg -i metricbeat-7.14.2-amd64.deb
rpm:
curl -L -O https://artifacts.elastic.co/downloads/beats/metricbeat/metricbeat-7.14.2-x86_64.rpm
sudo rpm -vi metricbeat-7.14.2-x86_64.rpm
mac:
curl -L -O https://artifacts.elastic.co/downloads/beats/metricbeat/metricbeat-7.14.2-darwin-x86_64.tar.gz
tar xzvf metricbeat-7.14.2-darwin-x86_64.tar.gz
brew:
brew tap elastic/tap
brew install elastic/tap/metricbeat-full
linux:
curl -L -O https://artifacts.elastic.co/downloads/beats/metricbeat/metricbeat-7.14.2-linux-x86_64.tar.gz
tar xzvf metricbeat-7.14.2-linux-x86_64.tar.gz
win:
- Download the Metricbeat Windows zip file from the Metricbeat download page.
-
Extract the contents of the zip file into
C:\Program Files. -
Rename the
metricbeat-7.14.2-windowsdirectory toMetricbeat. - Open a PowerShell prompt as an Administrator (right-click the PowerShell icon and select Run As Administrator).
-
From the PowerShell prompt, run the following commands to install Metricbeat as a Windows service:
PS > cd 'C:\Program Files\Metricbeat'
PS C:\Program Files\Metricbeat> .\install-service-metricbeat.ps1
If script execution is disabled on your system, set the execution policy for the current session to allow the script to run. For example:
PowerShell.exe
-ExecutionPolicy UnRestricted -File .\install-service-metricbeat.ps1
.
For other operating systems, go to the Beats download page.
Ship system metrics to Elasticsearch
editMetricbeat provides pre-built modules that you can use to rapidly implement and deploy a system monitoring solution, complete with sample dashboards and data visualizations, in about 5 minutes.
In this section, you learn how to run the system module to collect metrics
from the operating system and services running on your server. The system module
collects system-level metrics, such as CPU usage, memory, file system, disk IO,
and network IO statistics, as well as top-like statistics for every process
running on your system.
Before you begin: Verify that Elasticsearch and Kibana are running and that Elasticsearch is ready to receive data from Metricbeat.
To set up the system module and start collecting system metrics:
-
From the Metricbeat install directory, enable the
systemmodule:deb and rpm:
sudo metricbeat modules enable system
mac and linux:
./metricbeat modules enable system
brew:
metricbeat modules enable system
win:
PS C:\Program Files\Metricbeat> .\metricbeat.exe modules enable system
-
Set up the initial environment:
deb and rpm:
sudo metricbeat setup -e
mac and linux:
./metricbeat setup -e
brew:
metricbeat setup -e
win:
PS C:\Program Files\Metricbeat> metricbeat.exe setup -e
The
setupcommand loads the Kibana dashboards. If the dashboards are already set up, omit this command. The-eflag is optional and sends output to standard error instead of syslog. -
deb and rpm:
sudo service metricbeat start
mac and linux:
./metricbeat -e
brew:
metricbeat -e
win:
PS C:\Program Files\Metricbeat> Start-Service metricbeat
Metricbeat runs and starts sending system metrics to Elasticsearch.
Visualize system metrics in Kibana
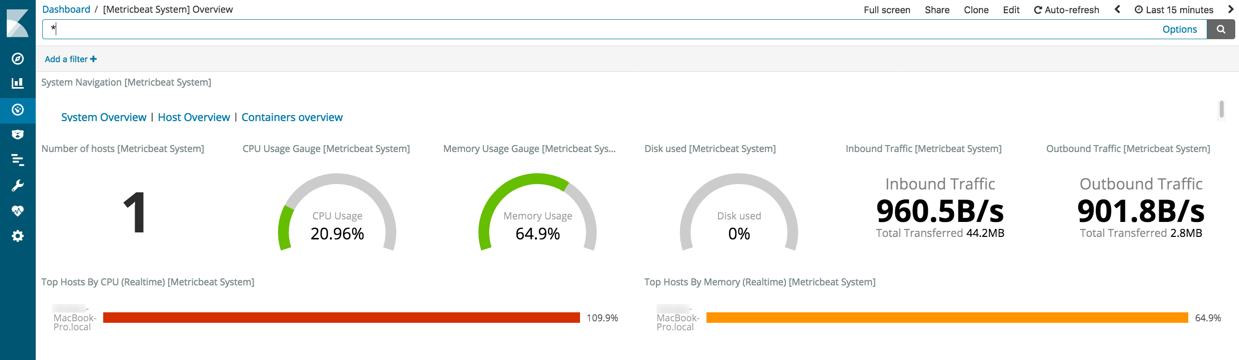
editTo visualize system metrics, open your browser and navigate to the Metricbeat system overview dashboard: http://localhost:5601/app/kibana#/dashboard/Metricbeat-system-overview-ecs
If you don’t see data in Kibana, try changing the date range to a larger range. By default, Kibana shows the last 15 minutes. If you see errors, make sure Metricbeat is running, then refresh the page.
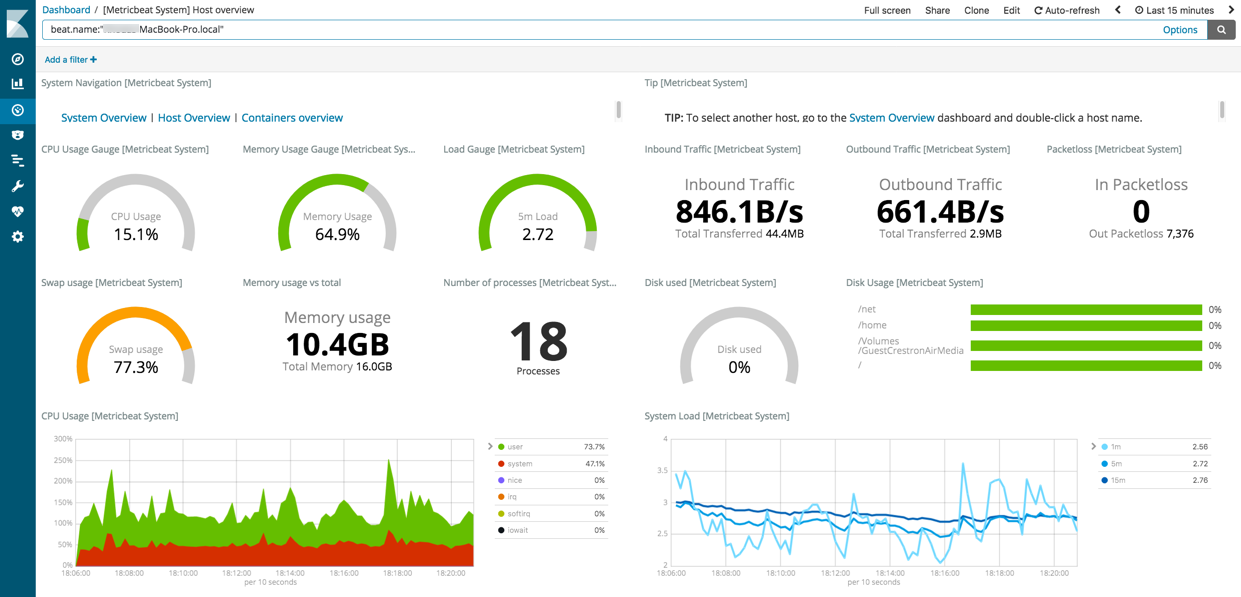
Click Host Overview to see detailed metrics about the selected host.
What’s next?
editCongratulations! You’ve successfully set up the Elastic Stack. You learned how to stream system metrics to Elasticsearch and visualize the data in Kibana.
Next, you’ll want to set up the Elastic Stack security features and activate your trial license so you can unlock the full capabilities of the Elastic Stack. To learn how, read:
Want to get up and running quickly with metrics monitoring and centralized log analytics? Try out the Metrics app and the Logs app in Kibana. For more details, see Analyze metrics and Monitor logs.
Later, when you’re ready to set up a production environment, also see the Elastic Stack Installation and Upgrade Guide.