Log monitoring
editLog monitoring
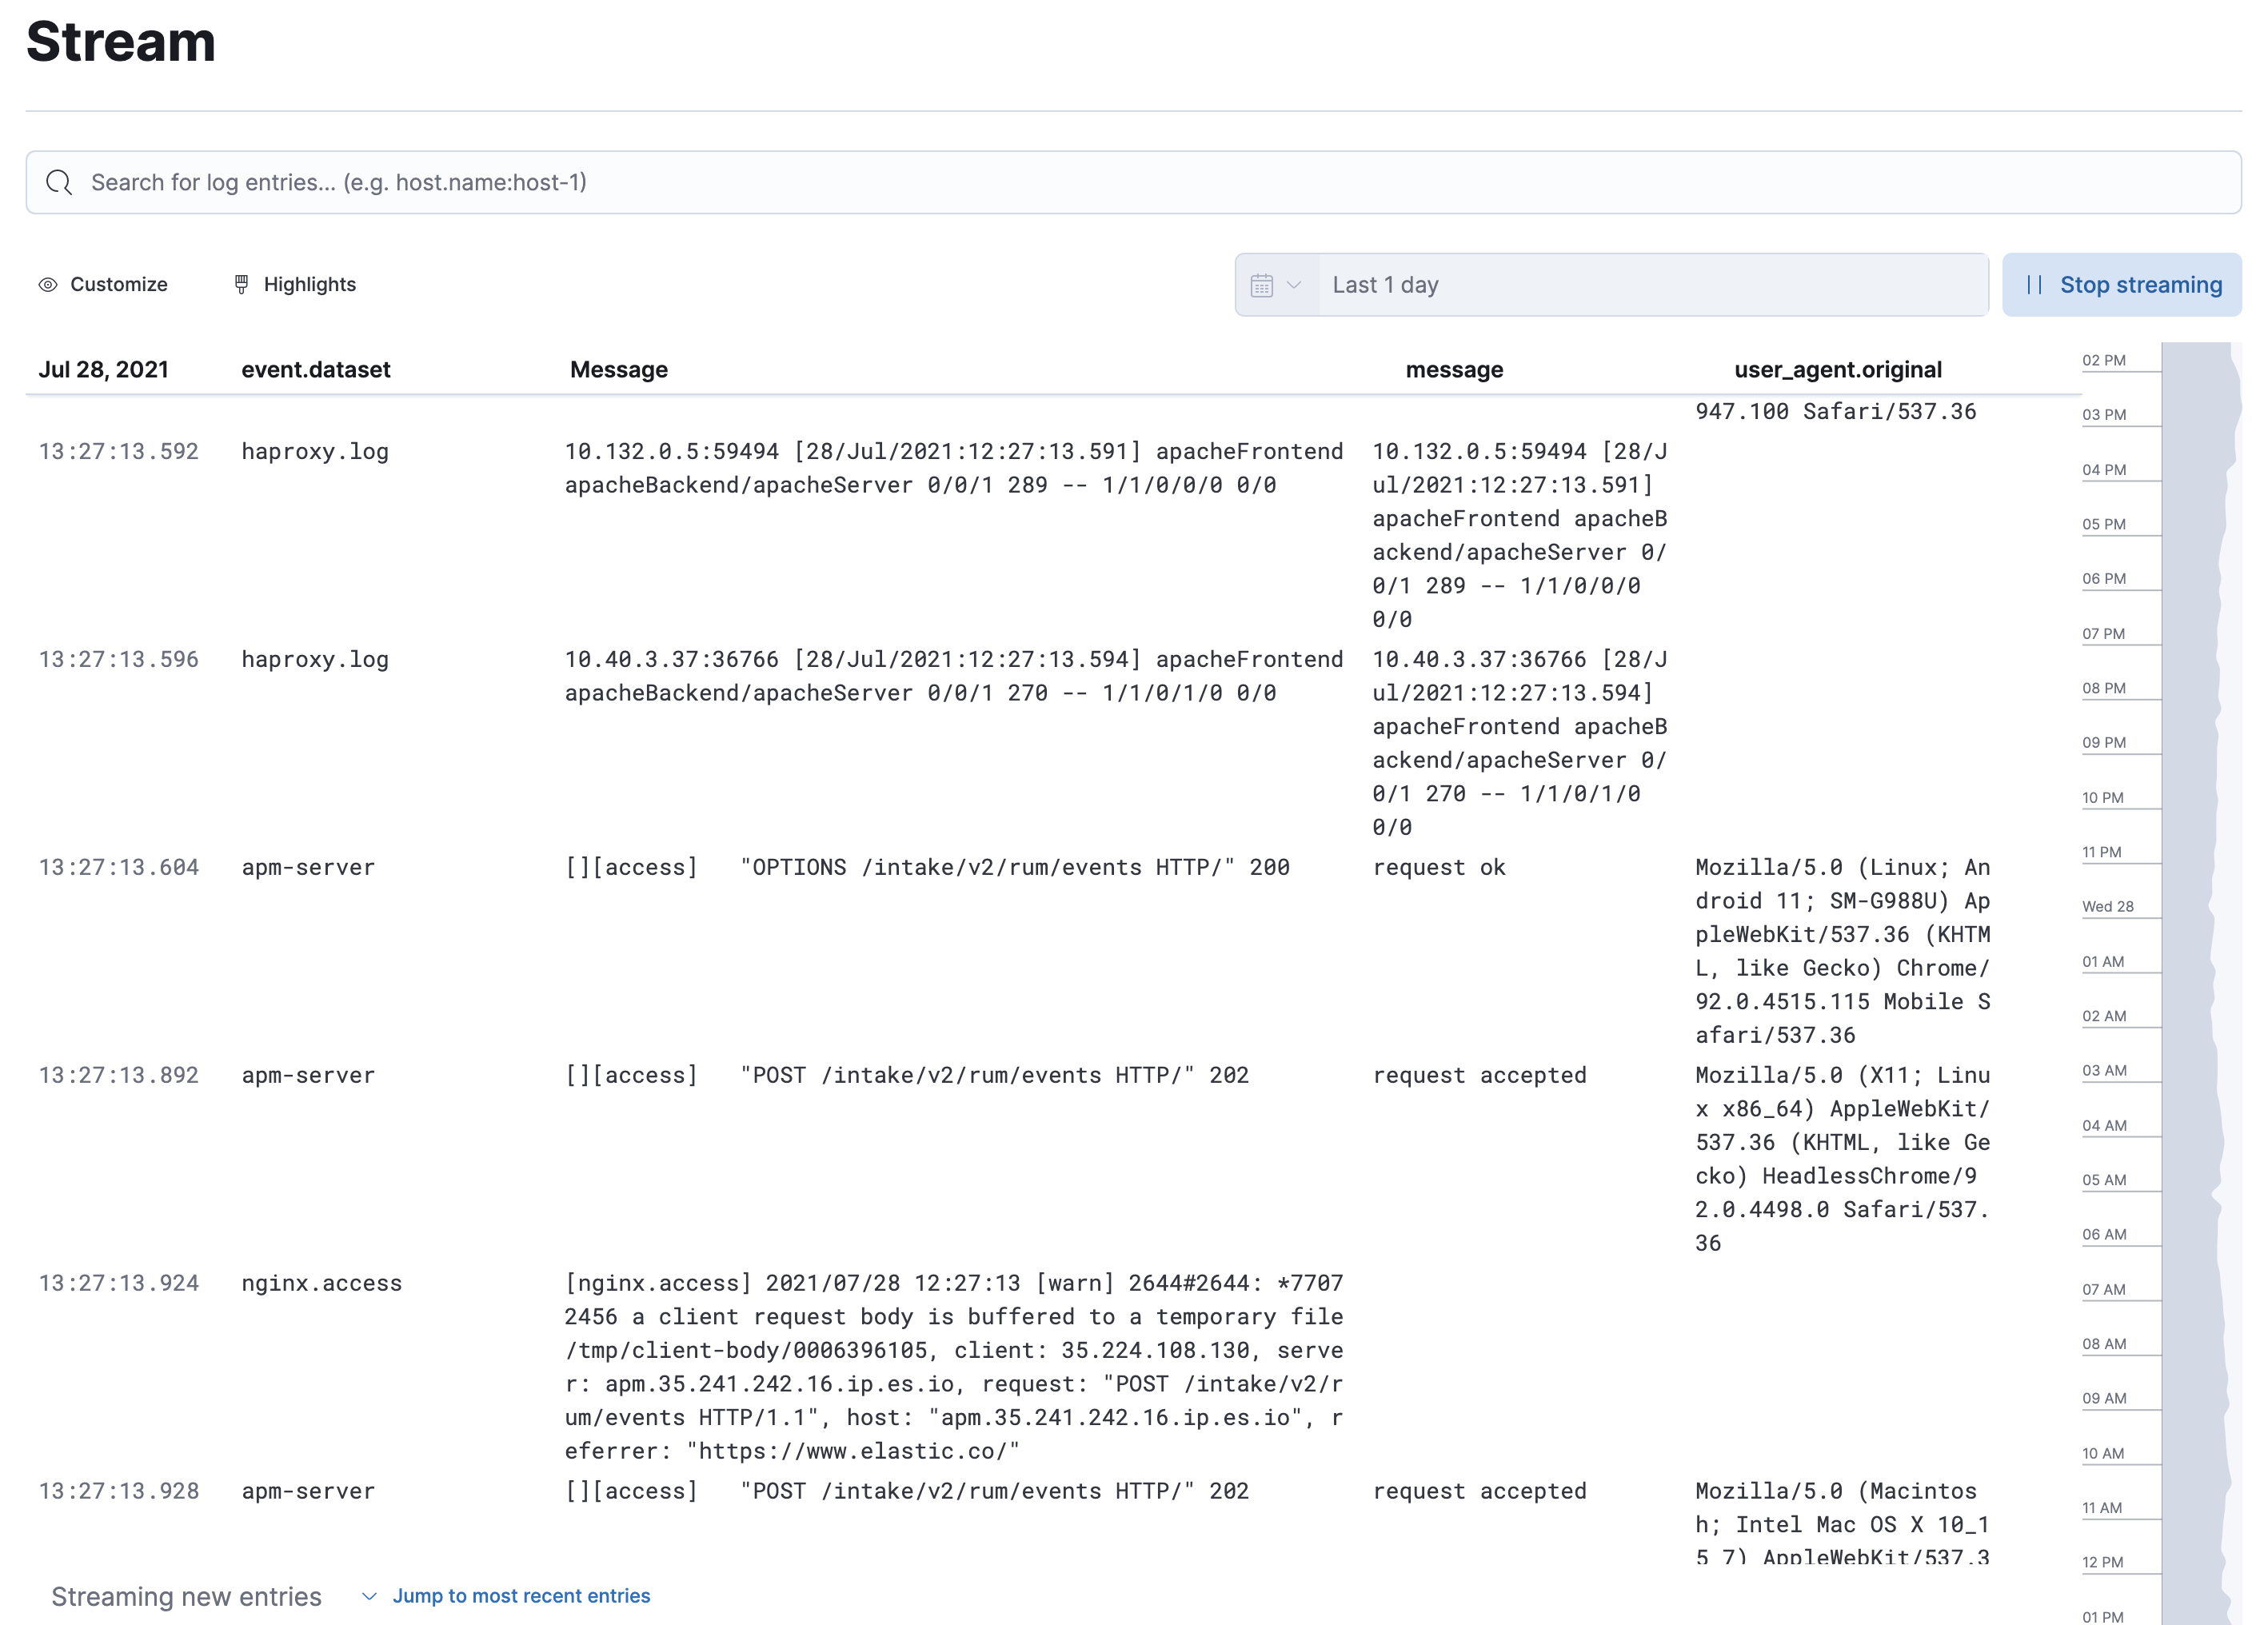
editThe Logs app in Kibana enables you to search, filter, and tail all your logs ingested into Elasticsearch. Instead of having to log into different servers, change directories, and tail individual files, all your logs are available in the Logs app.
Using Filebeat modules, you can ingest logs from Kubernetes, MySQL, and many more data sources. Log events are indexed into Elasticsearch and are sorted from older to newer, with infinite scrolling in both directions.
There is live streaming of logs, filtering using auto-complete, and a logs histogram for quick navigation. You can also use machine learning to detect specific log anomalies automatically and categorize log messages to quickly identify patterns in your log events.
To view the Logs app, go to Observability > Logs.