Winlogbeat quick start: installation and configuration
editWinlogbeat quick start: installation and configuration
editThis guide describes how to get started quickly with Windows log monitoring. You’ll learn how to:
- install Winlogbeat on each system you want to monitor
- specify the location of your log files
- parse log data into fields and send it to Elasticsearch
- visualize the log data in Kibana
Before you begin
editYou need Elasticsearch for storing and searching your data, and Kibana for visualizing and managing it.
To get started quickly, spin up a deployment of our hosted Elasticsearch Service. The Elasticsearch Service is available on AWS, GCP, and Azure. Try it out for free.
Step 1: Install Winlogbeat
edit- Download the Winlogbeat zip file from the downloads page.
-
Extract the contents into
C:\Program Files. -
Rename the
winlogbeat-<version>directory toWinlogbeat. - Open a PowerShell prompt as an Administrator (right-click on the PowerShell icon and select Run As Administrator).
- From the PowerShell prompt, run the following commands to install the service.
PS C:\Users\Administrator> cd 'C:\Program Files\Winlogbeat'
PS C:\Program Files\Winlogbeat> .\install-service-winlogbeat.ps1

Security warning
Run only scripts that you trust. While scripts from the internet can be useful,
this script can potentially harm your computer. If you trust this script, use
the Unblock-File cmdlet to allow the script to run without this warning message.
Do you want to run C:\Program Files\Winlogbeat\install-service-winlogbeat.ps1?
[D] Do not run  [R] Run once  [S] Suspend  [?] Help (default is "D"): R

Status   Name               DisplayName
------   ----               -----------
Stopped  winlogbeat         winlogbeat
If script execution is disabled on your system, you need to set the
execution policy for the current session to allow the script to run. For example:
PowerShell.exe -ExecutionPolicy UnRestricted -File .\install-service-winlogbeat.ps1.
Step 2: Connect to the Elastic Stack
editConnections to Elasticsearch and Kibana are required to set up Winlogbeat.
Set the connection information in winlogbeat.yml. To locate this
configuration file, see Directory layout.
Specify the cloud.id of your Elasticsearch Service, and set cloud.auth to a user who is authorized to set up Winlogbeat. For example:
cloud.id: "staging:dXMtZWFzdC0xLmF3cy5mb3VuZC5pbyRjZWM2ZjI2MWE3NGJmMjRjZTMzYmI4ODExYjg0Mjk0ZiRjNmMyY2E2ZDA0MjI0OWFmMGNjN2Q3YTllOTYyNTc0Mw=="
cloud.auth: "winlogbeat_setup:YOUR_PASSWORD"
|
This examples shows a hard-coded password, but you should store sensitive values in the secrets keystore. |
-
Set the host and port where Winlogbeat can find the Elasticsearch installation, and set the username and password of a user who is authorized to set up Winlogbeat. For example:
output.elasticsearch:
  hosts: ["myEShost:9200"]
  username: "winlogbeat_internal"
  password: "YOUR_PASSWORD"
This examples shows a hard-coded password, but you should store sensitive values in the secrets keystore.
-
If you plan to use our pre-built Kibana dashboards, configure the Kibana endpoint. Skip this step if Kibana is running on the same host as Elasticsearch.
The hostname and port of the machine where Kibana is running, for example,
mykibanahost:5601. If you specify a path after the port number, include the scheme and port:http://mykibanahost:5601/path.The
usernameandpasswordsettings for Kibana are optional. If you don’t specify credentials for Kibana, Winlogbeat uses theusernameandpasswordspecified for the Elasticsearch output.To use the pre-built Kibana dashboards, this user must be authorized to view dashboards or have the
kibana_adminbuilt-in role.
To learn more about required roles and privileges, see Grant users access to secured resources.
Step 3: Configure Winlogbeat
editIn winlogbeat.yml, configure the event logs that you want to monitor.
-
Under
winlogbeat.event_log, specify a list of event logs to monitor. By default, Winlogbeat monitors application, security, and system logs.winlogbeat.event_logs: - name: Application - name: Security - name: System
To obtain a list of available event logs, run
Get-EventLog *in PowerShell. For more information about this command, see the configuration details for event_logs.name. -
(Optional) Set logging options to write Winlogbeat logs to a file:
logging.to_files: true
logging.files:
  path: C:\ProgramData\winlogbeat\Logs
logging.level: info
-
After you save your configuration file, test it with the following command.
PS C:\Program Files\Winlogbeat> .\winlogbeat.exe test config -c .\winlogbeat.yml -e
For more information about configuring Winlogbeat, also see:
- Configure Winlogbeat
- Config file format
-
winlogbeat.reference.yml: This reference configuration file shows all non-deprecated options. You’ll find it in the same location aswinlogbeat.yml.
Step 4: Set up assets
editWinlogbeat comes with predefined assets for parsing, indexing, and visualizing your data. To load these assets:
-
Make sure the user specified in
winlogbeat.ymlis authorized to set up Winlogbeat. -
From the installation directory, run:
PS > .\winlogbeat.exe setup -e
This step loads the recommended index template for writing to Elasticsearch and deploys the sample dashboards for visualizing the data in Kibana.
A connection to Elasticsearch (or Elasticsearch Service) is required to set up the initial environment. If you’re using a different output, such as Logstash, see Load the index template manually and Load Kibana dashboards.
Step 5: Start Winlogbeat
editBefore starting Winlogbeat, modify the user credentials in
winlogbeat.yml and specify a user who is
authorized to publish events.
To start the Winlogbeat service, run:
PS C:\Program Files\Winlogbeat> Start-Service winlogbeat
Winlogbeat should now be running. If you used the logging configuration
described here, you can view the log file at
C:\ProgramData\winlogbeat\Logs\winlogbeat.
You can view the status of the service and control it from the Services management console in Windows. To launch the management console, run this command:
PS C:\Program Files\Winlogbeat> services.msc
Stop Winlogbeat
editStop the Winlogbeat service with the following command:
PS C:\Program Files\Winlogbeat> Stop-Service winlogbeat
Step 6: View your data in Kibana
editWinlogbeat comes with pre-built Kibana dashboards and UIs for visualizing log
data. You loaded the dashboards earlier when you ran the setup command.
To open the dashboards:
-
Launch Kibana:
- Log in to your Elastic Cloud account.
- Navigate to the Kibana endpoint in your deployment.
Point your browser to http://localhost:5601, replacing
localhostwith the name of the Kibana host. -
In the side navigation, click Discover. To see Winlogbeat data, make sure the predefined
winlogbeat-*index pattern is selected.If you don’t see data in Kibana, try changing the time filter to a larger range. By default, Kibana shows the last 15 minutes.
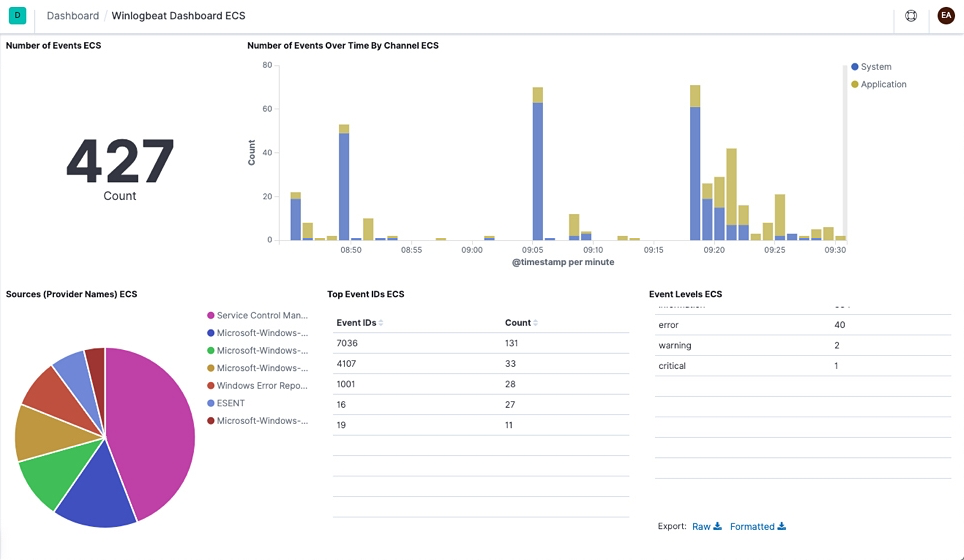
- In the side navigation, click Dashboard, then select the dashboard that you want to open.
The dashboards are provided as examples. We recommend that you customize them to meet your needs.
What’s next?
editNow that you have your logs streaming into Elasticsearch, learn how to unify your logs, metrics, uptime, and application performance data.
-
Ingest data from other sources by installing and configuring other Elastic Beats:
Elastic Beats To capture Infrastructure metrics
Logs
Uptime information
Application performance metrics
Audit events
-
Use the Observability apps in Kibana to search across all your data:
Elastic apps Use to Explore metrics about systems and services across your ecosystem
Tail related log data in real time
Monitor availability issues across your apps and services
Monitor application performance
Analyze security events