Uptime monitoring
editUptime monitoring
editIf you haven’t already, you need to install and configure Heartbeat to populate the Uptime app with data. For more information, see Ingest uptime data.
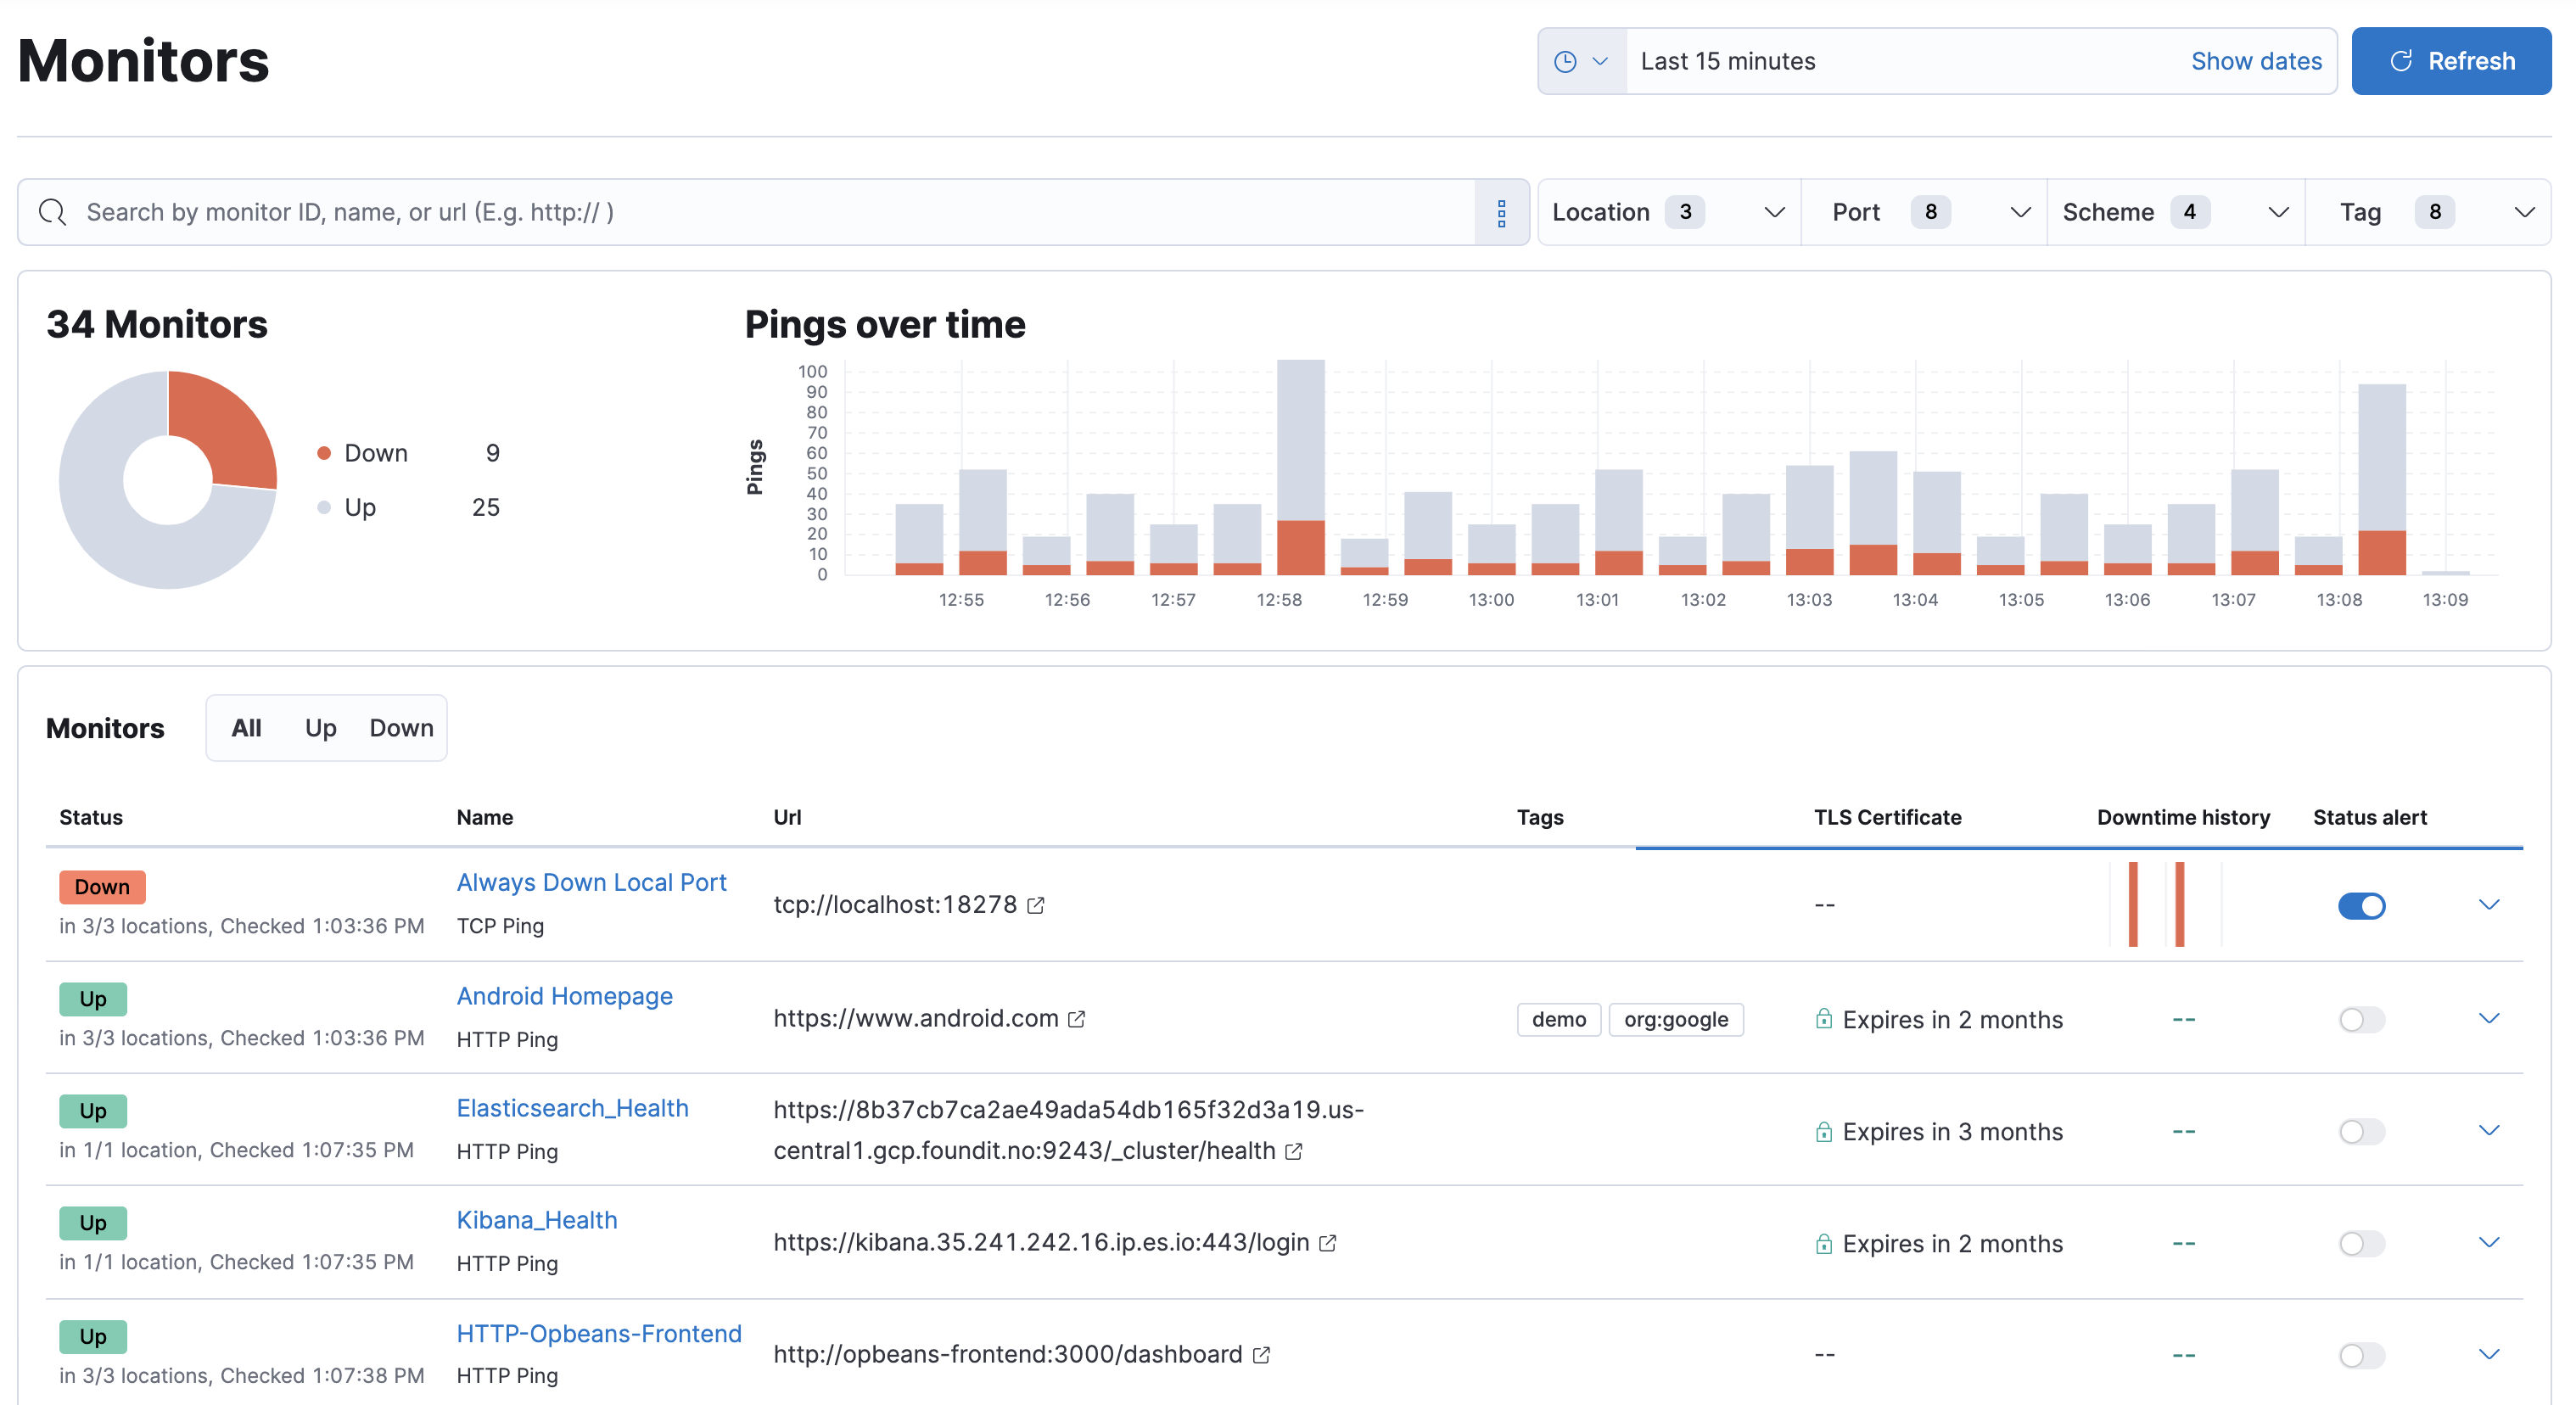
The Uptime app in Kibana enables you to monitor the availability and response times of applications and services in real time, and detect problems before they affect users. You can monitor the status of network endpoints via HTTP/S, TCP, and ICMP, explore endpoint status over time, drill down into specific monitors, and view a high-level snapshot of your environment at any point in time.
The Uptime app uses Heartbeat to check the status of your services and applications periodically. So that you can monitor services for their availability with active probing, you can deploy Heartbeat as part of a monitoring service that runs on a separate machine, and outside of the network where the services that you want to monitor are running.
To view the Uptime app, go to Observability > Uptime.