Dashboard
editDashboard
editVisualize your data with dashboards.
The best way to understand your data is to visualize it. With dashboards, you can turn your data from one or more index patterns into a collection of panels that bring clarity to your data, tell a story about your data, and allow you to focus on only the data that’s important to you.
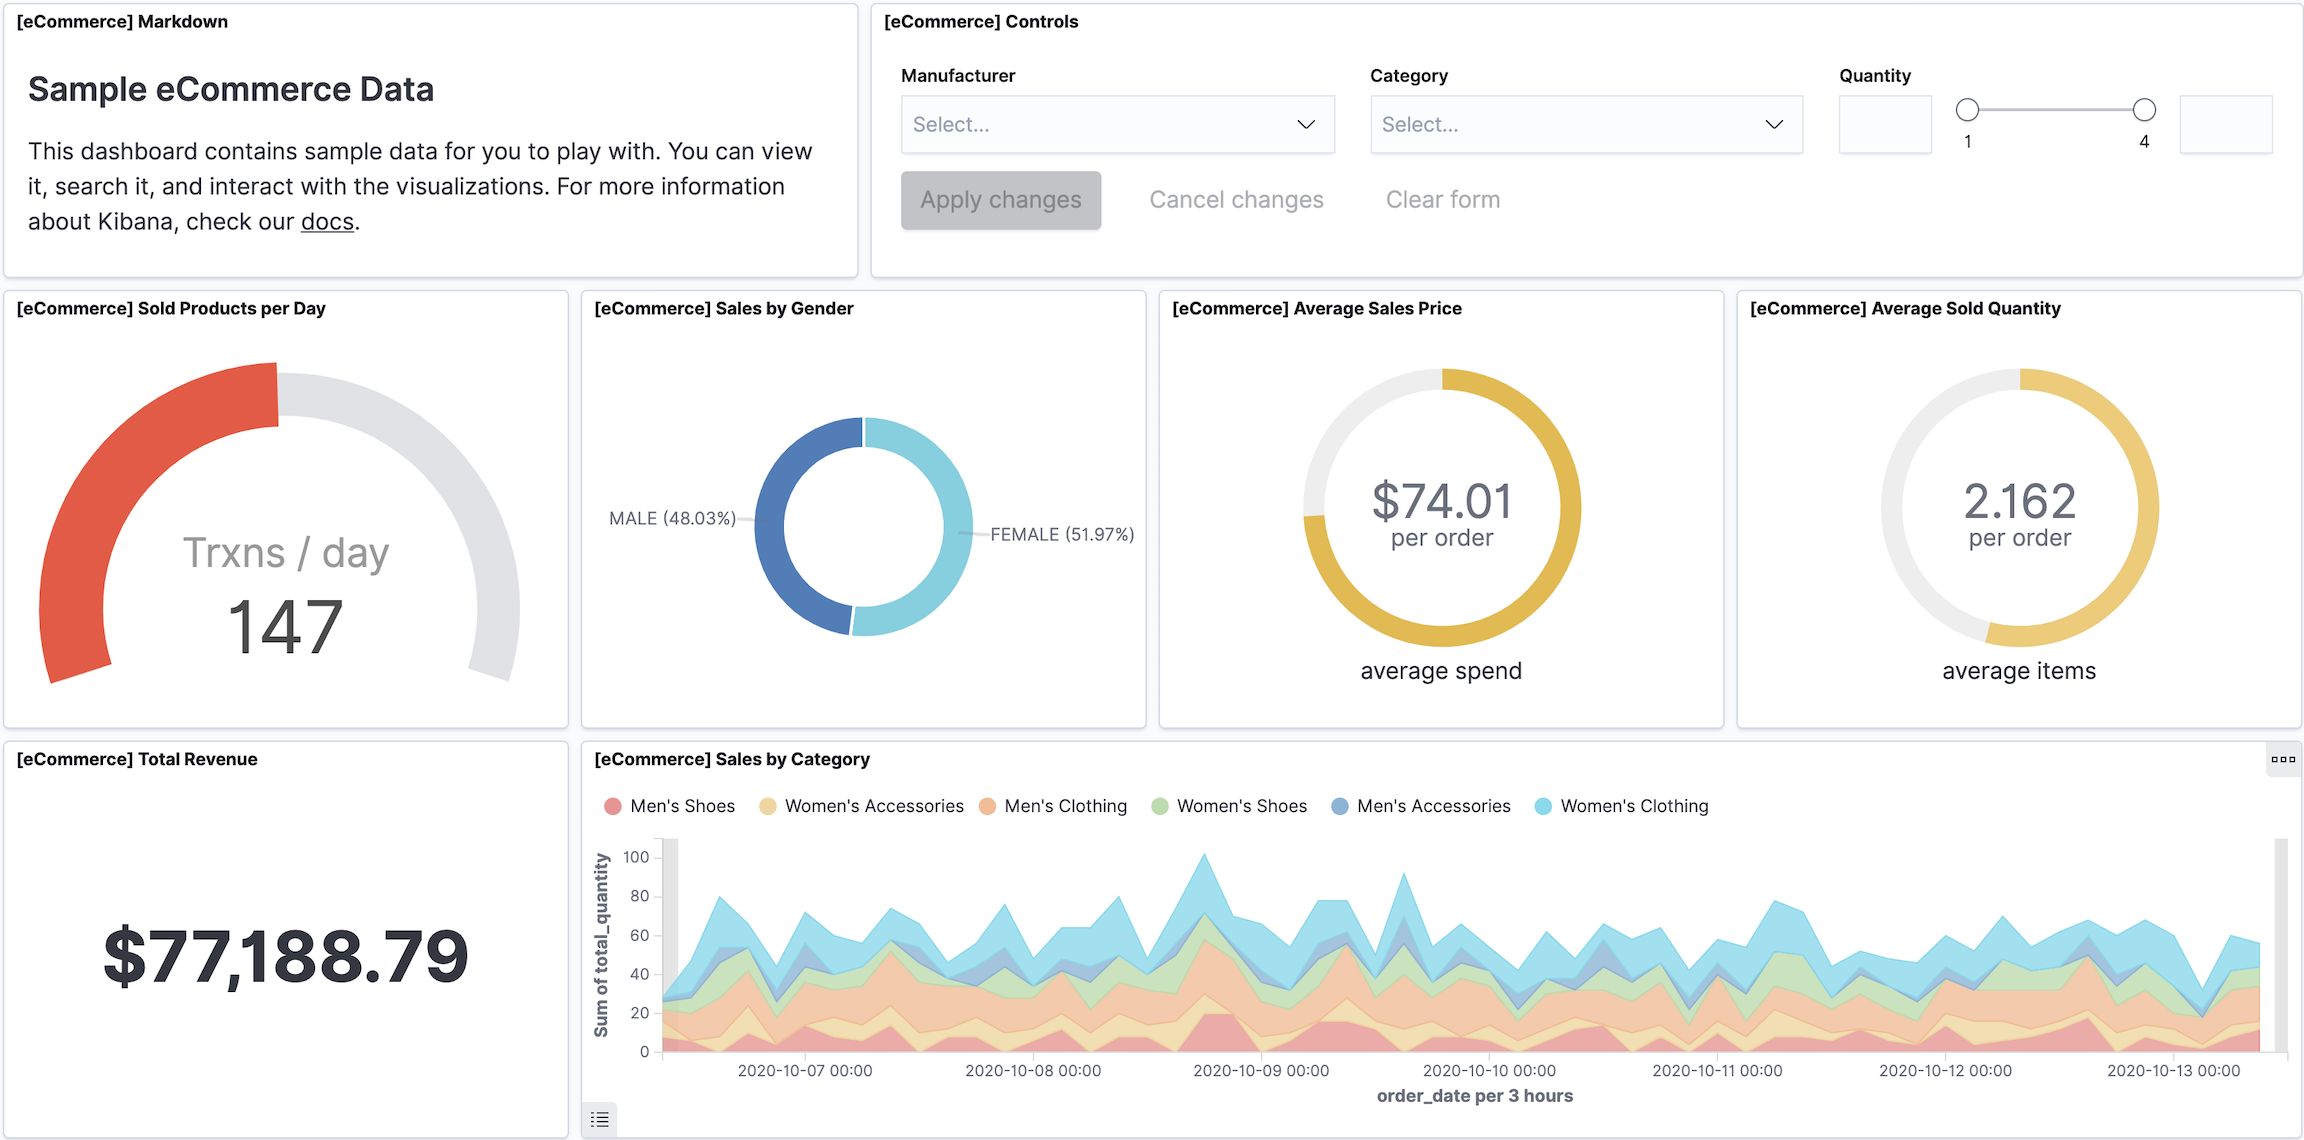
Panels display your data in charts, tables, maps, and more, which allow you to compare your data side-by-side to identify patterns and connections. Dashboards support several editors you can use to create panels, and support many types of panels to display your data.
Use the Lens, TSVB, Vega, and Timelion editors to create visualizations of your data, or create Aggregation based visualizations using Elasticsearch aggregations. Lens is the recommended editor. |
|
Create beautiful displays of your geographical data. |
|
Display the results from machine learning anomaly detection jobs. |
|
Display an anomaly chart from the Anomaly Explorer. |
|
Display a table of live streaming logs. |
|
Add context to your panels with text, or add dynamic filters with Controls. |
Create dashboards
editDashboards provide you with the space where you add panels of your data.
Minimum requirements
editTo create dashboards, you must meet the minimum requirements.
- If you need to set up Kibana, use our free trial.
- Make sure you have data indexed into Elasticsearch and an index pattern.
- When the read-only indicator appears, you have insufficient privileges to create or save dashboards, and the options to create and save dashboards are not visible. For more information, refer to Granting access to Kibana.
Open the dashboard
editBegin with an empty dashboard, or open an existing dashboard.
- Open the main menu, then click Dashboard.
-
On the Dashboards page, choose one of the following options:
- To start with an empty dashboard, click Create dashboard.
- To open an existing dashboard, click the dashboard Title you want to open.
Add panels
editCreate and add panels of your data to the dashboard, or add existing panels from the library.
- Create visualization — Opens Lens, the recommended editor to create visualizations of your data.
- All types — Select the editor to create the panel, or select the panel type you want to add to the dashboard.
-
Add from library — Add panels from the Visualize Library, including search results from Discover. The search results from Discover are not aggregated.
When a panel contains a saved query, both queries are applied.
Save panels
editConsider where you want to save the panel in Kibana. You can save the panel just on the dashboard you are working on, or save the panel in the Visualize Library.
Save to the Visualize Library
editTo use the panel on Canvas workpads and other dashboards, save the panel to the Visualize Library.
- Click Save to library.
- Enter the Title and add any applicable Tags.
- Make sure that Add to Dashboard after saving is selected.
-
Click Save and return.
When panels are saved in the Visualize Library,
 appears in the panel header.
Save to the dashboard
editQuickly add the panel and return to the dashboard without specifying the save options or adding the panel to the Visualize Library.
- Click Save and return.
-
Add more panels to the dashboard, or specify the panel title.
- In the panel header, click No Title.
- Select Show panel title.
- Enter the Panel title.
If you change your mind and want to add the panel to the Visualize Library:
- Open the panel menu, then select More > Save to library.
- Enter the panel title, then click Save.
Add context to panels
editTo provide context to your dashboard panels, add Text panels that display important information, instructions, images, and more.
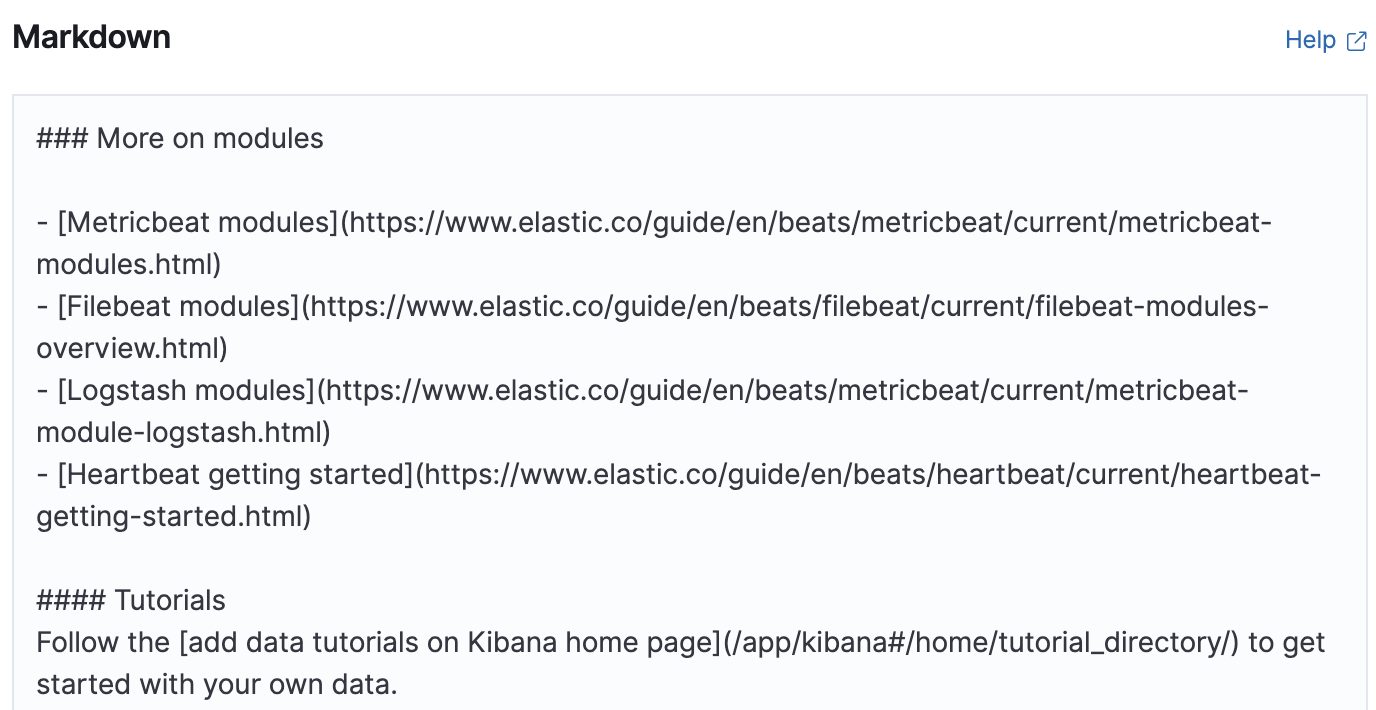
You create Text panels using GitHub-flavored Markdown text. For information about GitHub-flavored Markdown text, click Help.
- From the dashboard, click All types, then select Text.
- In the Markdown field, enter the text, then click Update.
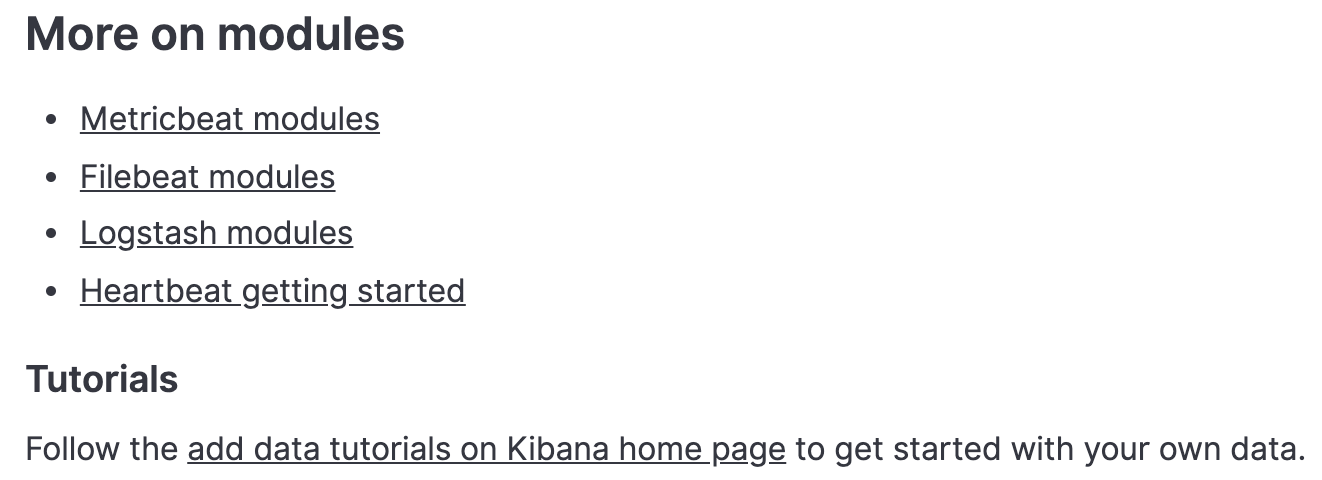
For example, when you enter:
The following instructions are displayed:
Or when you enter:
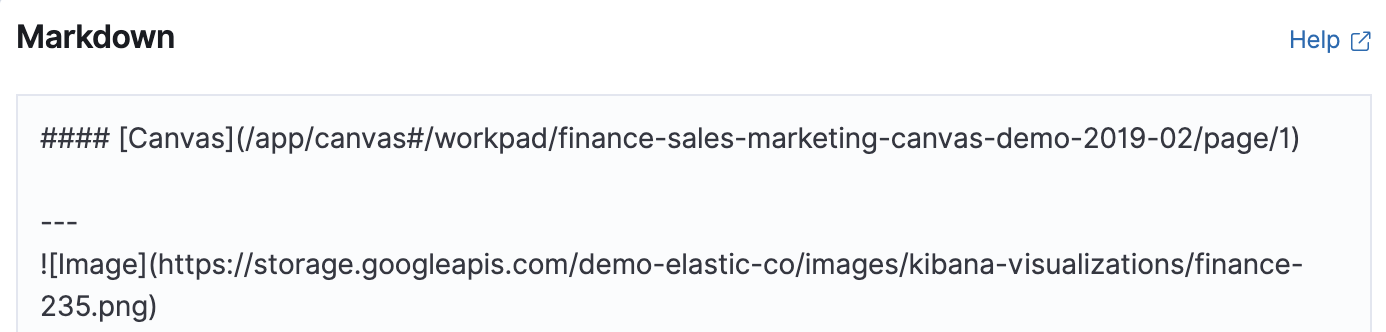
The following image is displayed:
Edit panels
editTo make changes to the panel, use the panel menu options.
- In the toolbar, click Edit.
-
Open the panel menu, then use the following options:
- Edit lens — Opens Lens so you can make changes to the visualization.
-
Edit visualization — Opens the editor so you can make changes to the panel.
To make changes without changing the original version, open the panel menu, then click More > Unlink from library.
- Edit panel title — Opens the Customize panel window to change the Panel title.
- More > Replace panel — Opens the Visualize Library so you can select a new panel to replace the existing panel.
-
More > Delete from dashboard — Removes the panel from the dashboard.
If you want to use the panel later, make sure that you save the panel to the Visualize Library.
Search and filter your data
editKibana supports several ways to search your data and apply Elasticsearch filters. You can combine the filters with any panel filter to display the data want to you see.
For more information about Kibana and Elasticsearch filters, refer to Kibana concepts.
To apply a panel-level time filter:
- Open the panel menu, then select More > Customize time range.
- Enter the time range you want to view, then click Add to panel.
Arrange panels
editTo compare the data side-by-side, move and arrange the panels.
In the toolbar, click Edit, then use the following options:
- To move, click and hold the panel header, then drag to the new location.
- To resize, click the resize control, then drag to the new dimensions.
- To maximize to fullscreen, open the panel menu, then click More > Maximize panel.
Apply design options
editApply a set of design options to the entire dashboard.
In the toolbar, click Edit > Options, then use the following options:
- Use margins between panels — Specifies a margin of space between each panel.
- Show panel titles — Specifies the appearance of titles in the header of each panel.
- Sync color pallettes across panels — Specifies whether the color pallette is applied to all panels.
Duplicate panels
editTo duplicate a panel and the configured functionality, use the clone and copy panel options. Cloned and copied panels replicate all of the functionality from the original panel, including renaming, editing, and cloning.
Clone panels
editCloned panels appear next to the original panel, and move the other panels to provide a space on the dashboard.
- In the toolbar, click Edit.
-
Open the panel menu, then select Clone panel.
When cloned panels are saved in the Visualize Library,
appears in the header.
Copy panels
editCopy panels from one dashboard to another dashboard.
- Open the panel menu, then select More > Copy to dashboard.
- On the Copy to dashboard window, select the dashboard, then click Copy and go to dashboard.
Explore the underlying documents
editYou can add additional interactions that allow you to open Discover from dashboard panels. To use the interactions, the panel must use only one index pattern.
- Panel interaction
-
Opens the data in Discover with the current dashboard filters, but does not take the filters saved with the panel.
To enable panel interactions, refer to
xpack.discoverEnhanced.actions.exploreDataInContextMenu.enabled.In Kibana 7.13 and earlier, the panel interaction is enabled by default.
- Series interaction
-
Opens the series data in Discover from inside the panel.
To enable series interactions, refer to
xpack.discoverEnhanced.actions.exploreDataInChart.enabled.
Download panel data
editDownload panel data in a CSV file. You can download most panels in a CSV file, but there is a shortcut available for Lens panels.
Download Lens data
editWhen you download Lens panel data, each layer produces a single CSV file with columns. When you download multiple layers, the file names combine the visualization and layer index names.
- Open the Lens panel menu
- Select More > Download as CSV.
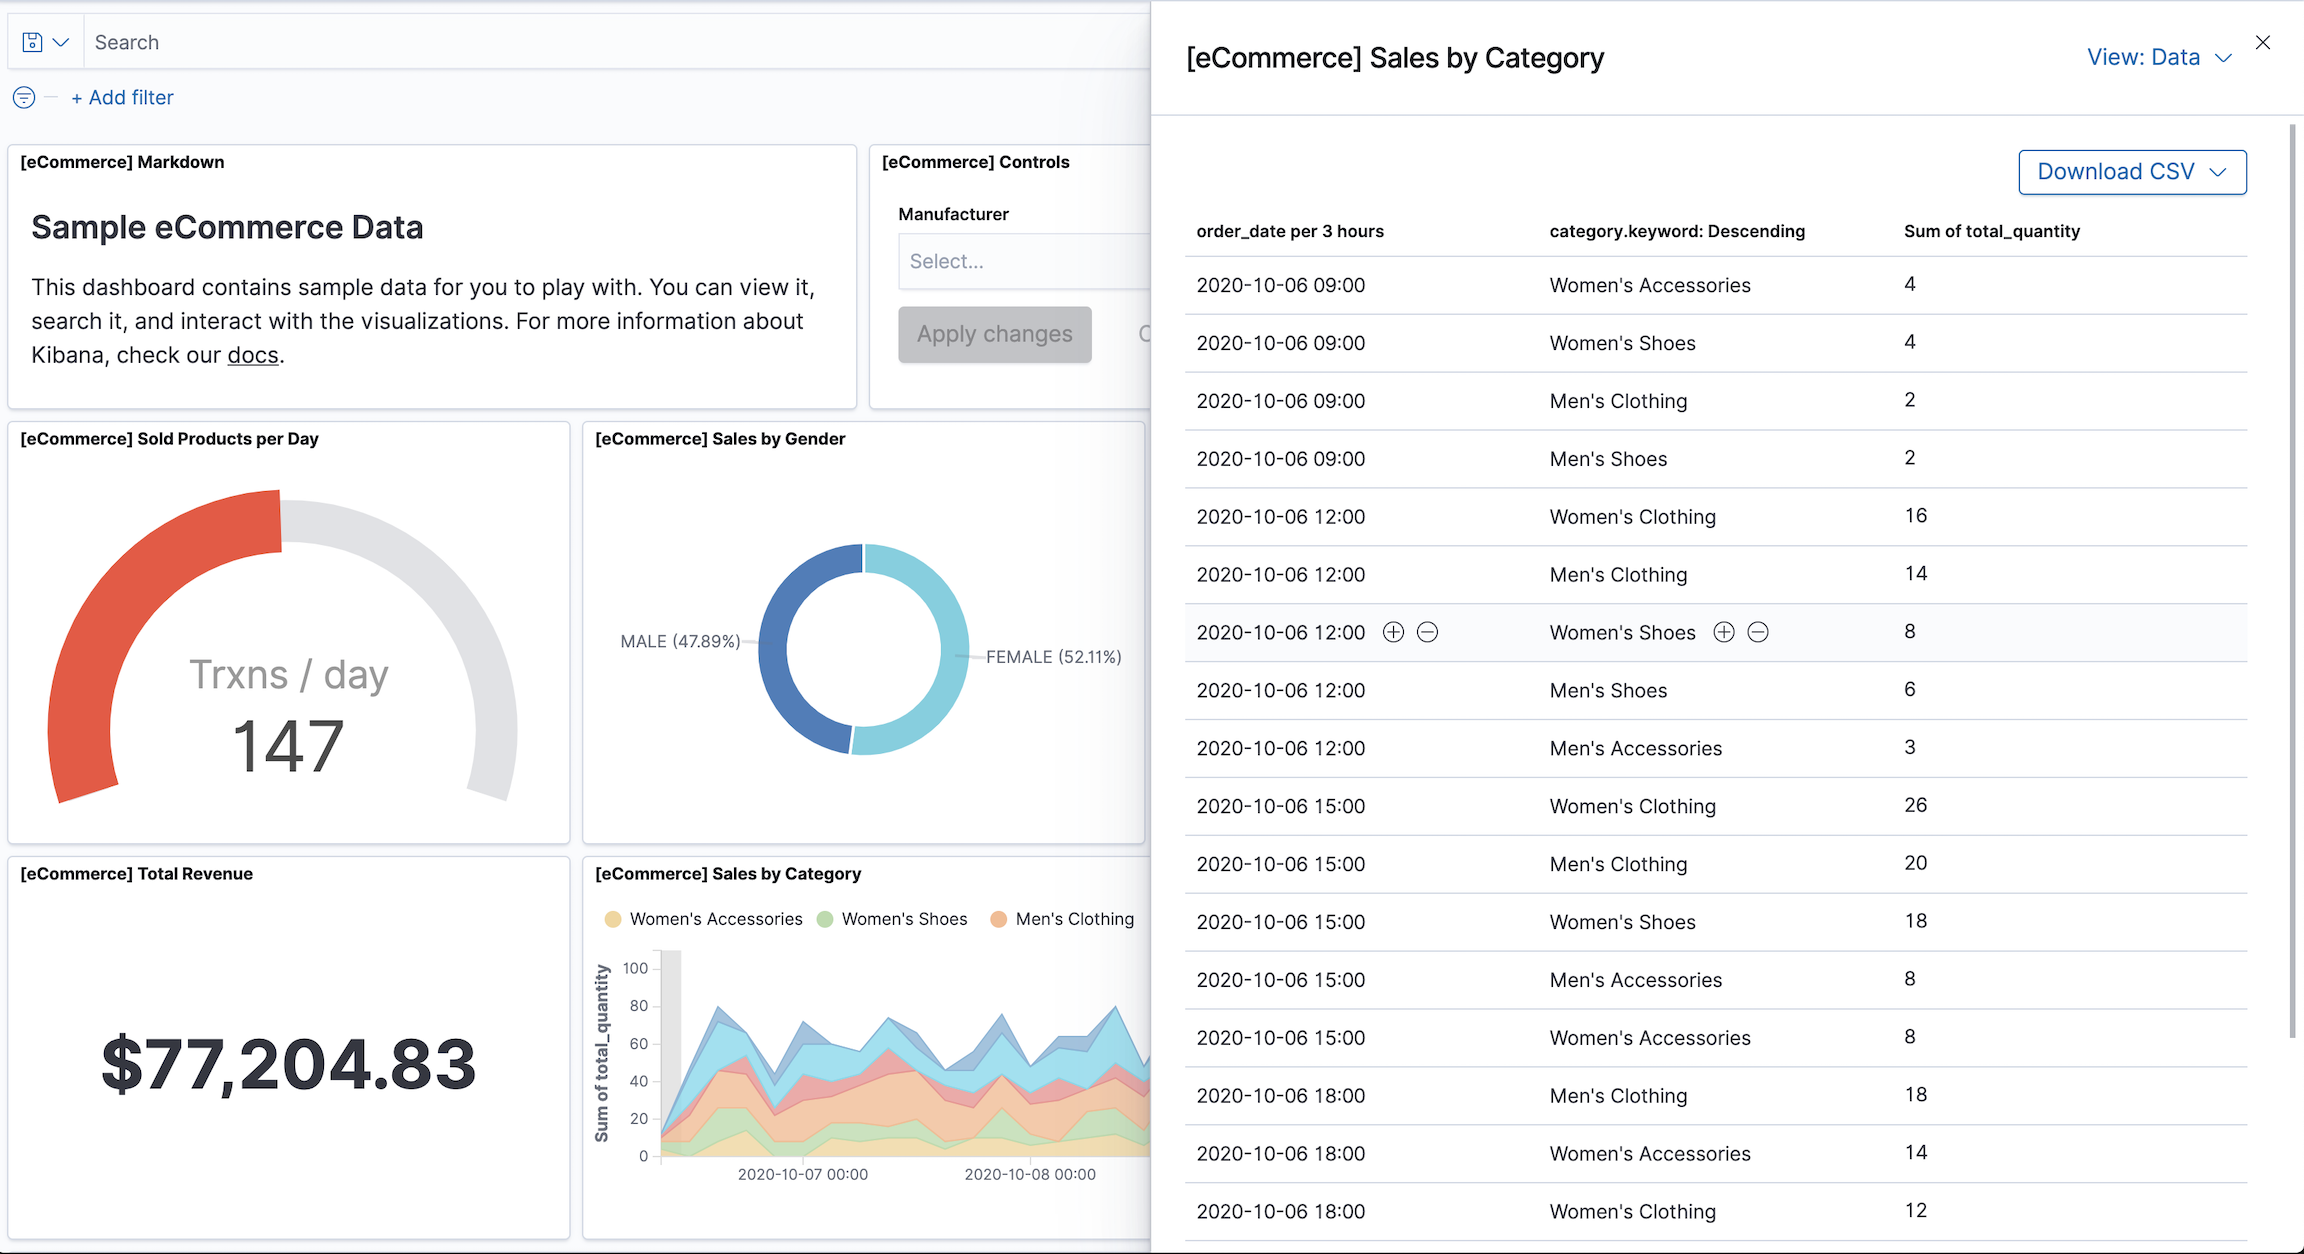
Download all other panel data
editDownload the data for non-Lens panels.
- Open the panel menu, then select Inspect.
-
Click Download CSV, then select the CSV type from the dropdown:
- Formatted CSV — Contains human-readable dates and numbers.
-
Unformatted — Best used for computer use.
Improve dashboard loading time
editTo improve the dashboard loading time, enable the Defer loading panels below the fold Lab, which loads the dashboard panels as they become visible on the dashboard.
-
In the toolbar, click Labs.
To enable Labs, contact your administrator, or configure the Advanced Settings.
-
To specify how you want to enable the lab, use the following actions:
- Kibana — Enables the lab in Kibana.
- Browser — Enables the lab for your browser, and persists after you close the browser.
- Session — Enables the lab for this browser session, then resets after you close the browser.
- Click Close.
Share dashboards
editTo share the dashboard with a larger audience, click Share in the toolbar. For detailed information about the sharing options, refer to Reporting.
Export dashboards
editTo automate Kibana, you can export dashboards as JSON using the import and export dashboard APIs. It is important to export dashboards with all necessary references.