Discover
editDiscover
editGain insight to your data.
Discover enables you to quickly search and filter your data, get information about the structure of the fields, and visualize your data with Lens and Maps. You can customize and save your searches and place them on a dashboard.
Explore and query your data
editYou have questions about your data. What pages on your website contain a specific word or phrase? What events were logged most recently? What processes take longer than 500 milliseconds to respond? This tutorial shows you how to use Discover to quickly search large amounts of data and understand what’s going on at any given time.
You’ll learn to:
- Select data for your exploration, set a time range for that data, search it with the Kibana Query Language, and filter the results.
- Explore the details of your data, view individual documents, and create tables that summarize the contents of the data.
- Present your findings in a visualization.
At the end of this tutorial, you’ll be ready to start exploring with your own data in Discover.
Prerequisites
edit- If you don’t already have Kibana, set it up with our free trial.
- You must have data in Elasticsearch. This tutorial uses the ecommerce sample data set, but you can use your own data.
- You should have an understanding of Elasticsearch documents and indices and Kibana concepts.
Find your data
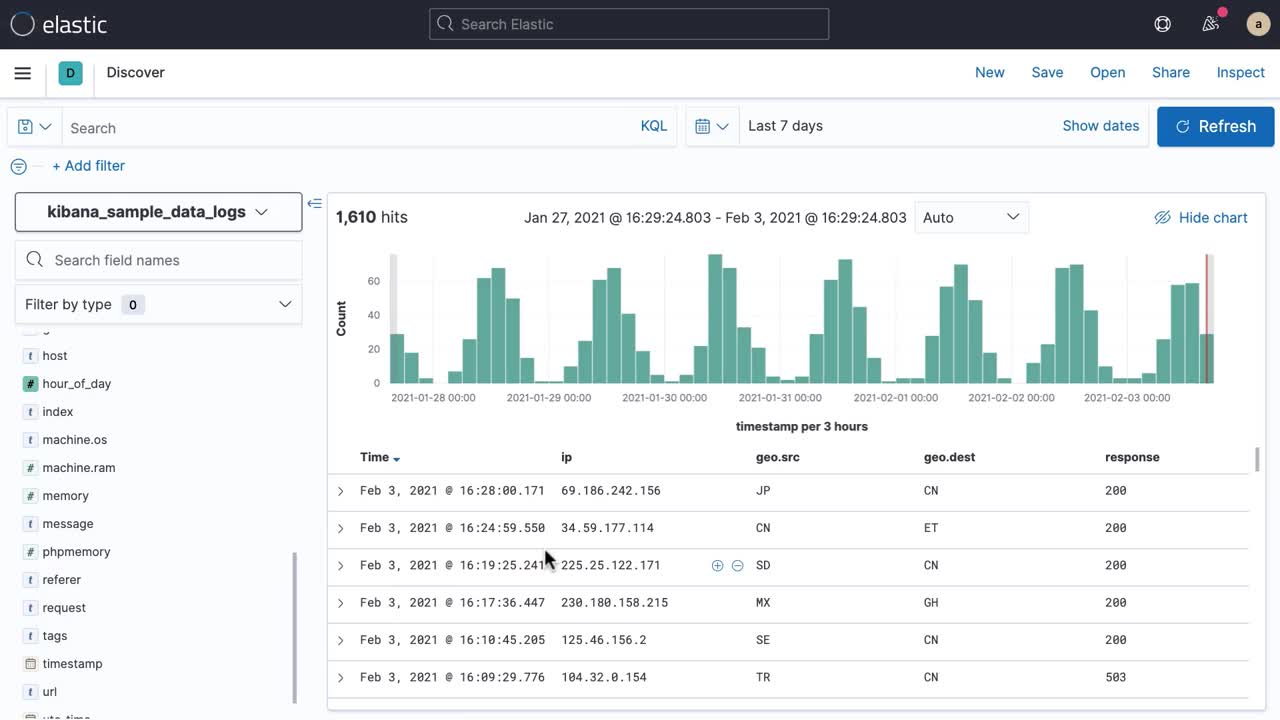
editTell Kibana where to find the data you want to explore, and then specify the time range in which to view that data.
- Open the main menu, and select Discover.
-
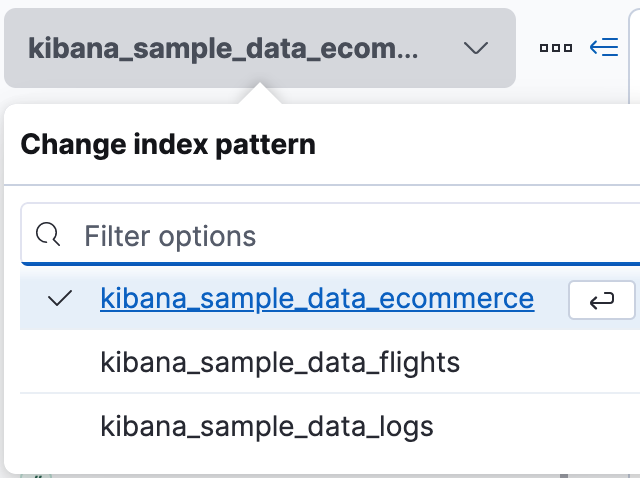
Select the data you want to work with.
Kibana uses an index pattern to tell it where to find your Elasticsearch data. To view the ecommerce sample data, make sure the index pattern is set to kibana_sample_data_ecommerce.
-
Adjust the time range to view data for the Last 7 days.
The range selection is based on the default time field in your data. If you are using the sample data, this value was set when you added the data. If you are using your own data, and it does not have a time field, the range selection is not available.
- To view the count of documents for a given time in the specified range, click and drag the mouse over the histogram.
Explore the fields in your data
editDiscover includes a table that shows all the documents that match your search.
By default, the table includes columns for the time field and the document _source,
which can be overwhelming. You’ll modify this table to display only your fields of interest.
-
Scan through the list of Available fields until you find the
manufacturerfield. You can also search for the field by name.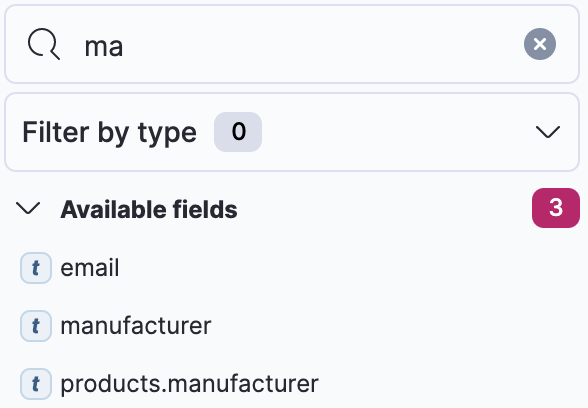
-
Click the
manufacturerfield to view its five most popular values.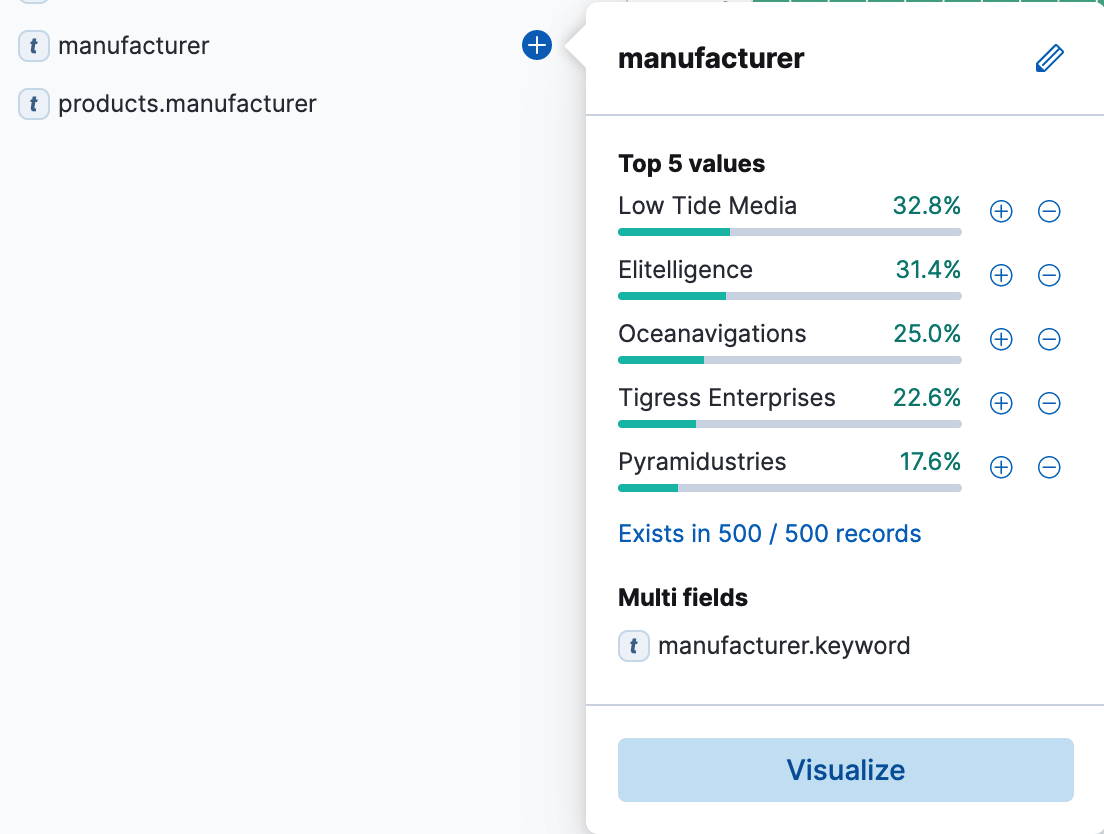
-
Click
 to toggle the field into the document table.
-
Find the
customer_first_nameandcustomer_last_namelast name fields and add them to your document table. Your table should look similar to this: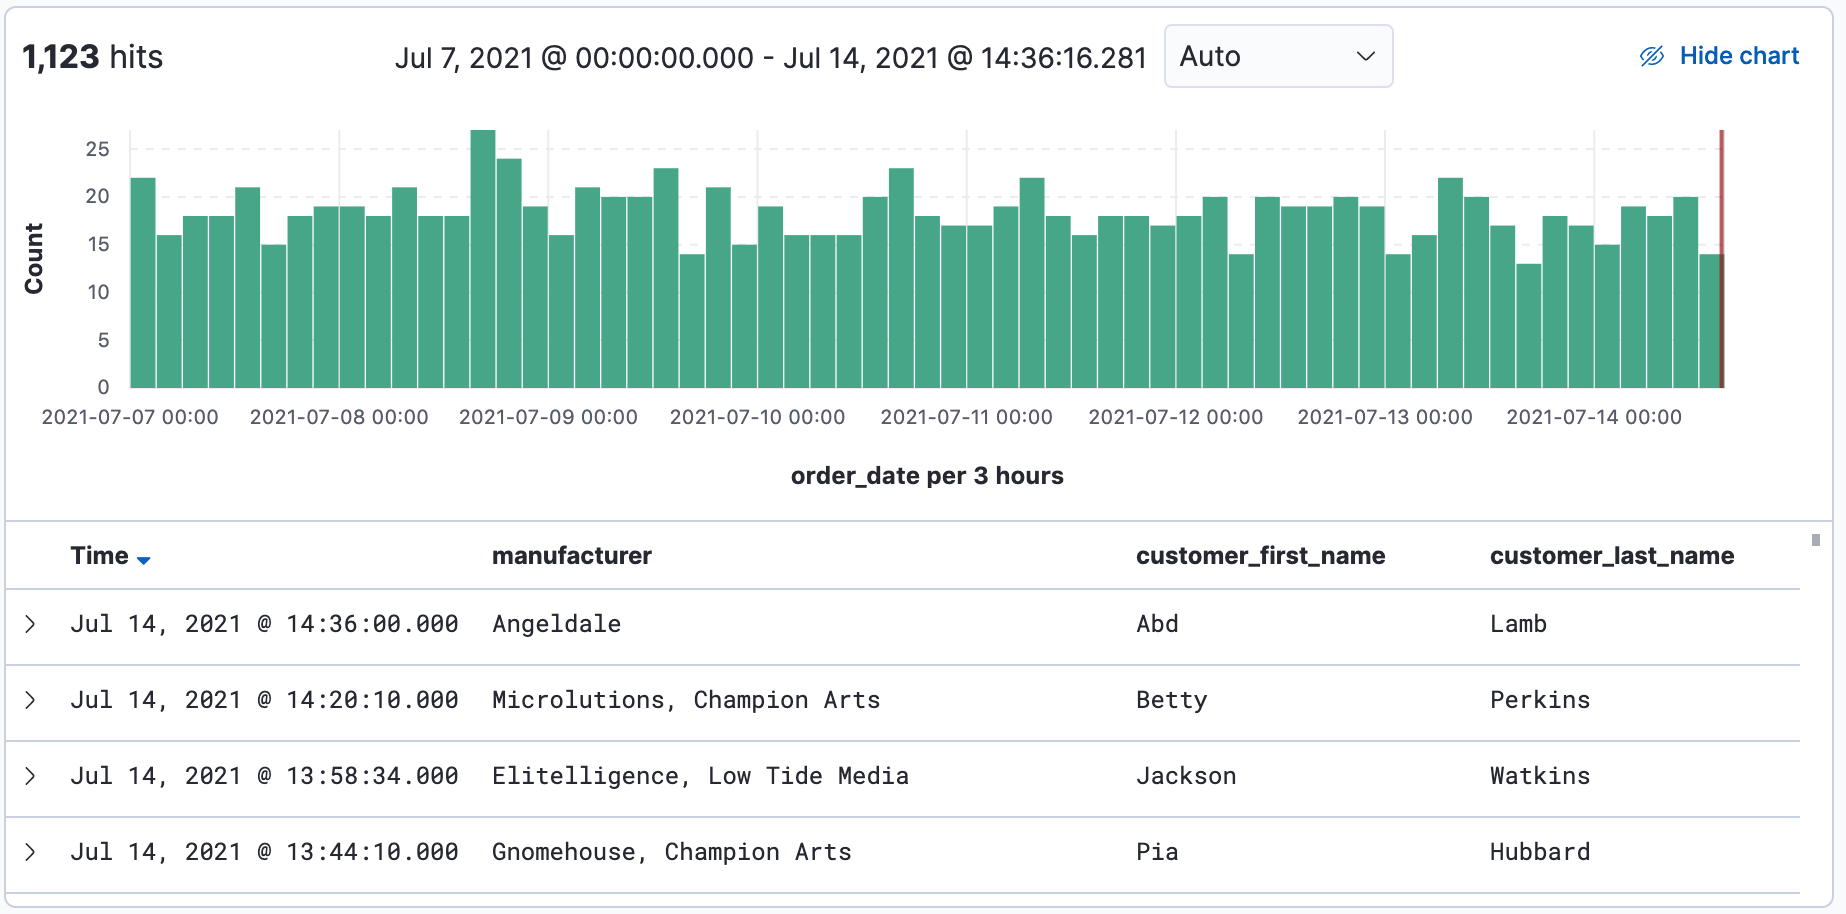
- To rearrange the table columns, hover the mouse over a column header, and then use the move controls.
- To view more of the document table, click Hide chart.
Add a field to your index pattern
editWhat happens if you forgot to define an important value as a separate field? Or, what if you want to combine two fields and treat them as one? This is where runtime fields come into play. You can add a runtime field to your index pattern from inside of Discover, and then use that field for analysis and visualizations, the same way you do with other fields.
-
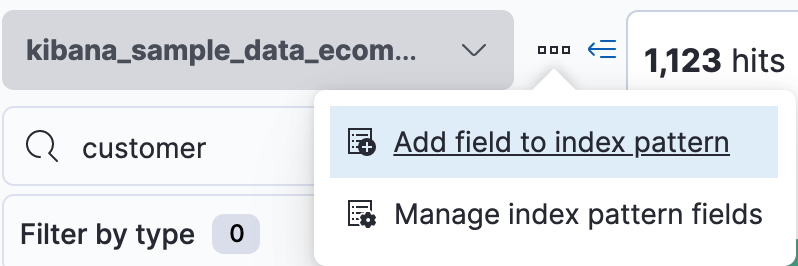
Click the ellipsis icon (…), and then click Add field to index pattern.
-
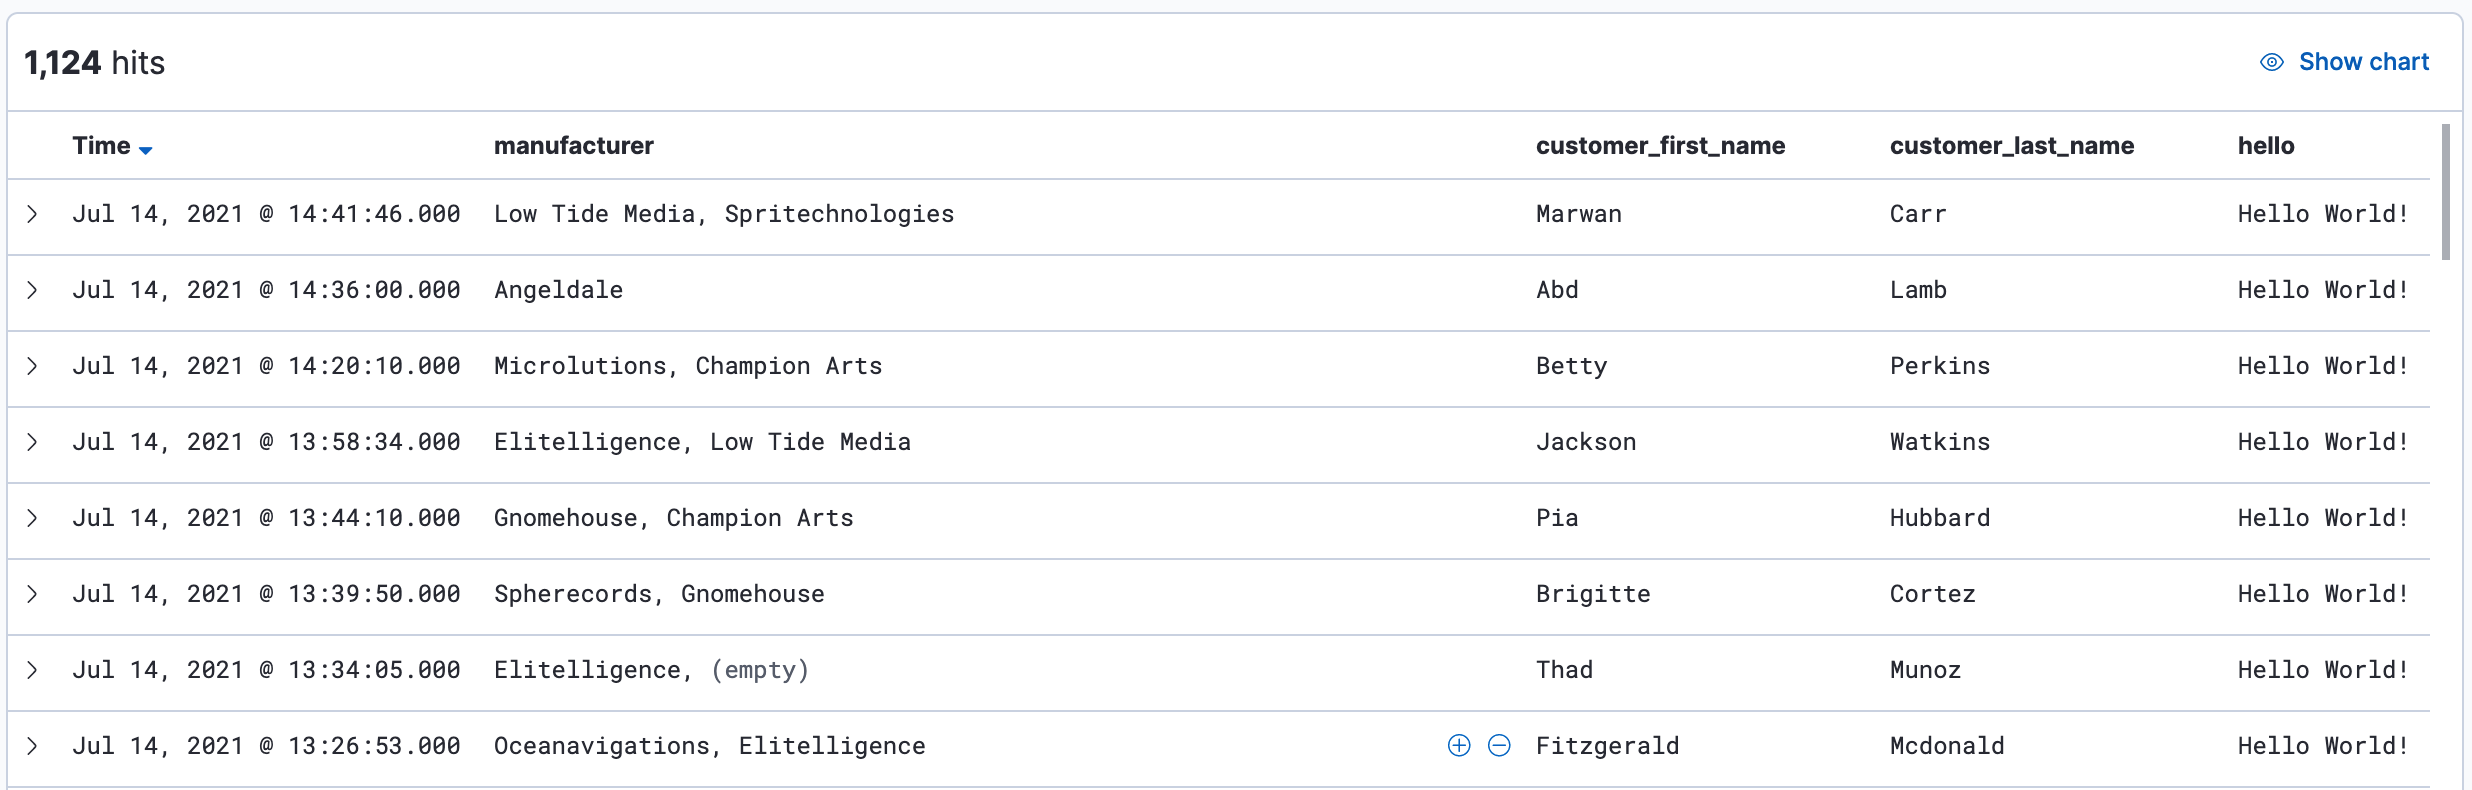
In the Create field form, enter
hellofor the name. - Turn on Set value.
-
Define the script using the Painless scripting language. Runtime fields require an
emit().emit("Hello World!"); - Click Save.
-
In the fields list, search for the hello field, and then add it to the table to view it’s value.
-
Create a second field named
customerthat combines customer last name and first initial.String str = doc['customer_first_name.keyword'].value; char ch1 = str.charAt(0); emit(doc['customer_last_name.keyword'].value + ", " + ch1);
-
Simplify the the document table by removing
customer_first_nameandcustomer_last_nameand addingcustomerin their place.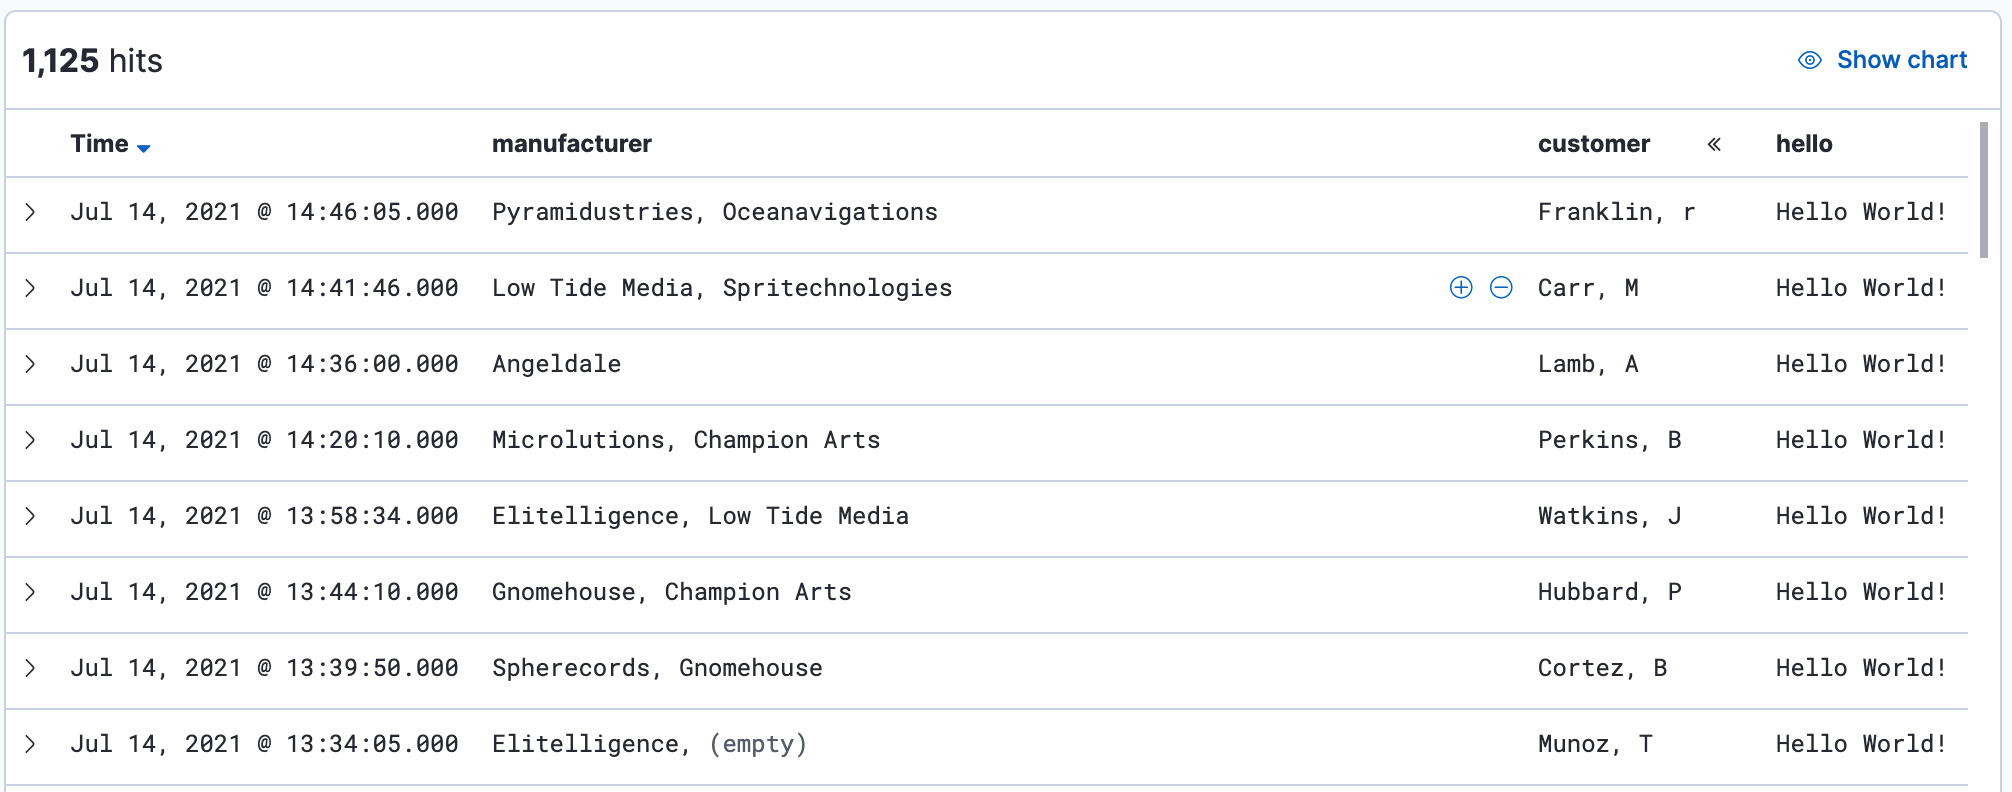
For more information on adding fields and Painless scripting language examples, refer to Explore your data with runtime fields.
Search your data
editOne of the unique capabilities of Discover is the ability to combine free text search with filtering based on structured data. To search all fields, enter a simple string in the Search field.

To search particular fields and build more complex queries, use the Kibana Query language. As you type, KQL prompts you with the fields you can search and the operators you can use to build a structured query.
Search the ecommerce data for documents where the country matches US:
-
Enter
g, and then select geoip.country_iso_code. - Select equals some value and US, and then click Update.
-
For a more complex search, try:
geoip.country_iso_code : US and products.taxless_price >= 75
Filter your data
editWhereas the query defines the set of documents you are interested in, filters enable you to zero in on different subsets of those documents. You can filter results to include or exclude specific fields, filter for a value in a range, and more.
Exclude documents where day of week is not Wednesday:
- Click Add filter.
-
Set Field to day_of_week, Operator to is not, and Value to Wednesday.
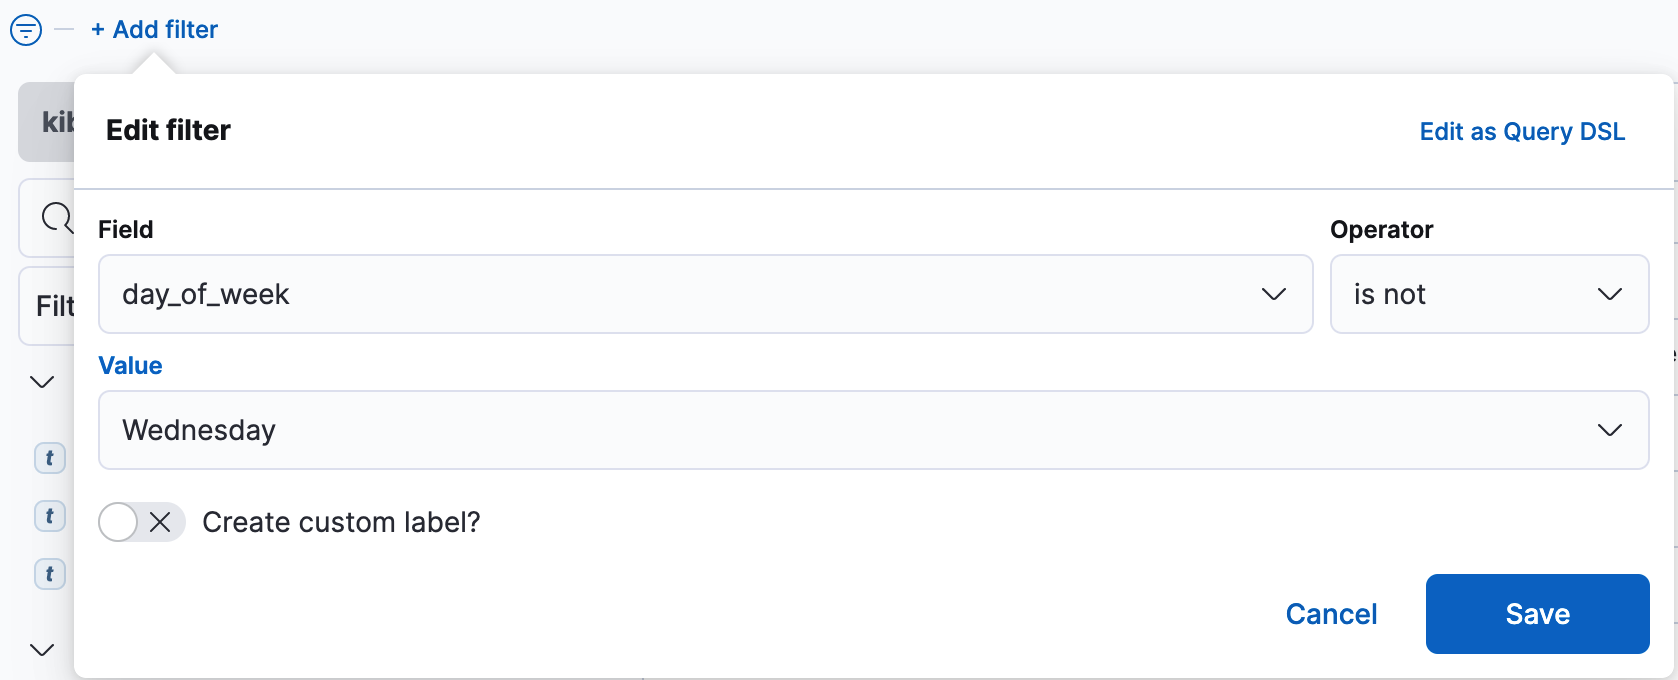
- Save the filter.
- Continue your exploration by adding more filters.
- To remove a filter, click the close icon (x) next to its name in the filter bar.
Look inside a document
editDive into an individual document to view its fields and the documents that occurred before and after it.
-
In the document table, expand any document.
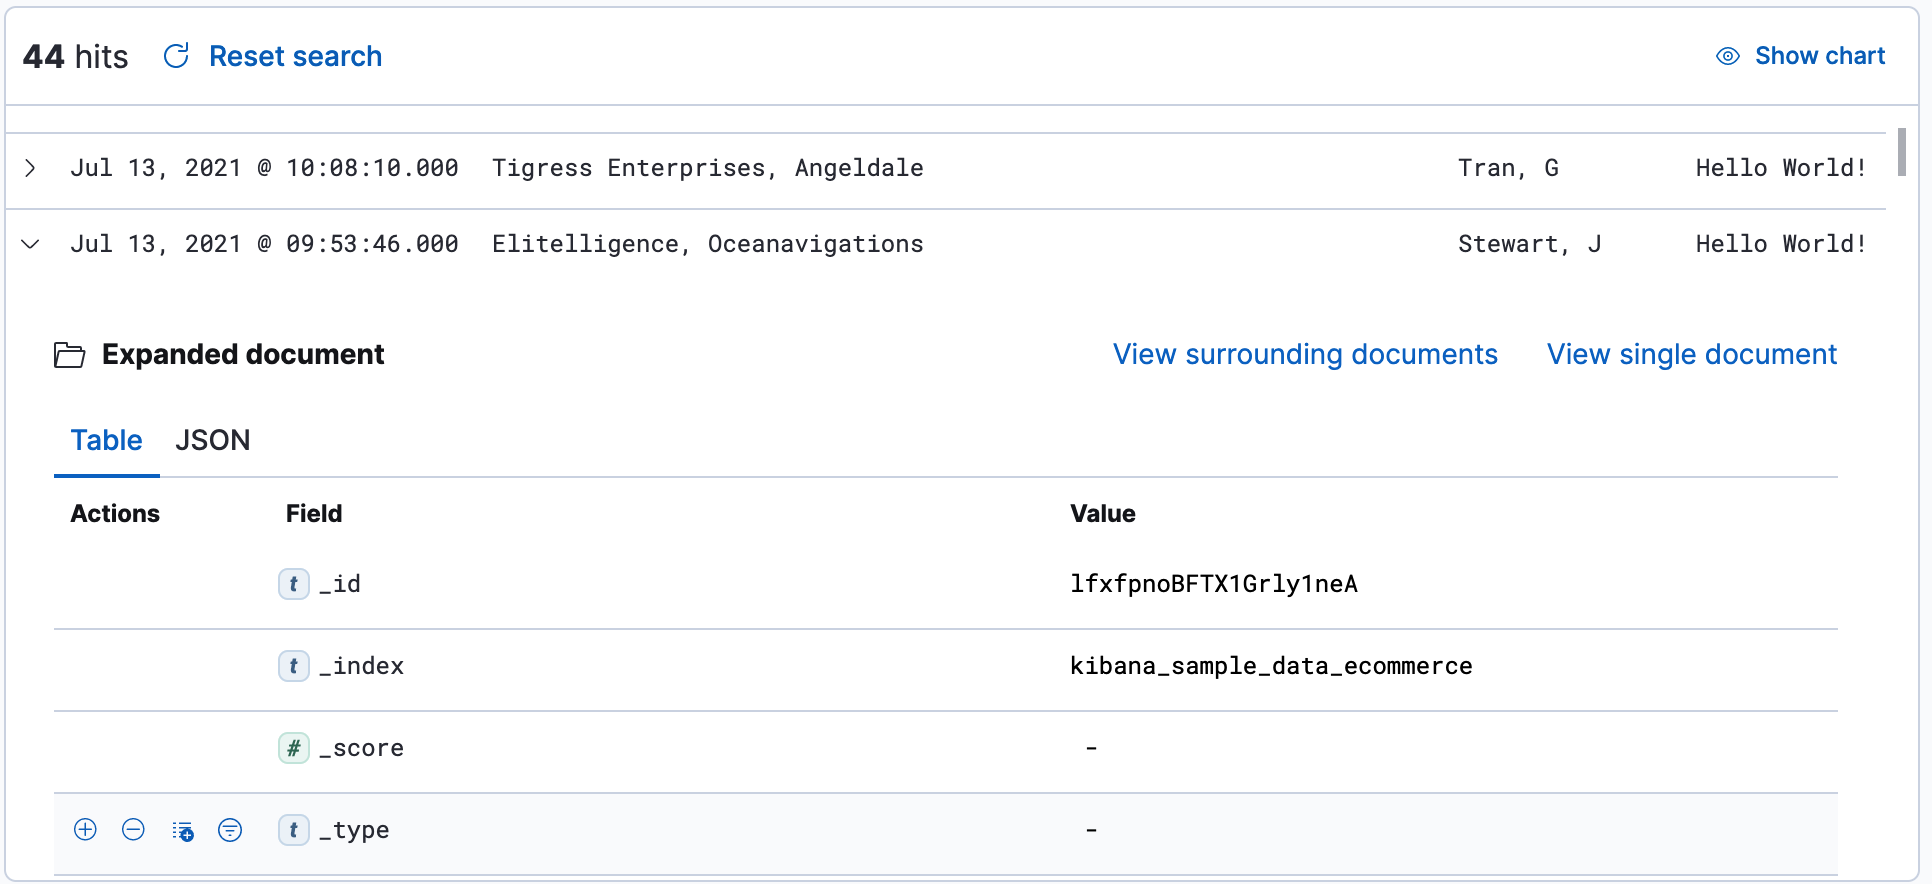
- Scan through the fields and their values. If you find a field of interest, hover over its name for filters and other controls.
- To view documents that occurred before or after the event you are looking at, click View surrounding documents.
-
For direct access to a particular document, click View single document.
You can bookmark this document and share the link.
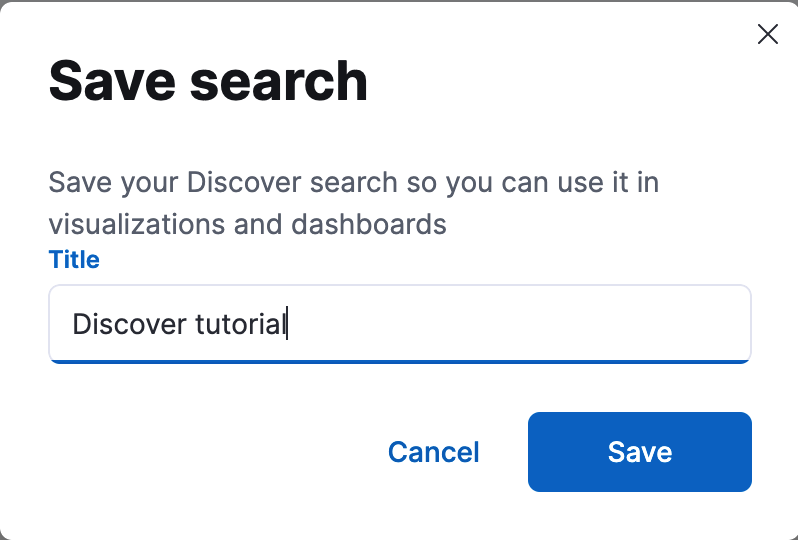
Save your search for later use
editSave your search so you can repeat it later, generate a CSV report, or use it in visualizations, dashboards, and Canvas workpads. Saving a search saves the query text, filters, and current view of Discover—the columns selected in the document table, the sort order, and the index pattern.
- In the toolbar, click Save.
-
Give your search a title, and then click Save.
Visualize your findings
editIf a field can be aggregated, you can quickly visualize it from Discover.
-
From the Available fields list, click
day_of_week, and then click Visualize.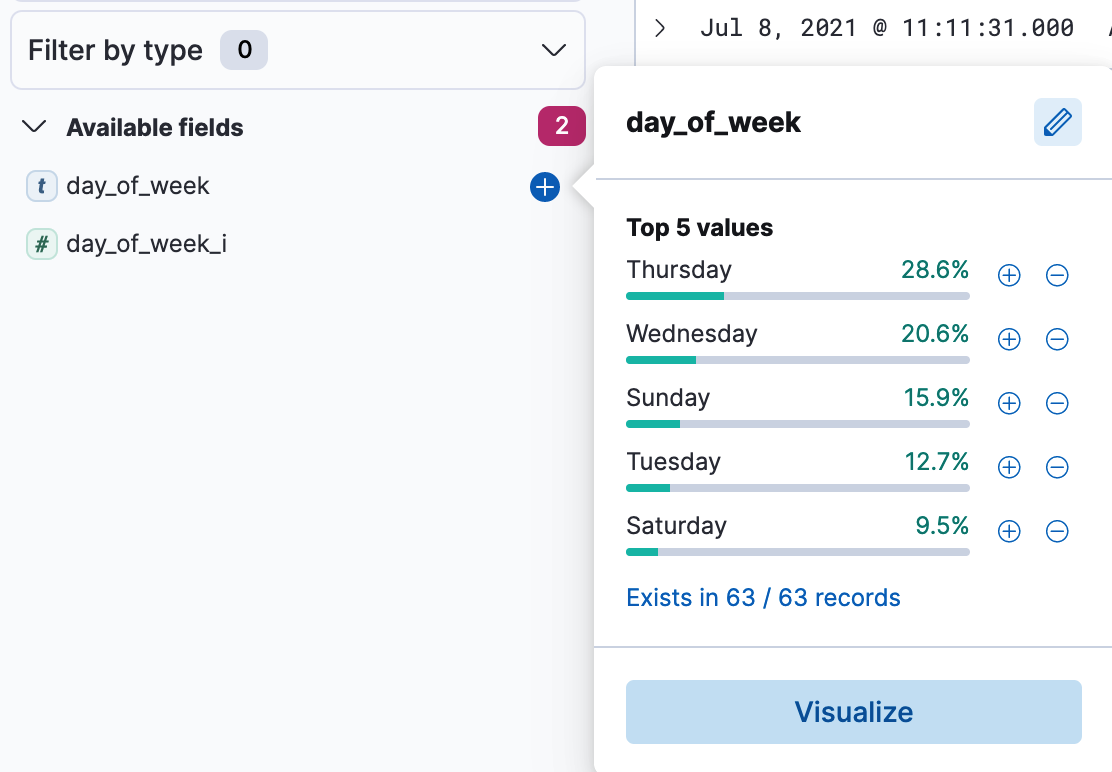
Kibana creates a visualization best suited for this field.
-
From the Available fields list, drag and drop
manufacturer.keywordonto the workspace.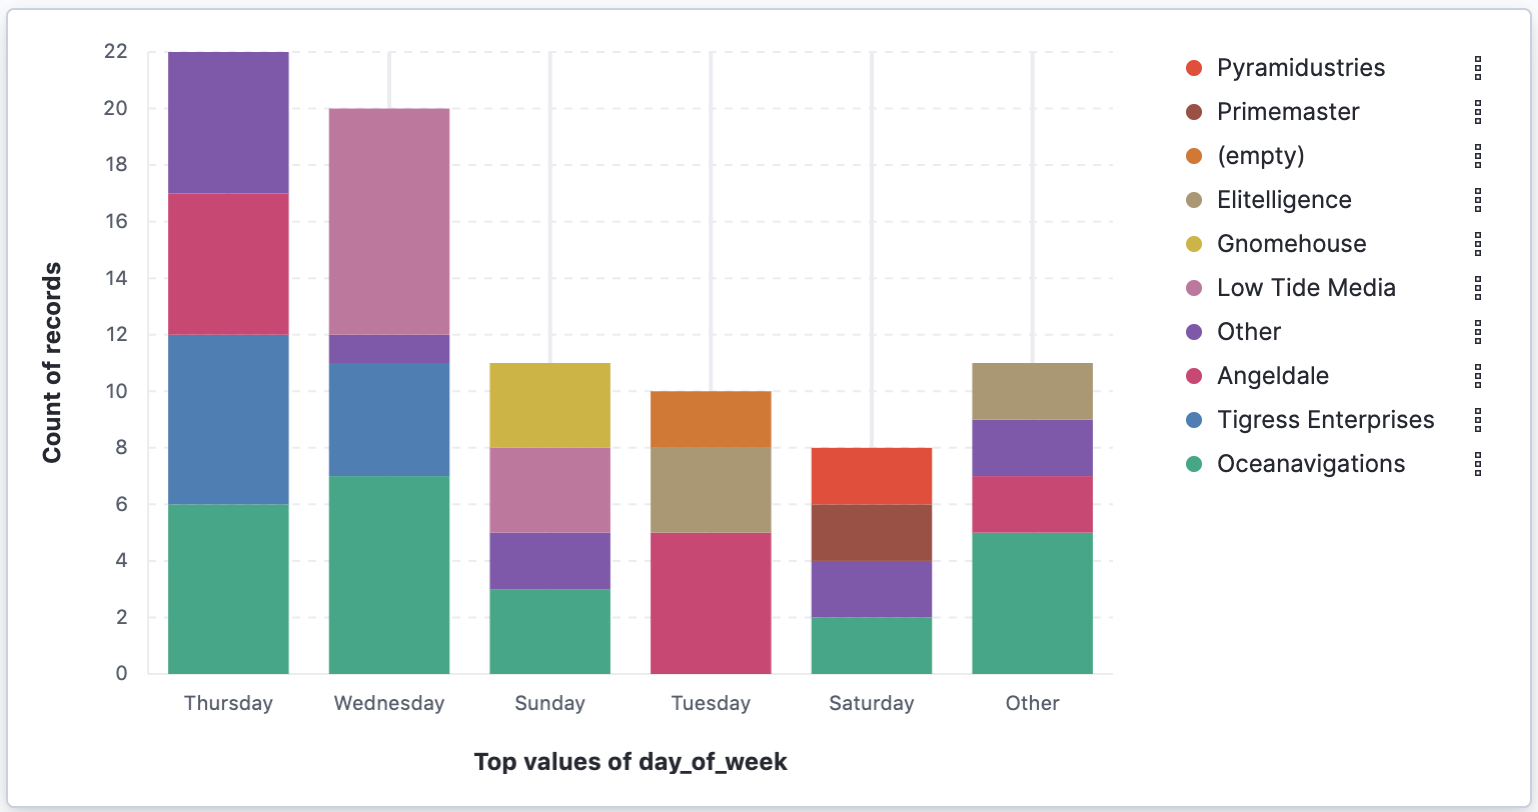
-
Save your visualization for use on a dashboard.
For geo point fields (
 ),
if you click Visualize,
your data appears in a map.
),
if you click Visualize,
your data appears in a map.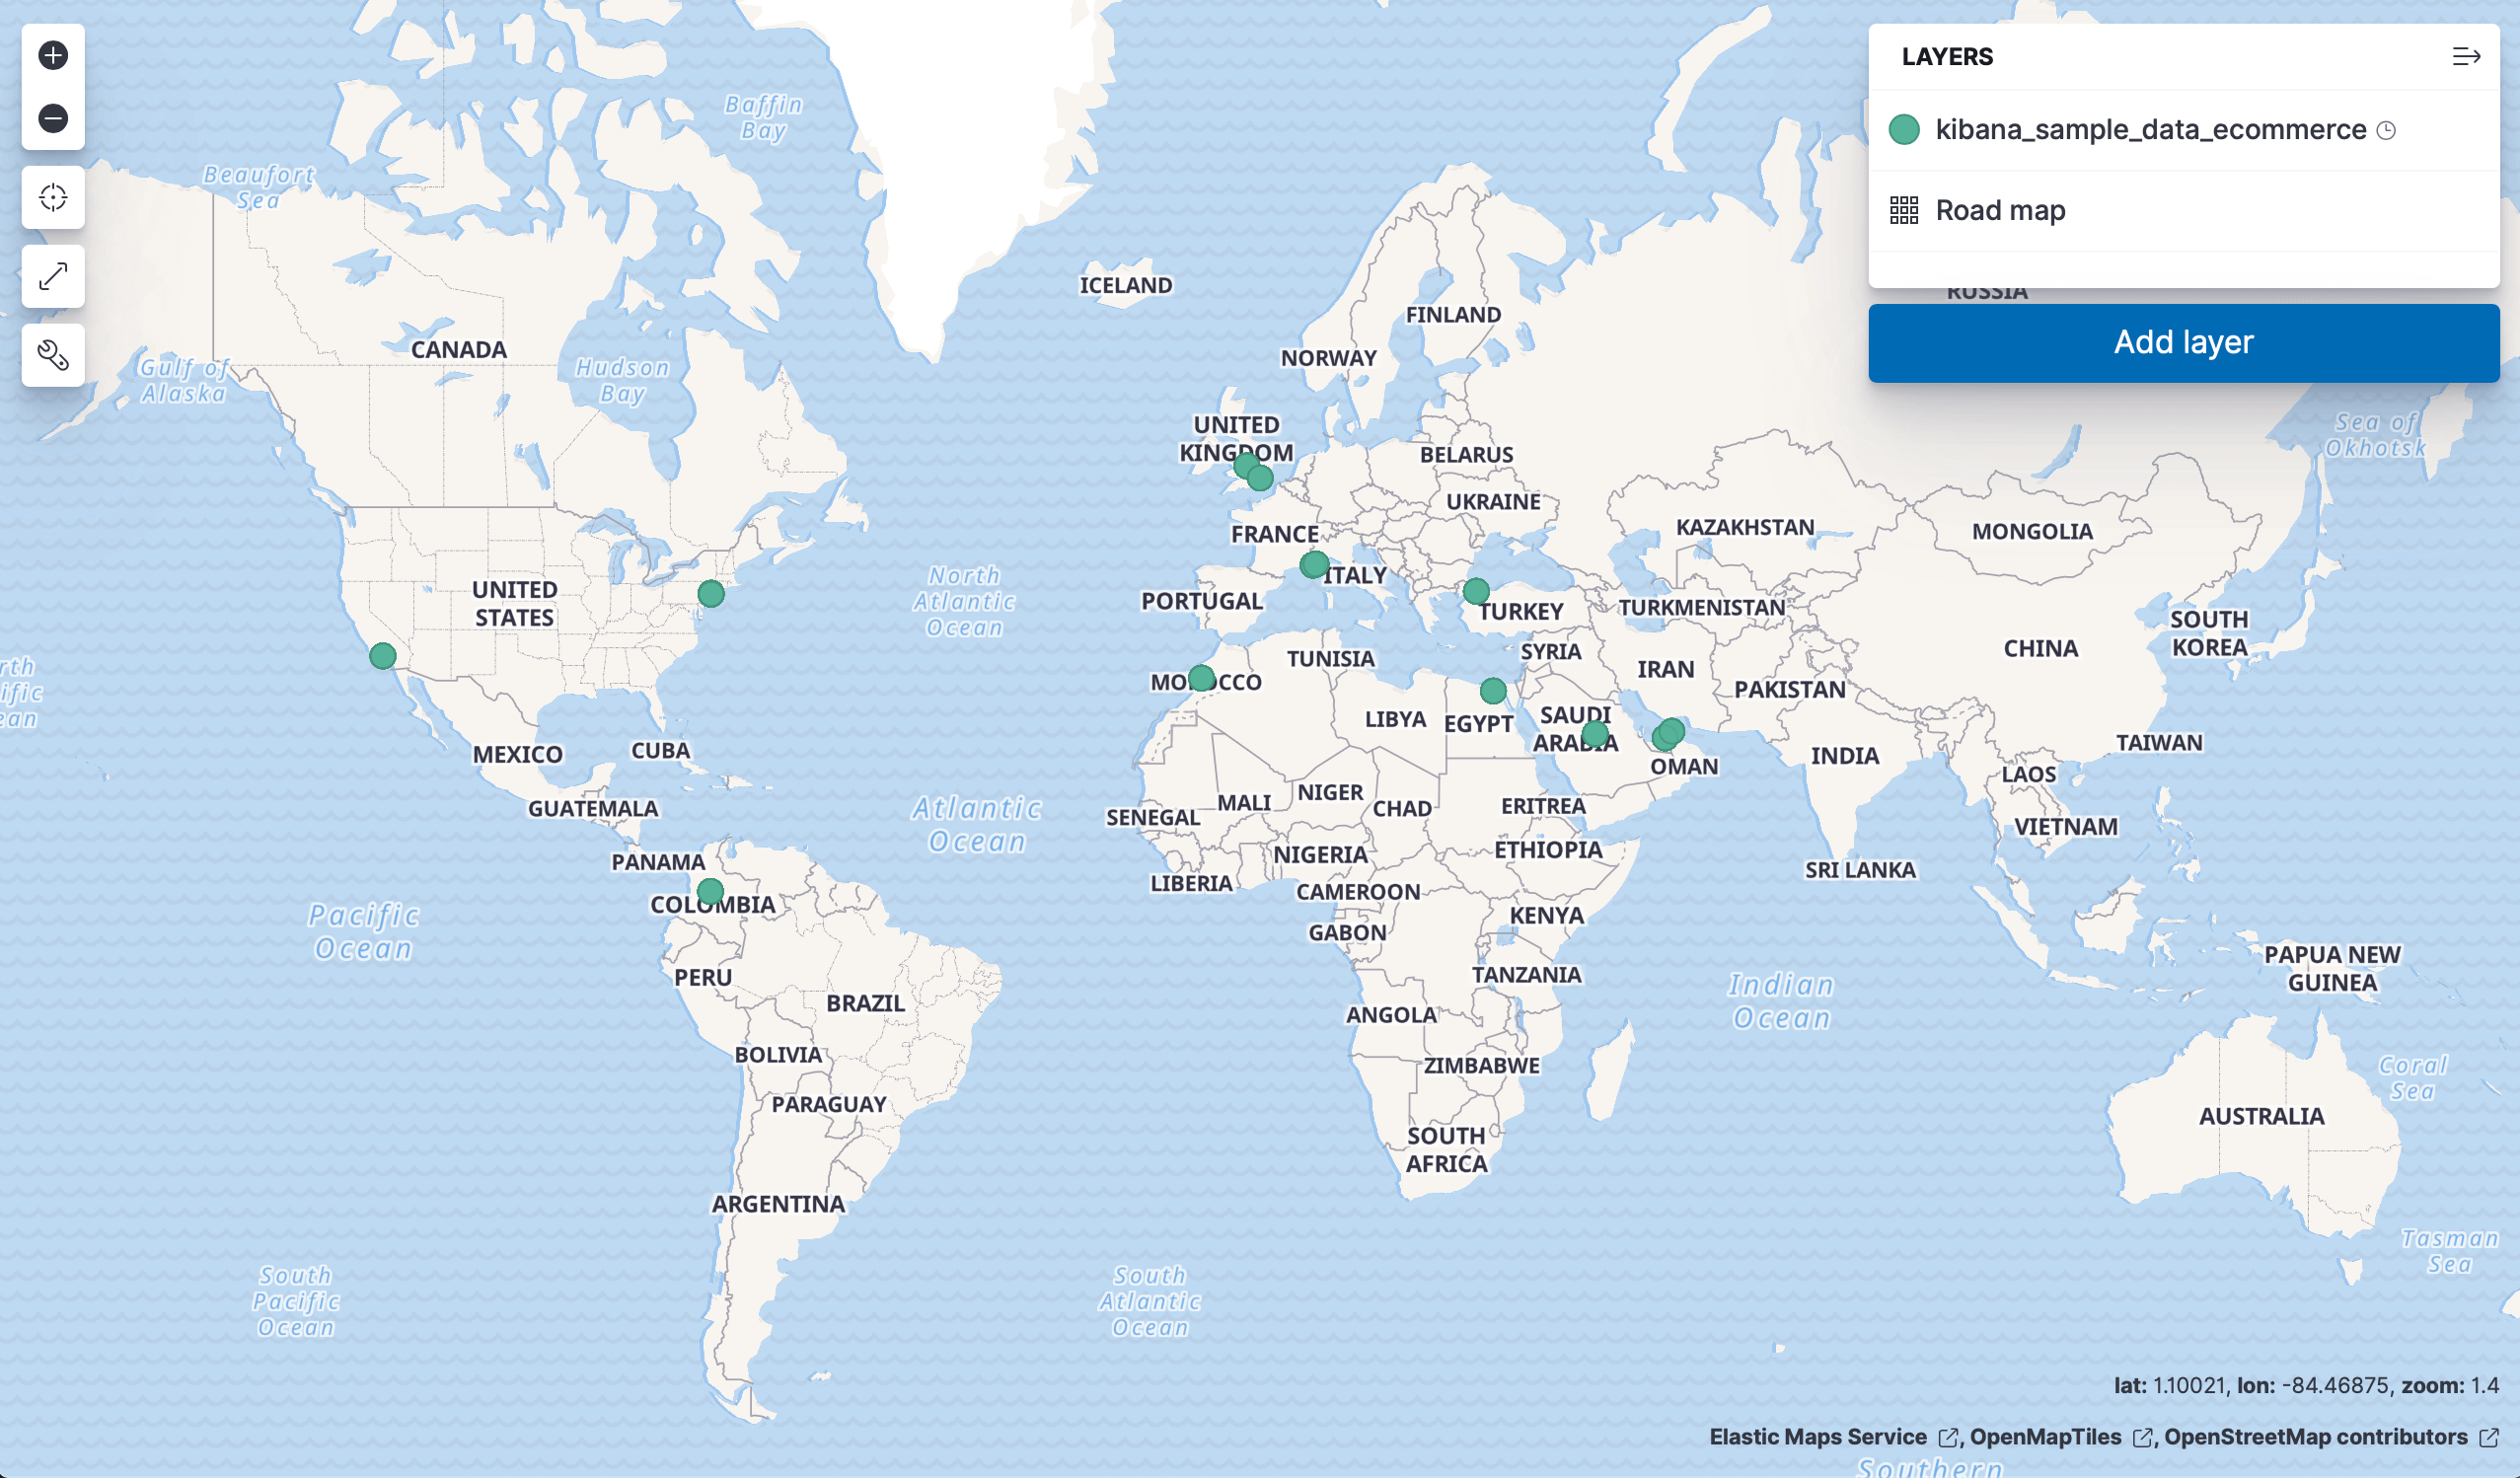
Share your findings
editTo share your findings with a larger audience, click Share in the toolbar. For detailed information about the sharing options, refer to Reporting.
What’s next?
edit- Learn more about the structure of a KQL query.
- Search for relevance.
- Present your findings in a report.
- Configure Discover to better meet your needs. Go to Advanced Settings to configure the number of documents to show, the table columns that display by default, and more.