Elastic Observability 8.6: Maximizing operational efficiencies with improved application analysis and workflow integrations

 Share on Twitter
Share on Twitter

 Share on LinkedIn
Share on LinkedIn

 Share on Facebook
Share on Facebook

 Share by Email
Share by Email

 Print this page
Print
Elastic Observability 8.6 introduces a set of capabilities improving production operations through the introduction of host (EC2/GCP compute/Azure compute) observability, application dependency operations views (insights into databases, caches, etc), and a new connector for Opsgenie.
These new features allow customers to:
- Optimize cloud spend by analyzing the “fleet” (EC2/GCP compute/Azure compute) latencies and overall performance via host observability
- Optimize applications through a deeper analysis for application dependencies such as databases, caches, and related storage in Elastic APM
- Improve overall workflows by interconnecting Elastic cases (from alerts) via the new Opsgenie connector
Elastic Observability 8.6 is available now on Elastic Cloud — the only hosted Elasticsearch offering to include all of the new features in this latest release. You can also download the Elastic Stack and our cloud orchestration products, Elastic Cloud Enterprise and Elastic Cloud for Kubernetes, for a self-managed experience.
What else is new in Elastic 8.6? Check out the 8.6 announcement post to learn more >>
APM dependencies operations view provides valuable insights into application performance and availability
A core component of modern application architecture are the dependencies that an application interacts with — databases, queues, caches, and other external resources — along with the ability to capture and analyze the performance and availability of those dependencies. This capability is critically important to providing users with the experience they expect.
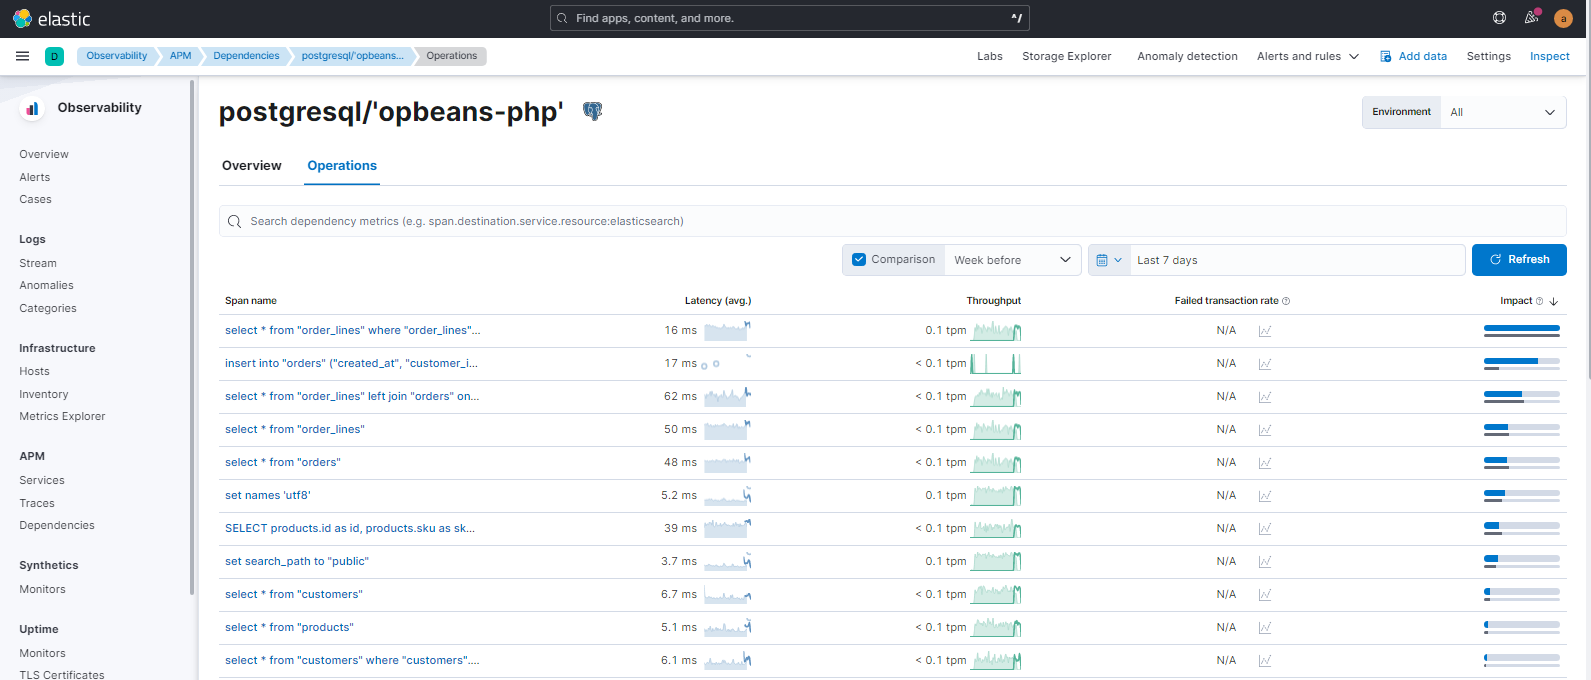
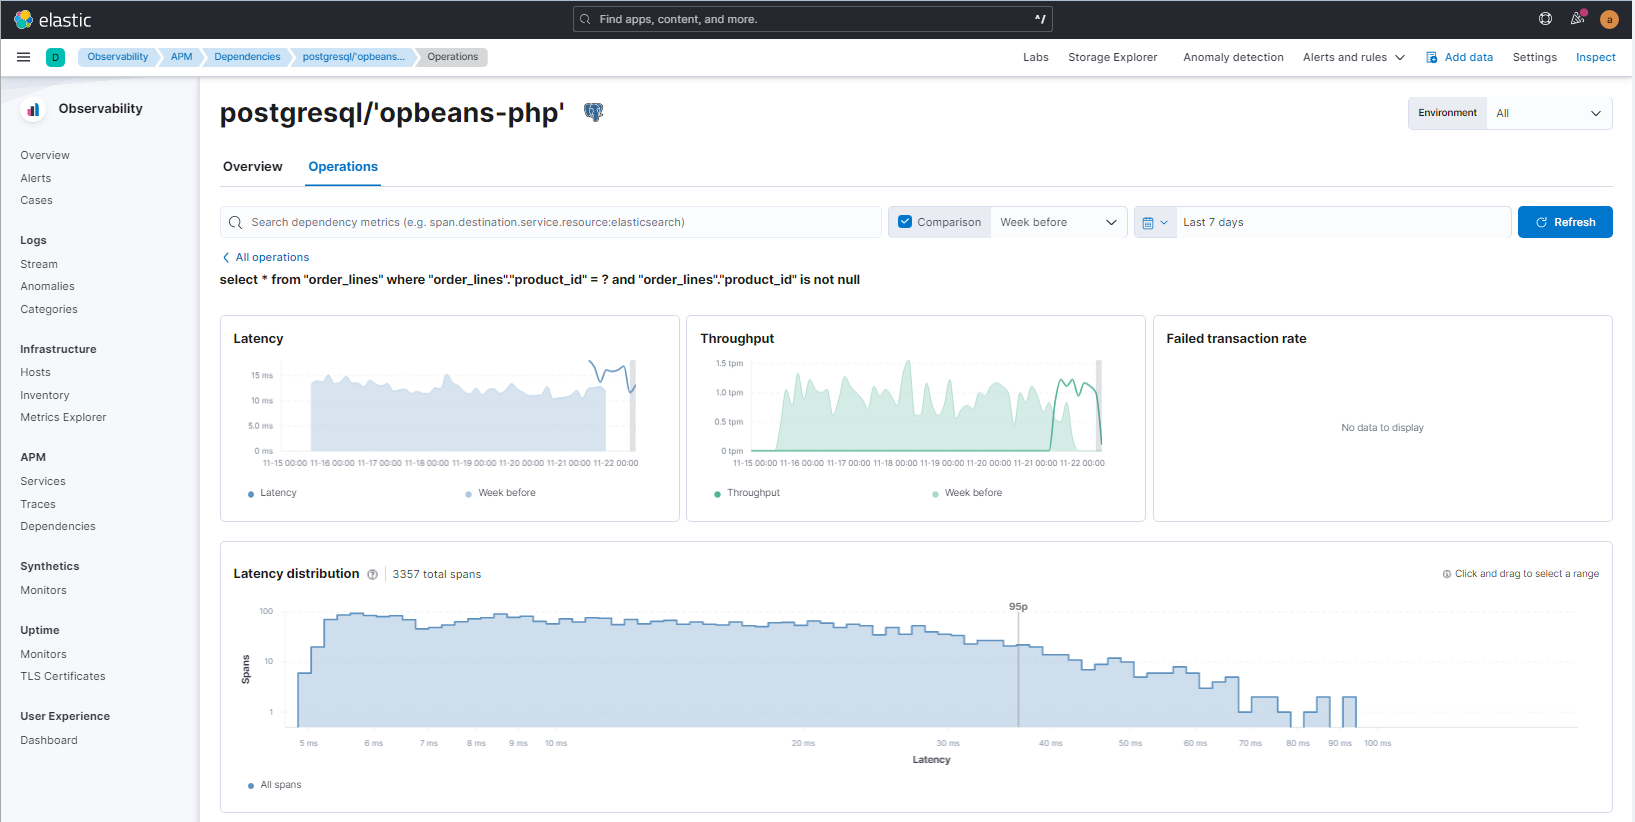
Elastic Observability 8.6 includes a new curated user journey that leads site reliability engineers (SREs) directly to problem areas with application dependencies. This makes it possible to easily access:
- All operations (spans) related to a particular instance of a dependency, including aggregate views for latency, throughput, failed transaction rate, and impact
- Interactive latency distribution graphs to isolate long running operations
- Trace waterfalls for individual instances of an operation to drill into the end-to-end experience of the entire related transaction
Receive Elastic Observability alerts in Opsgenie
With an easy, direct, and out-of-the-box integration with Opsgenie now available in Elastic Observability 8.6, alerts generated in Elastic can be seamlessly sent over to Opsgenie for efficient incident response and management. Upon alert recovery in Elastic, the corresponding alert in Opsgenie will be automatically closed, eliminating the need for manual alert closure and management.
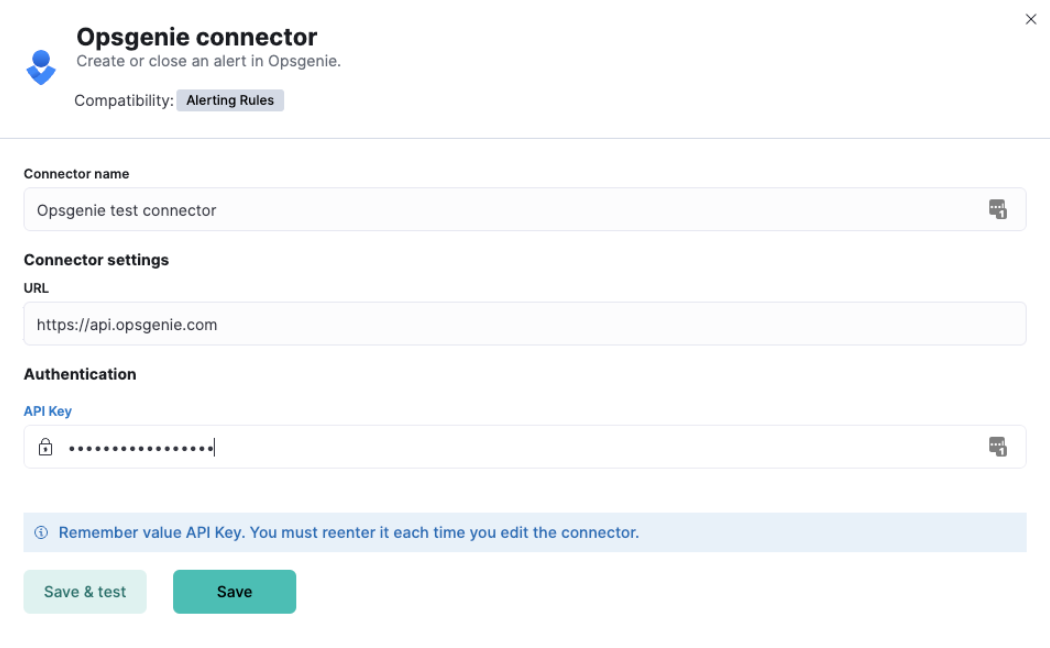
For more information, please refer to the Opsgenie connector documentation.
Try out Elastic Observability 8.6
Read about these capabilities and more in the release notes.
Existing Elastic Cloud customers can access many of these features directly from the Elastic Cloud console. Not taking advantage of Elastic on cloud? Start a free trial.
The release and timing of any features or functionality described in this post remain at Elastic's sole discretion. Any features or functionality not currently available may not be delivered on time or at all.
Share
- Share on Twitter
Share on Twitter
- Share on LinkedIn
Share on LinkedIn
- Share on Facebook
Share on Facebook
- Share by Email
Share by Email
- Print this page
Print