Kibana Lens is now generally available
We are excited to announce that with the 7.10 release, Kibana Lens has officially become generally available. Lens is the easiest and most intuitive way to visualize data in Elasticsearch with a simple drag-and-drop interface that lets anyone instantly begin exploring data for insights, regardless of their previous Kibana experience. After eleven months in beta (and incredible customer feedback during that time), we are thrilled to take this next step with Kibana Lens and let even more people begin to use it for an even wider set of use cases. To try Kibana Lens today, spin up the latest version of the Elastic Stack with Elasticsearch Service or download 7.10 for your own self-managed deployment. Also, don’t miss our upcoming Kibana Lens webinar where we’ll be walking through new features and use cases.
Where we started: Kibana Lens is born
Eleven months ago we unveiled an audacious new way to visualize data in the Elastic Stack by announcing the beta release of a new interface for exploring and seeing data in Elasticsearch called Kibana Lens. It was radically different from anything that had ever previously lived inside of Kibana, but we knew it was a direction we needed to boldly pursue in order to achieve our goal of giving users a world-class way to answer questions with data in the Elastic Stack. We focused on ease of use and creating an experience that let people stay in the flow of asking data questions without having to grapple with the interface itself. We took years of lessons learned from working with customers on complex data problems and transformed them into capabilities that focused on built-in ways to accelerate a user’s data journey. Most of all, we painstakingly challenged ourselves to build a tool that was flexible and fast enough to keep up with the lightspeed twists and turns of real-world ad hoc data analysis exercises.
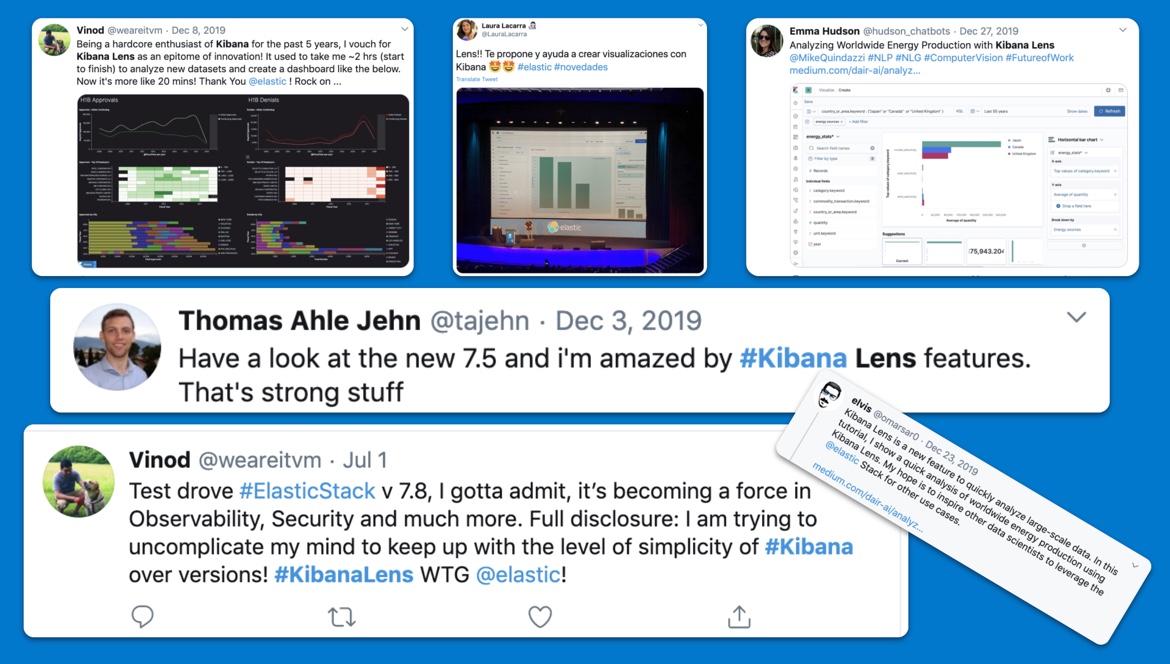
Our bet with Kibana Lens was a big one, but it wasn’t long before the feedback we began receiving told us that our focus on empowering users to be brilliant with data was the right move...
Where we are today: Kibana Lens is available for everyone
In the little under a year that Kibana Lens spent in beta, we watched as hundreds of thousands of people approached exploring data in Elasticsearch in a wholly new capacity. Lens gave them a way to not just quickly create charts and graphs, but to do even more fundamentally powerful things like easily see the data they had access to and what individual data fields looked like. The way Lens could immediately show data in different visualizations with just a simple mouse movement unlocked people’s natural rapid-fire human curiosity. Entire organizations began to change the way they worked with data as they discovered they could arm more of their teams with Lens to drive decision making without lengthy technical training.
And during this time we continued to innovate with Lens to support this sea-change happening within the community of our users and customers. In every release after unveiling Lens, we introduced new features and functionalities to strengthen the core pillars of our goal to let people move faster and be more creative when visualizing data. We added six new chart types, released multiple configuration and formatting options, and produced countless updates behind-the-scenes to guarantee performance and continuity. Even more, though, we focused on making sure Kibana Lens was deeply integrated into the rest of the Elastic Stack. Features like the ability to embed Lens visuals directly into Canvas, extending the ability to do brush interactions, and ensuring things like dashboard drilldowns worked flawlessly with Kibana Lens panels are just a few examples.
Both because of the progress we’ve made innovating with Kibana Lens, but more importantly, because of the overwhelming feedback we’ve received from users, we know that now is the right time to graduate Lens from beta to general availability and signal that it is ready for critical production use cases.
Where we are going: Kibana Lens in 7.10 and beyond
While moving to GA is a huge milestone for Kibana Lens, we see it in many ways as just the beginning of the journey. Our ongoing pursuit to empower everyone to be able to easily ask questions of Elasticsearch data with just a mouse and be able to produce visually stunning results is an endeavor we consider far from over. Our commitment to aggressively innovate with Lens on behalf of users everywhere is unchanged as evidenced by the 7.10 release itself. In this update, we have again added powerful new capabilities designed to push the boundaries of what is possible with visual analytics in the Elastic Stack. To learn more about these new features, keep reading the rest of this blog post, and also be sure to join us for the upcoming Kibana Lens webinar.
New features in Kibana Lens 7.10
Percentage chart types
When looking at absolute numbers and trying to compare them, one of the most useful approaches is to normalize the view by changing to percentages. With 7.10 we’ve added three new chart types designed to automatically accomplish this for you. Percentage stacked bar chart, percentage horizontal stacked bar chart, and percentage stacked area chart are all designed to show the relative percentage of multiple data series where the total (cumulative) of each stacked visual always equals 100%.
Explore distributions using Lens intervals
Which hour on a given day sees the highest traffic on your website? What day of the week do people most often buy shoes online? Of all the sales a company makes in a year, what is the breakdown by order size? These are classic analytical questions that often require a specific understanding of the underlying data in order to generate an accurate answer. In 7.10, Kibana Lens helps you address these questions automatically with the addition of the intervals function. Now in Lens, when you place a numerical value on the x-axis you will see a distribution displayed. Even better, you can increase or decrease the granularity of the distribution view with a slider to suit your analysis.
Sometimes, however, you want to set ranges manually using specific logic. Intervals in Lens helps you accomplish this as well with a simple toggle allowing you to plug in as many defined custom ranges as you need.
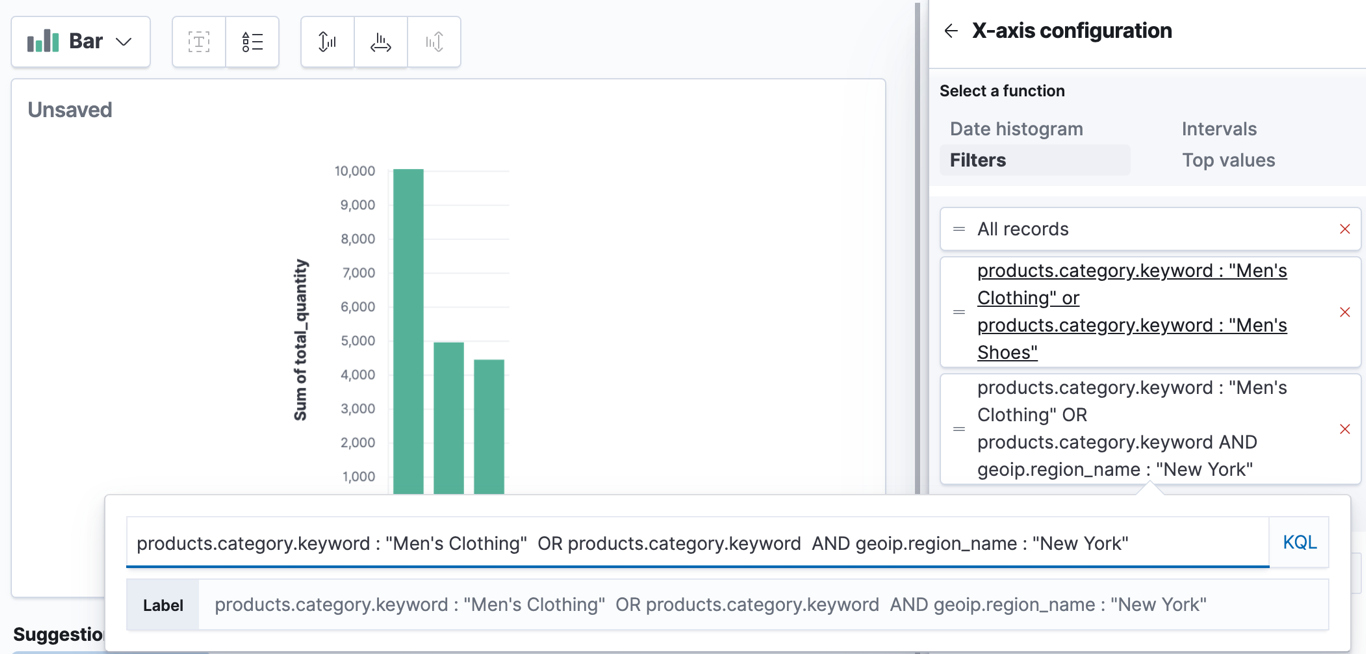
Lens filter aggregations
Anyone familiar with Elasticsearch likely already knows and loves filter aggregations. This unique capability allows you to group data results into discrete buckets based on a search query (e.g. show me the average product price where product name = “chocolate bar” as one bucket and then the average product price where product name = “tater tots” in another). Kibana’s ability to provide a friendly interface for this powerful querying capability has been one of its many loved and differentiating features, especially when visualizing data. With 7.10 we are bringing filter aggregations into Kibana Lens to combine the ease of a drag-and-drop interface with the power of things like wildcard and multiple condition query parameters. The result is a significantly deeper analytical capability for Kibana Lens as a whole.
Fine-tune your Lens visuals with line and legend formatting
In the world of data visualization, sometimes less is more. Being able to reduce visual clutter in an analysis or even simply move a contextual element can have a dramatic impact on the effectiveness of conveying a data insight. To better help Lens users everywhere do this we are introducing the ability to toggle grid and tick lines on and off in 7.10. Furthermore, we’ve added a chart legend configuration panel that lets you decide where you’d like to place your legend (top, bottom, left, or right) next to your visualization, or remove it completely.
Summary
We are delighted with 7.10 to be able to bring Kibana Lens out of beta and graduate it to general availability status as well as deliver a host of new features. We continue to work hard to expand the boundaries of what is possible with data visualization in Kibana and the Elastic Stack on behalf of our user community. We welcome your feedback and as always, you can find us on Twitter (@elastic), in the Kibana forums, and monitoring the Kibana GitHub issues page.
And for more details on other Kibana features released in 7.10, be sure to check out the main Kibana release blog.
Get started with Lens today
To get started with Kibana Lens, spin up a cluster on Elasticsearch Service or install the latest version of the Elastic Stack. Already have Kibana running? Just upgrade your clusters to 7.10 and give Lens a try.
You can find Lens when you add a new panel into a dashboard or within the Visualize app inside of Kibana. Lens can be added to a dashboard just like any other visualization.