Elastic Metrics 7.7.0 released with enhanced Prometheus integration, PCF support, and more
We’re excited to announce that a new release of Elastic Metrics, 7.7.0, is now available on the Elasticsearch Service, or if you download the Elastic Stack. Highlights of this release are the brand new alerting for metrics, Prometheus PromQL queries, enhancements for Azure, AWS, GCP, PCF integrations, the list goes on. Let’s dive in.
Boosting Prometheus monitoring with Elastic long-term storage, PromQL Queries, and OpenMetrics
Prometheus is an open source monitoring tool built primarily for collecting metrics from containerized workloads. We like Prometheus and are continuously working on improving our Prometheus integration so that our users can benefit from the best of both worlds. Already today you can use Metricbeat to capture Prometheus metrics and store them together with other types of operational and security data in Elasticsearch. Why is this so important? In a world of microservices deployed in containers that run inside Kubernetes clusters, you want to gain full visibility into your distributed, hybrid environments. That’s what observability is about. This involves combining metrics with other types of data, such as logs, APM, security, etc. With the Elastic Stack you are able to do that in a simple way — run Prometheus instances on the edge, and store metrics for as long as you want along with your other data in a scalable, centralized Elasticsearch deployment. That means centralized global view, secure long-term storage, and increased observability.

To retain Prometheus metrics in a scalable, durable way for extended analysis (e.g., seasonality of time series), Prometheus requires a long-term storage solution which it can integrate with by writing samples that it ingests to a remote URL, in a standardized format — an aptly named remote_write operation. In this release we’ve added support for remote_write to our Prometheus module that allows transparently sending Prometheus metrics to Elasticsearch. We recommend this approach for connecting Prometheus to Elasticsearch as a long-term storage backend.
One of the features that has made Prometheus so popular is the PromQL query language, which is used to transform and visualize metrics, and also for defining alert conditions in the Prometheus AlertManager. We’ve been getting a lot of feedback and requests to support PromQL since our users would like to reuse PromQL queries for the Prometheus metrics they’re storing in Elasticsearch.
In this release we’re happy to introduce the initial support for PromQL queries in our Prometheus integration. Now you can use the new query metricset in the Prometheus module that lets you store results of PromQL queries as custom metrics in Elasticsearch. Here’s just a few things that you can do with this:
- Use the results of existing queries to build familiar dashboards in Kibana
- Store results of your queries instead of raw data
- Bring alert conditions into Elasticsearch and combine them with other data points
Here’s a sample configuration that calculates a per-second rate of HTTP requests measured over the last 5 minutes and stores the results of the query in the prometheus.query.rate_http_requests_total metric:
- module: prometheus
  period: 10s
  hosts: ["localhost:9090"]
  metricsets: ["query"]
  queries:
  - name: "rate_http_requests_total"
    path: "/api/v1/query"
    params:
      query: "rate(prometheus_http_requests_total[5m])"
In this release we’ve also added a dedicated integration for OpenMetrics-compatible metric endpoints. The new OpenMetrics module can scrape any custom metrics that comply with the OpenMetrics format. The module makes it easy to control what metrics to scrape with the help of metrics_filters.include and metrics_filters.exclude configuration options. All metrics scraped with this module are prefixed with openmetrics.metrics.*.
Alerting for metrics
Alerting is one of the foundational blocks for practically monitoring of any type of infrastructure or service, as it helps to identify and respond to any important changes taking place in our environments.
A threshold alert is probably the most common type of alert, which, in its basic form, is used to indicate whether a metric has reached or exceeded a certain value. This usually triggers a certain action like sending an email or a Slack message, paging an operator, or invoking an external service.
In this release we’re happy to announce a new way of creating alerts in the Elastic Metrics app.
When we set out to create a new alerting experience for metrics we had several goals in mind. Such alerts should be easily configurable for any type of infrastructure (physical, ephemeral, cloud, or any combination thereof), they should automatically apply to new hosts or containers in dynamic environments, and they should enable precision alerting to avoid false positives.
All alerts can be created and managed from a central place in Kibana. However, from a usability perspective, we wanted to make alert creation a smooth experience that’s also embedded in the common usage of the Metrics app. Analyzing metrics in Metrics Explorer? Now you can create an alert that automatically populates alert details with information about the browsed metrics, filters, and groupings. All you need to do is set your thresholds, give the alert a name, and it’s good to go. Neat, right?
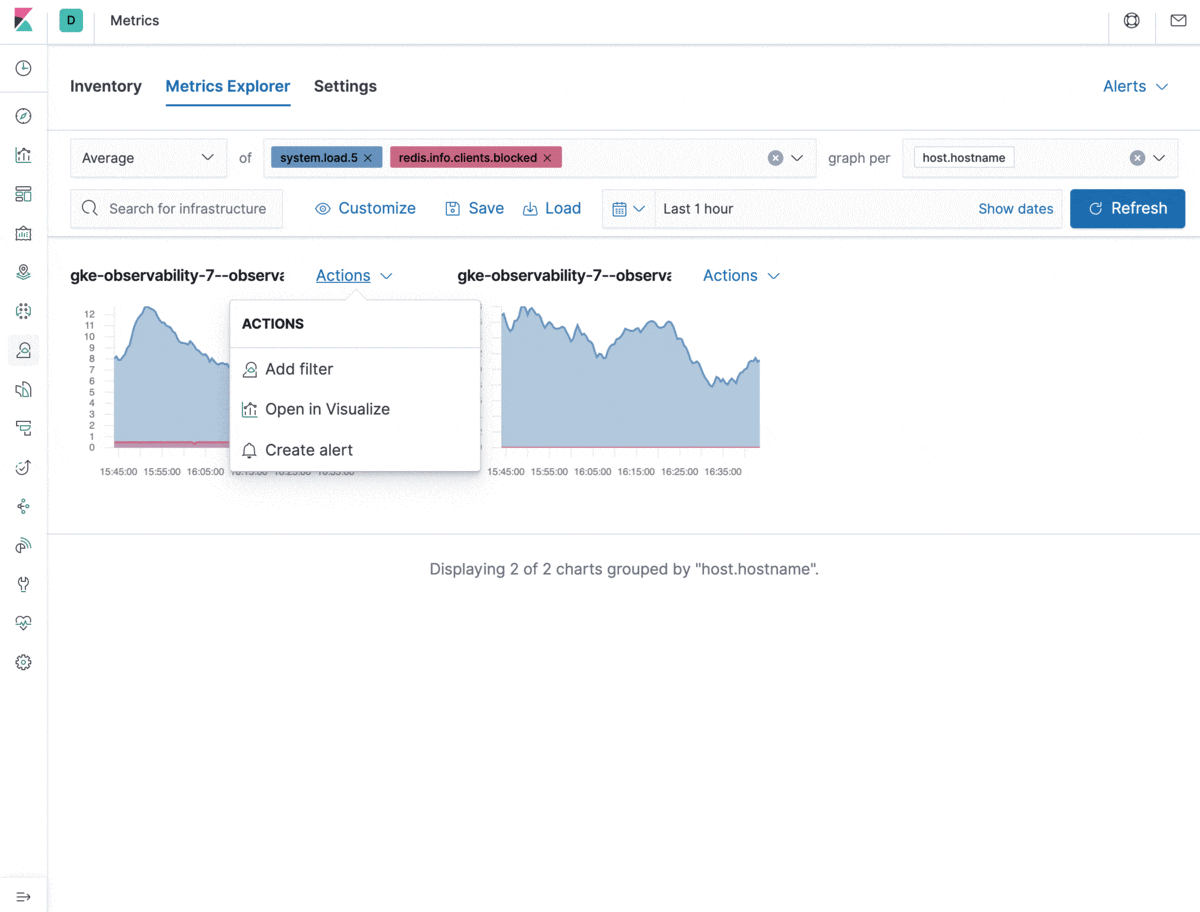
Let’s take a look at the types of problems the integrations with Kibana alerting and actions solve.
The new alerting for metrics allows you to combine multiple conditions into one. This can help you configure alerts to trigger only when, for example, the CPU load is unusually high AND the rate of database transactions has suddenly dropped. Combined conditions are handy for precision alerting and avoiding false positives. You can also use a single alert definition for groups of resources defined in the group field, which will fire an action for each applicable resource in the group. This is especially relevant in dynamic environments where there’s a high churn rate of containers or hosts. In some cases you want an alert to apply to only a subset of your resources reporting the metrics used in the alert condition. The filter setting is there exactly for this purpose — to help you control the alerting scope. The notification message field supports standard Markdown formatting and template variables to customize your alert notifications.
Did we mention that it’s free? That’s right — the new alerting for metrics is free in the Elastic Stack for everyone to use! So give it a try, download the latest version of Elastic and let us know what you think! Ask a question or leave feedback in our forums.
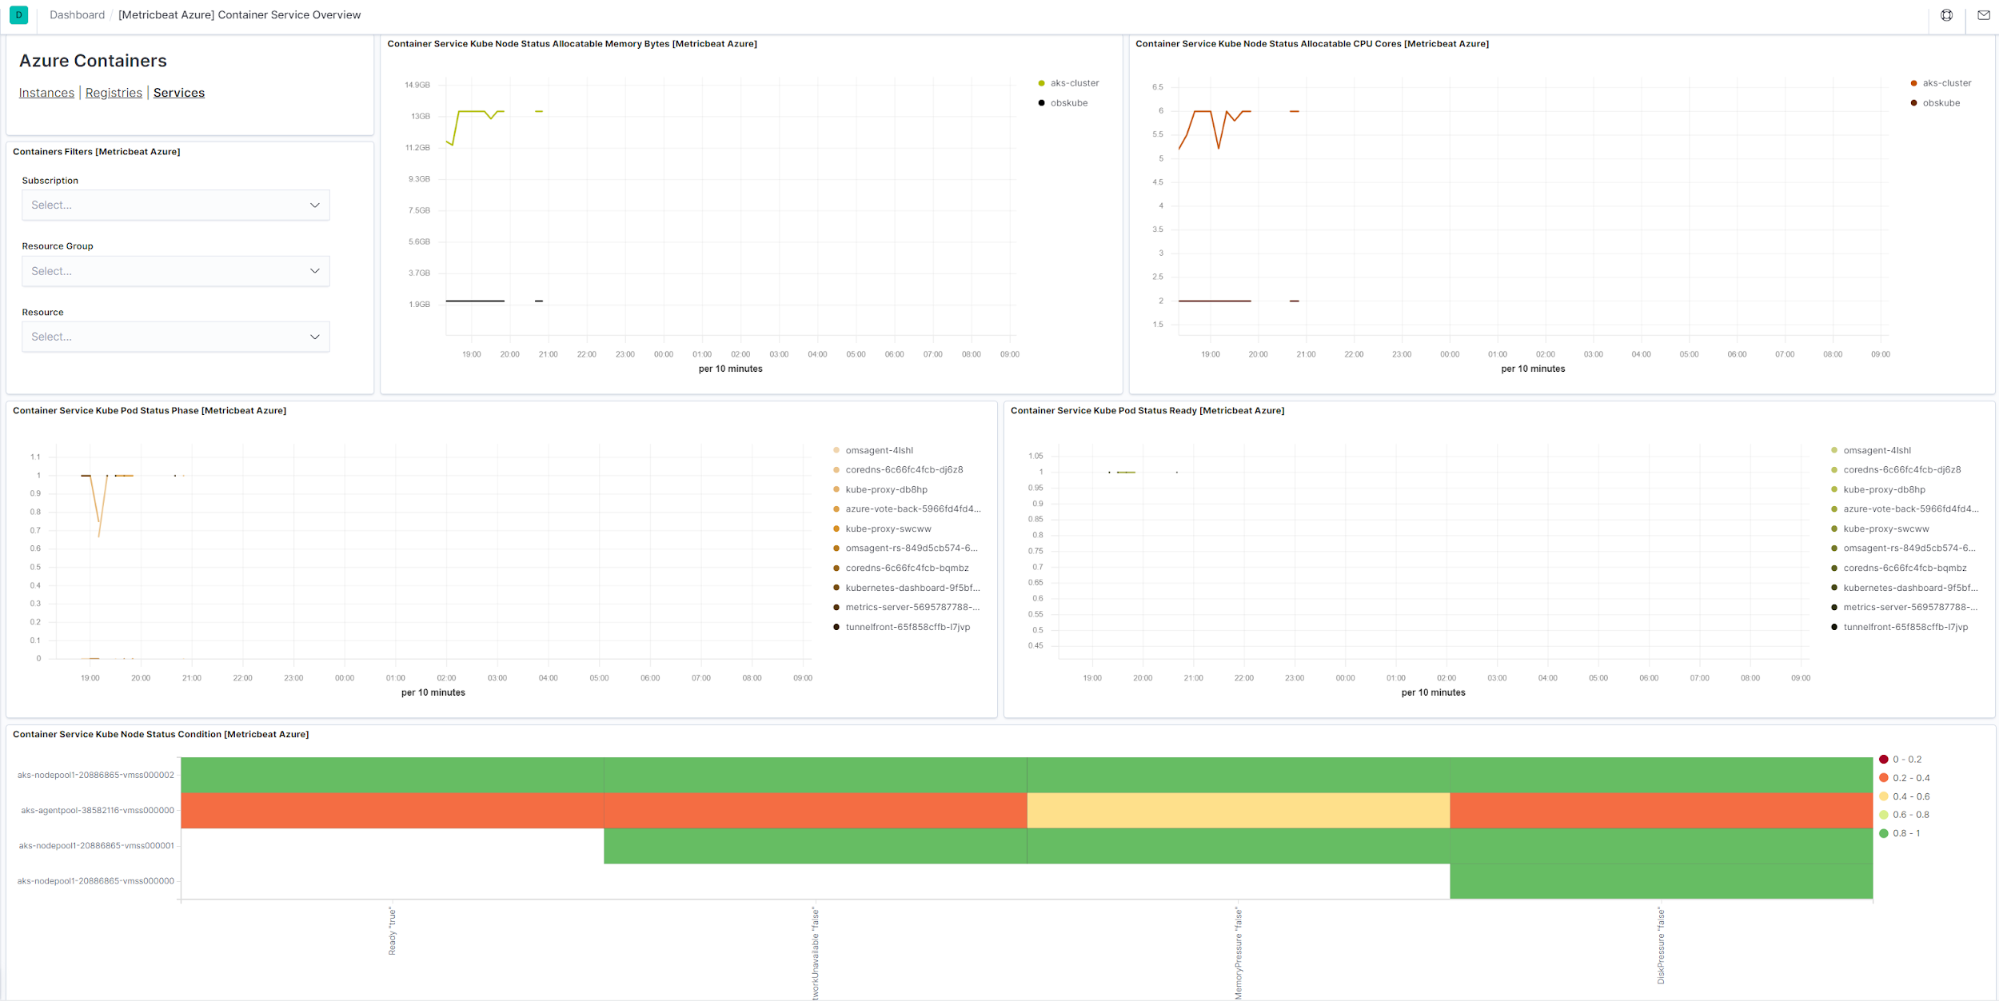
Azure Kubernetes and container monitoring
Microsoft Azure provides several services for container management and orchestration.
- Azure Kubernetes Service provides fully managed Kubernetes as a service.
- Azure Container Instances provides a more direct way of running serverless Docker containers without orchestration.
- Azure Container Registry is a registry for Docker and/or OCI container images.
In 7.7 we’ve added support for monitoring these container services with Metricbeat. Three new metricsets — container_instance, container_registry and container_service — collect all metrics for the above-mentioned services and make them available in Elasticsearch for alerting, correlation with other metrics, or simply visualizing container performance characteristics. Each metricset comes with a dashboard which makes it easy to get started with monitoring of Azure containers.
AWS VPCs, Lambdas, and DynamoDB monitoring
Amazon VPC lets users provision a logically isolated slice of AWS Cloud where they can launch resources in a virtual network that they have full control over.
In this 7.7 release we’ve added support for monitoring main mission-critical services in the Amazon VPC ecosystem — NAT gateway, Transit gateway, and VPN tunnels:
- natgateway metricset allows users to monitor NAT gateway services. These metrics can help gain a better perspective on how web applications or services are performing.
- transitgateway metricset captures metrics that are sent to CloudWatch by VPC only when requests are flowing through the gateway.
- vpn metricset of aws module allows users to monitor VPN tunnels. VPN metric data is automatically sent to CloudWatch as it becomes available.
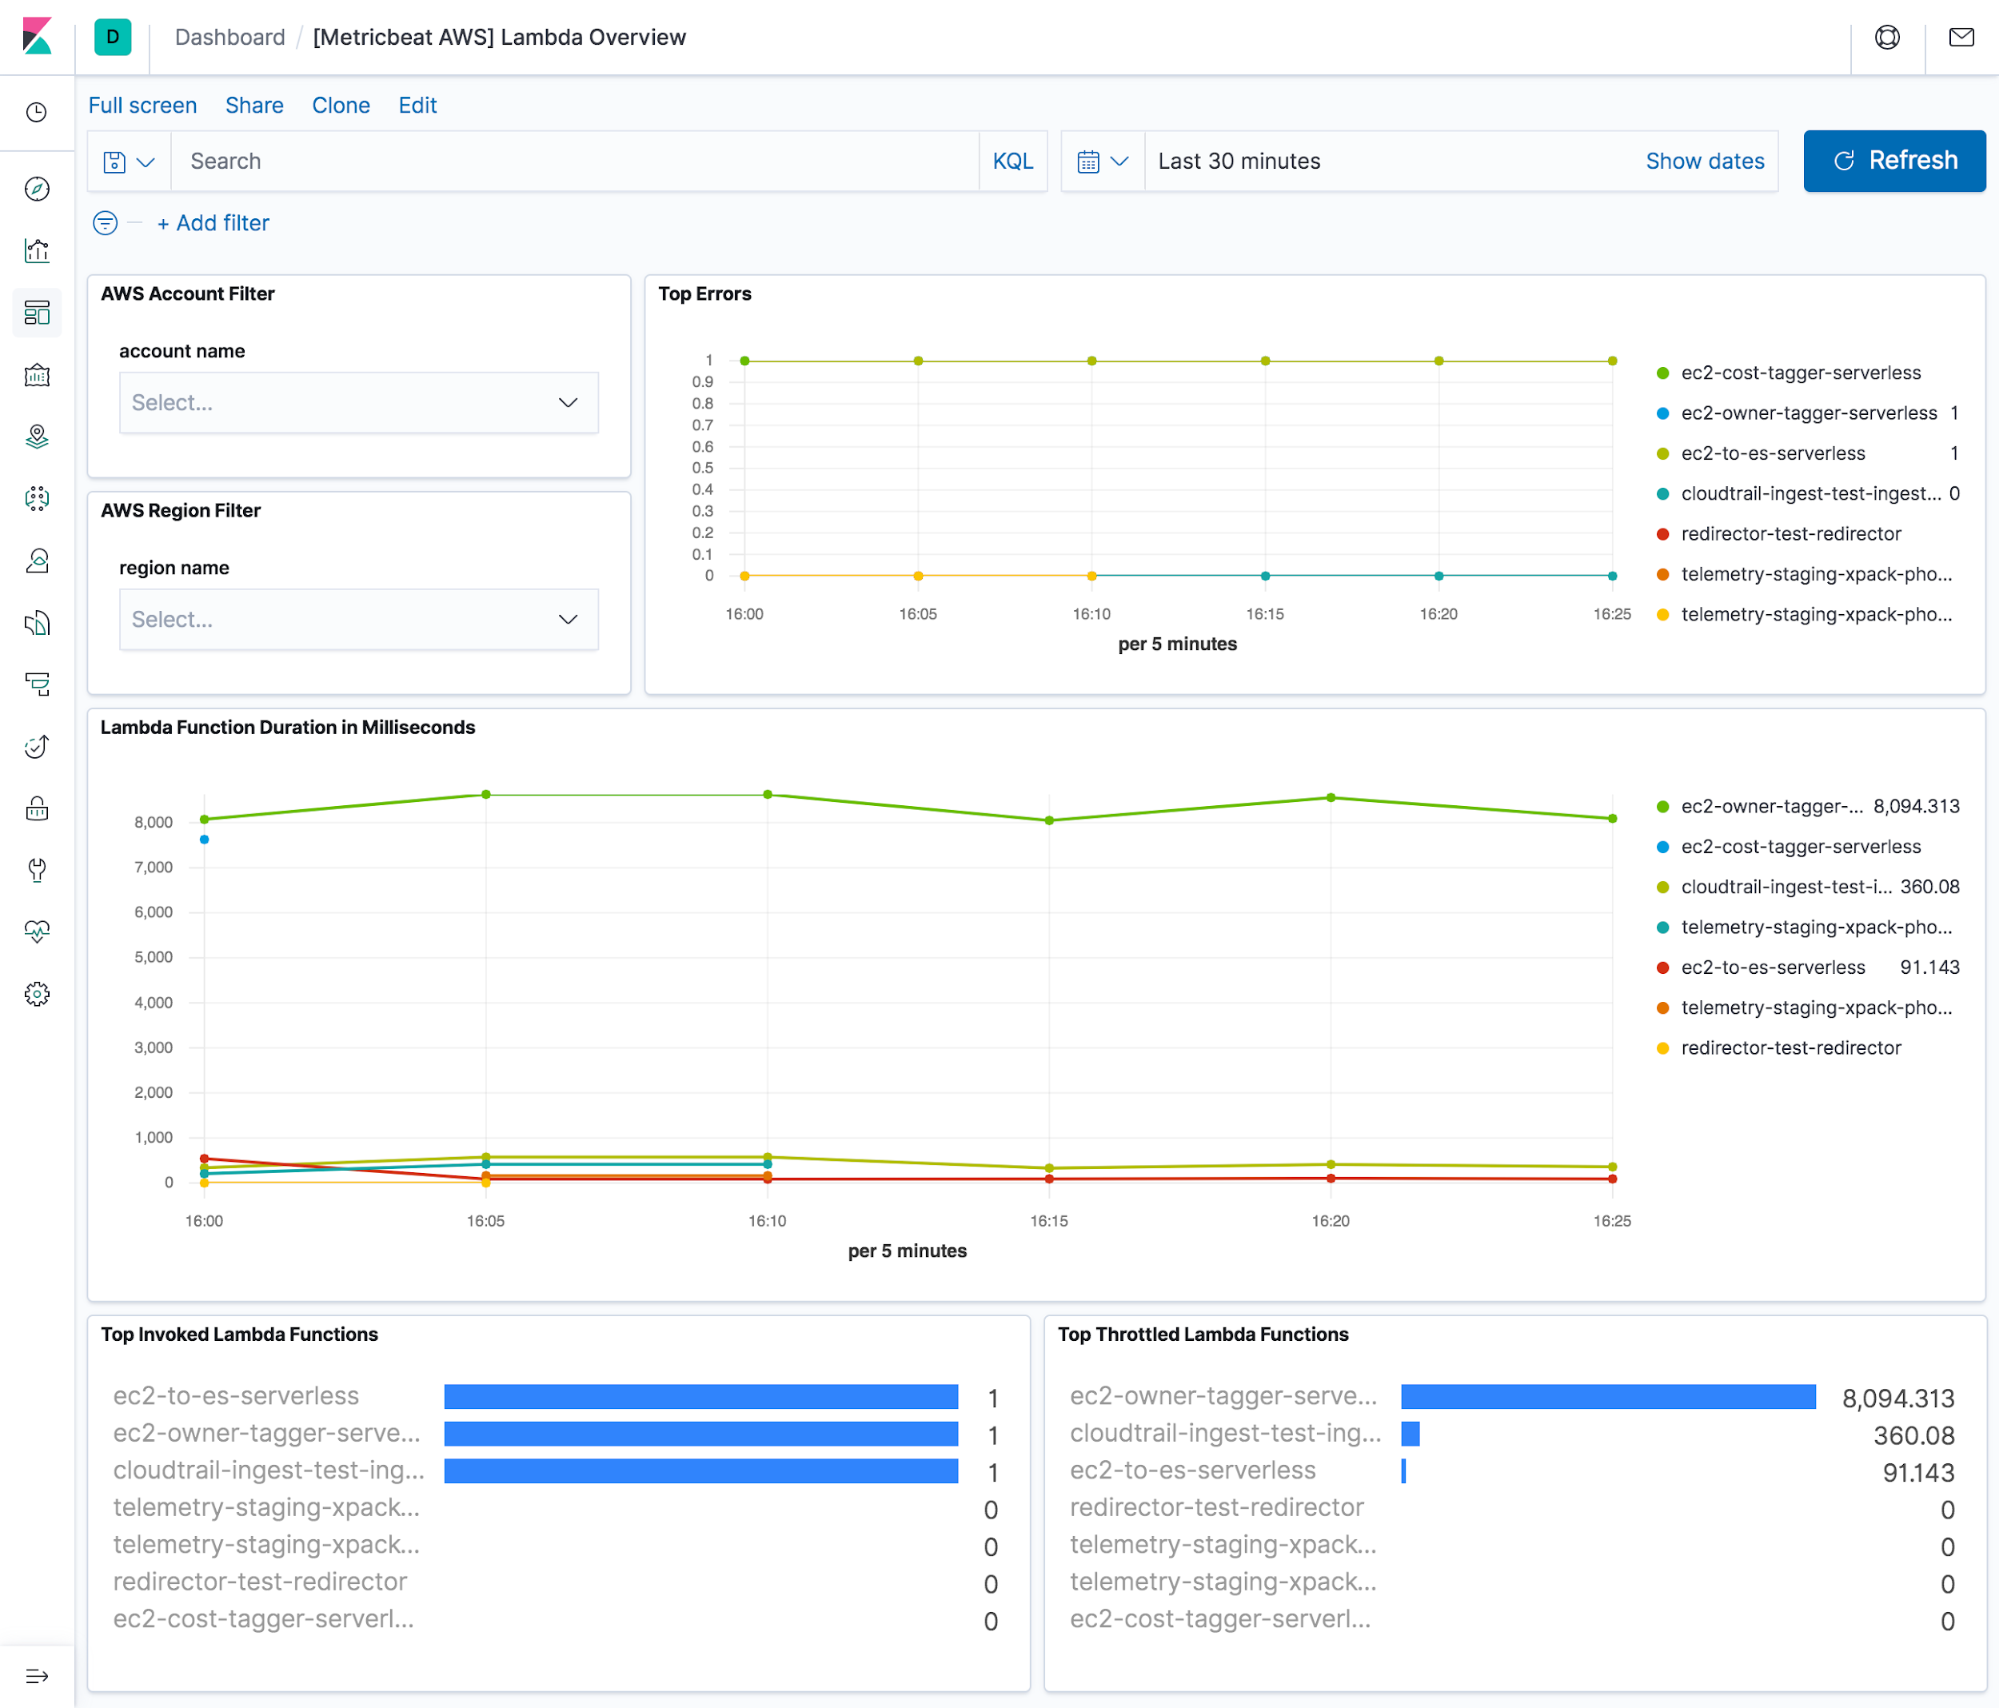
AWS Lambda is one of the most popular cloud services. It enables building serverless applications without the need to create and maintain an underlying infrastructure of resources, like servers, networks, etc. Lambdas are lightweight and are typically written to respond to any HTTP requests, process events from a queue, or simply run on a regular basis.
The new Lambda metricset monitors Lambda functions across multiple accounts and regions. These metrics include total invocations, errors, duration, throttles, dead-letter queue errors, and iterator age for stream-based invocations.
These metrics can be used to configure alerts to respond to things like changes in performance, error rates, or in combination with other alert conditions. Some of these metrics are already visualized on a dashboard which is provided out of the box in 7.7.
DynamoDB is a NoSQL database as a service managed by AWS. In 7.7 we’ve added the new dynamodb metricset to monitor DynamoDB instances. This metricset collects metrics like request latency, transaction conflicts, provisioned and consumed capacity, and many others.
If you’re using an SQL-based database on AWS, chances are that you’re using AWS Aurora. Aurora is a scalable and performant MySQL or PostgreSQL compatible database as a service. Starting from 7.7 the rds metricset in Metricbeat’s AWS module covers monitoring of your Aurora instances.
GCP Pub/Sub and Load Balancer monitoring
Pub/Sub is Google Cloud's messaging and event streaming platform. It's a popular service for many infrastructures running on GCP that provides, in essence, the ability to send a message to a topic where it is persisted, consume the message, and remove it after acknowledgment. Because Pub/Sub systems are such a central part of any distributed cloud architecture it is important to monitor their performance just like any parts of your stack.
The Load Balancing service in Google Cloud is another foundational component of any scalable architecture as it allows you to simplify your deployments and build highly scalable applications that can handle hundreds of thousands requests per second.
In this release we’ve added support for these services in our Google Cloud integration.
- pubsub metricset connects to the Stackdriver API and collects metrics for topics, subscriptions and snapshots used by a specified account.
- loadbalancer metricset captures load balancing performance metrics for HTTP(S), TCP and UDP applications.
PCF monitoring
In this release we’re continuing to expand our coverage of container platforms. This time we’ve added support for Pivotal Cloud Foundry platform. The new cloudfoundry Metricbeat module connects to the Cloud Foundry API and pulls container, counter, and value metrics from it. These metrics are stored in cloudfoundry.container, cloudfoundry.counter and cloudfoundry.value metricsets, respectively.
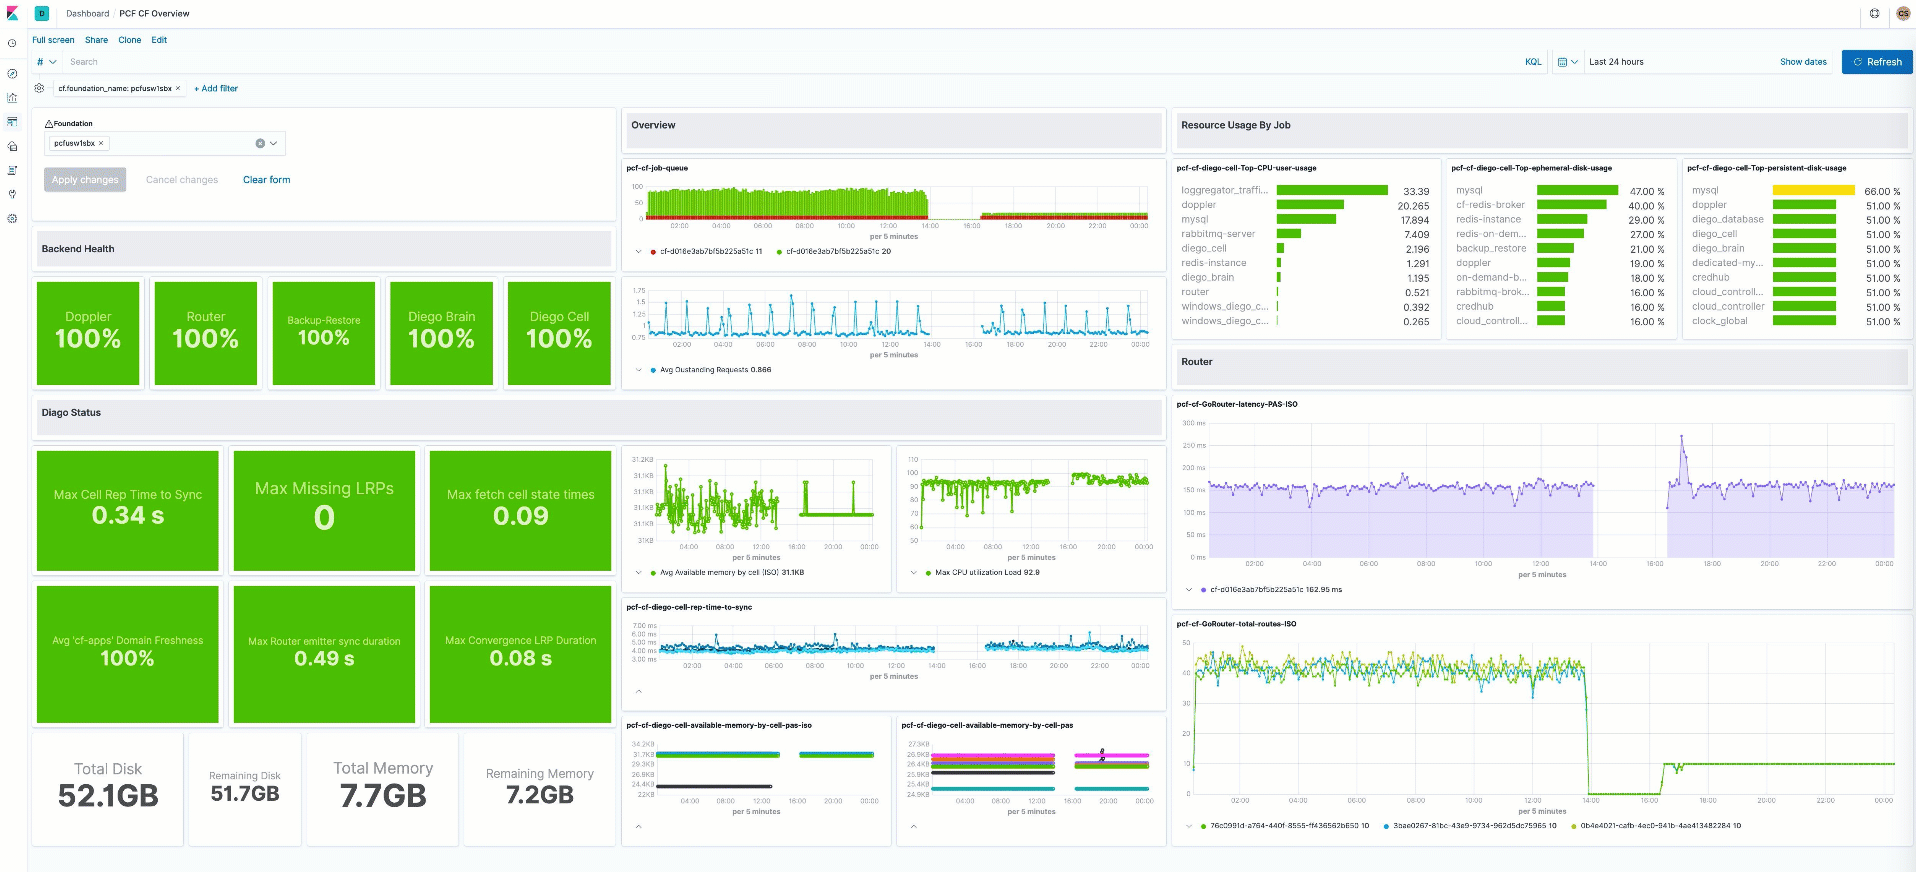
To learn more about how to monitor PCF with Elastic check out our Logs release blog.
IBM MQ monitoring
IBM MQ is a family of messaging and queuing middleware products. Previously we added support for collecting and parsing the queue manager error logs from IBM MQ in Filebeat.
In this release we’ve added the missing piece: metrics. The new Metricbeat module for IBM MQ pulls status information for the Queue Manager which is responsible for maintaining the queues and ensuring that the messages in the queues reach their destination.
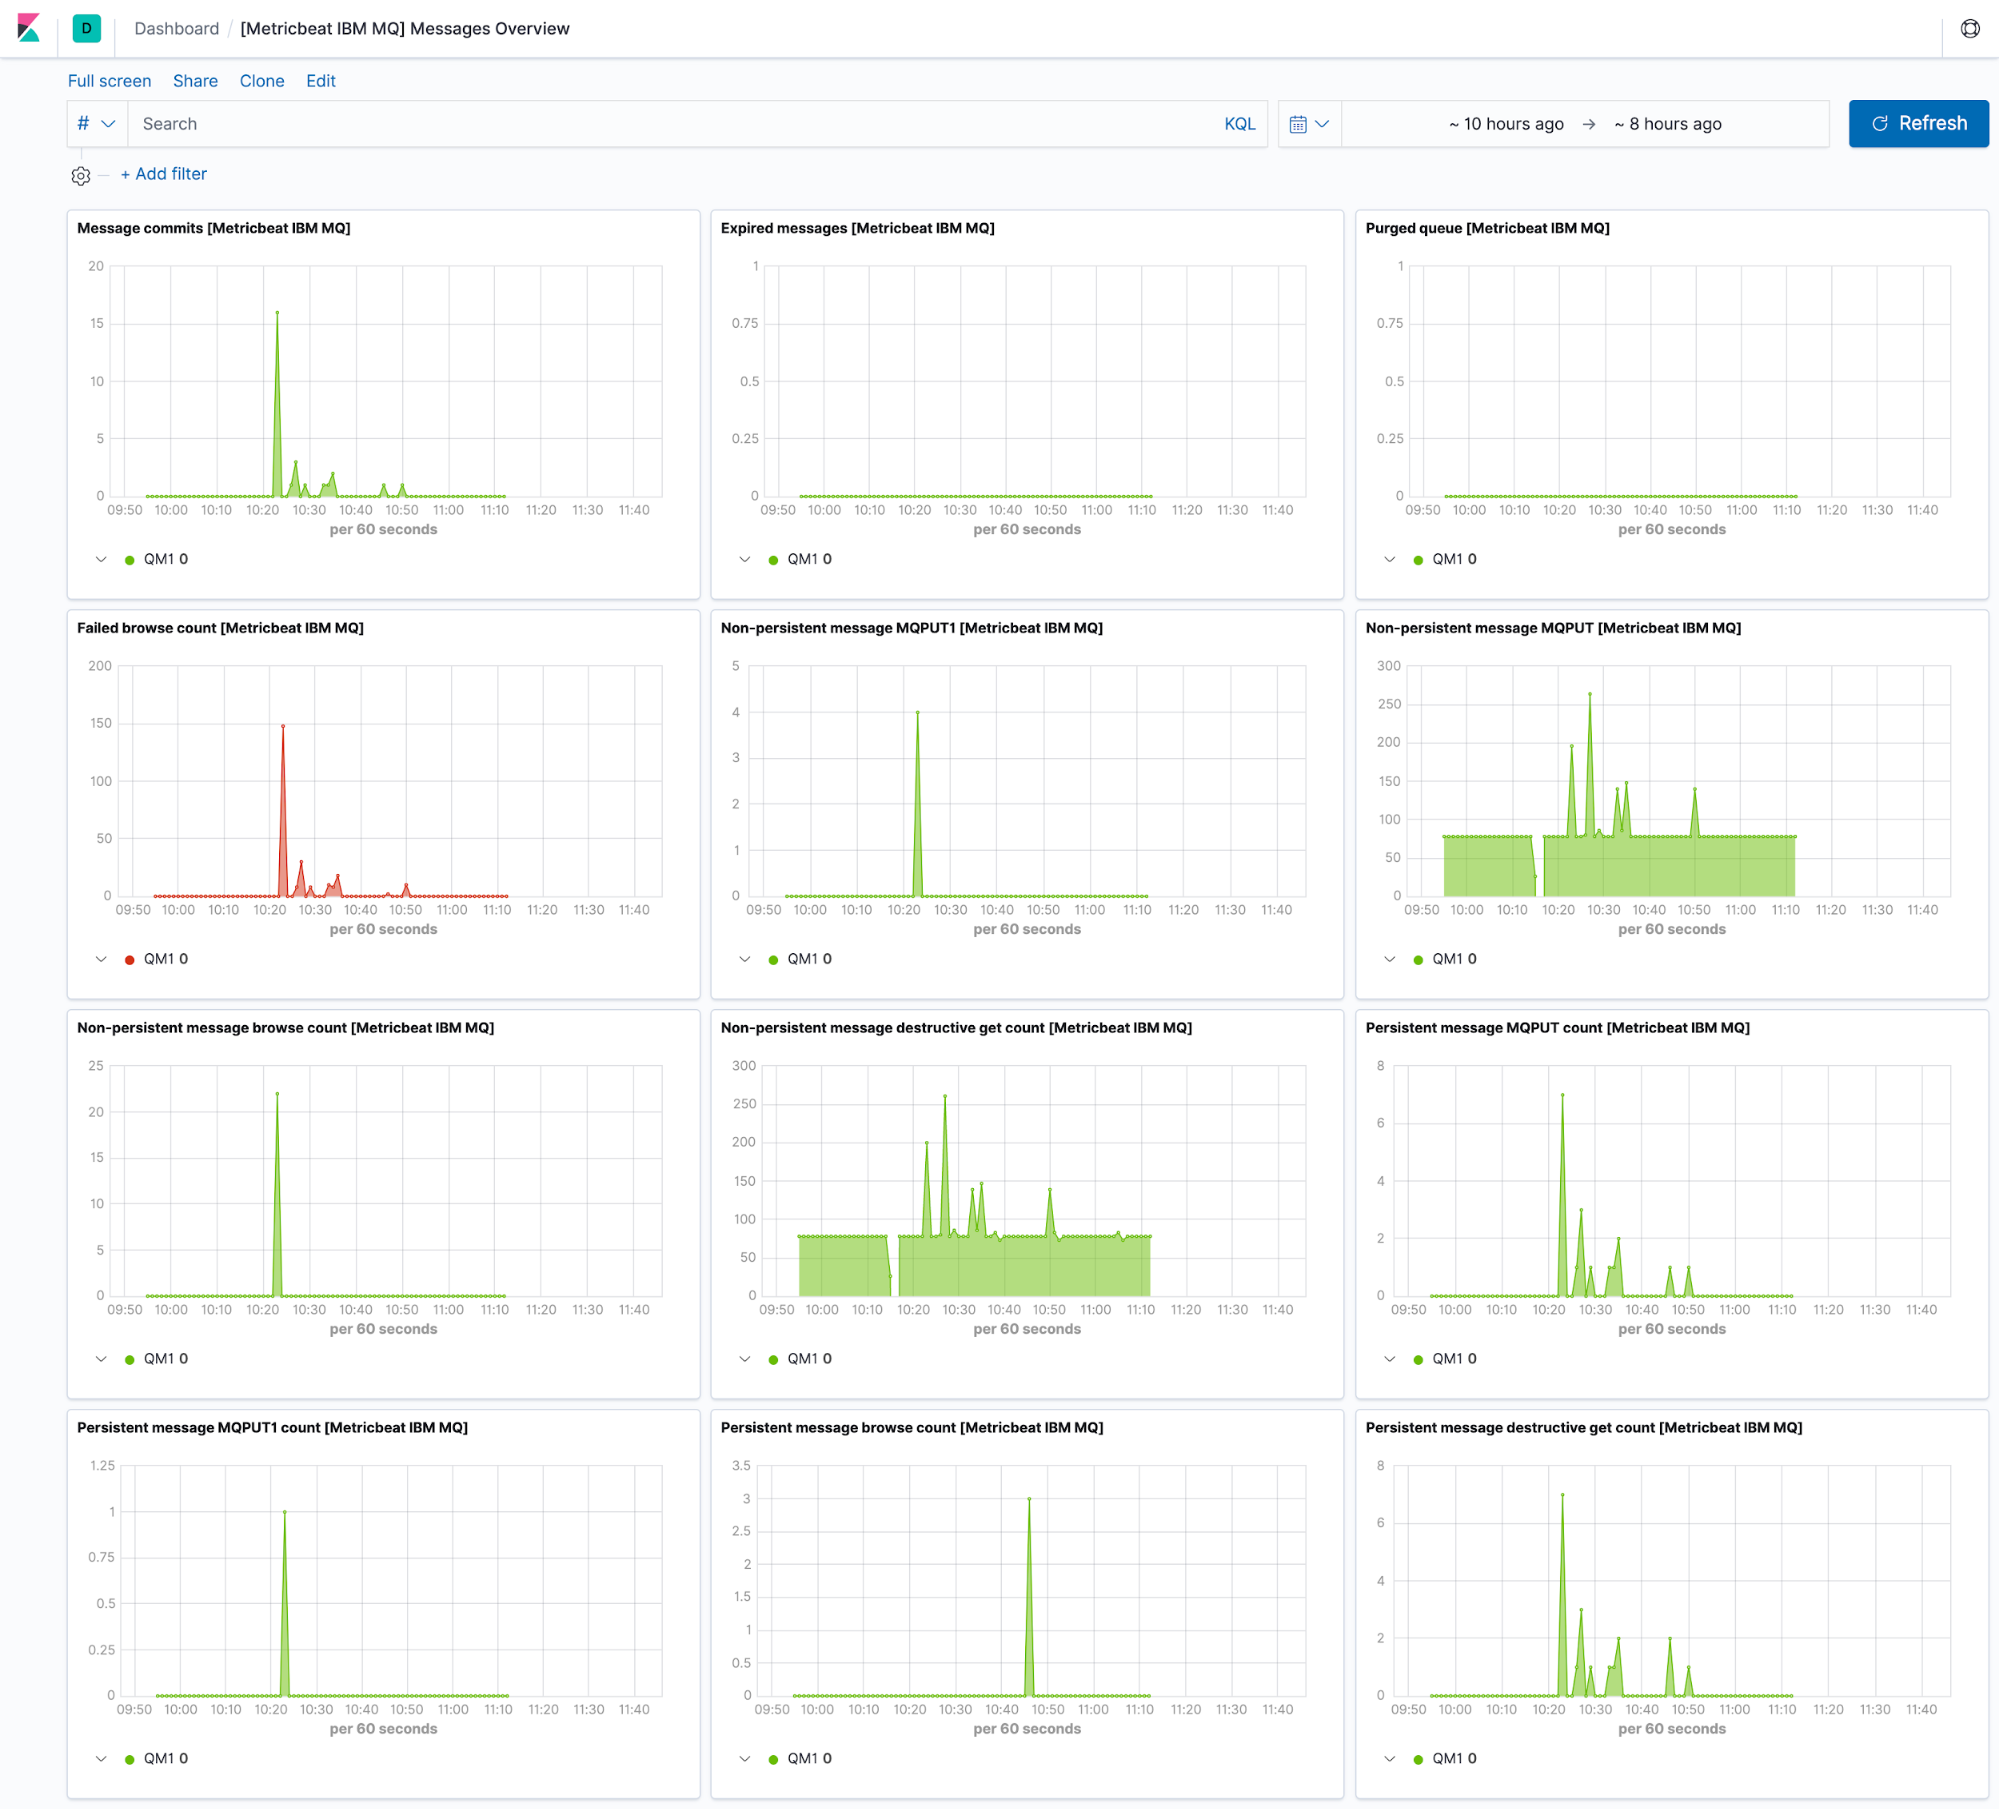
Note that the module is compatible with a containerized distribution of IBM MQ (version 9.1.0 and above).
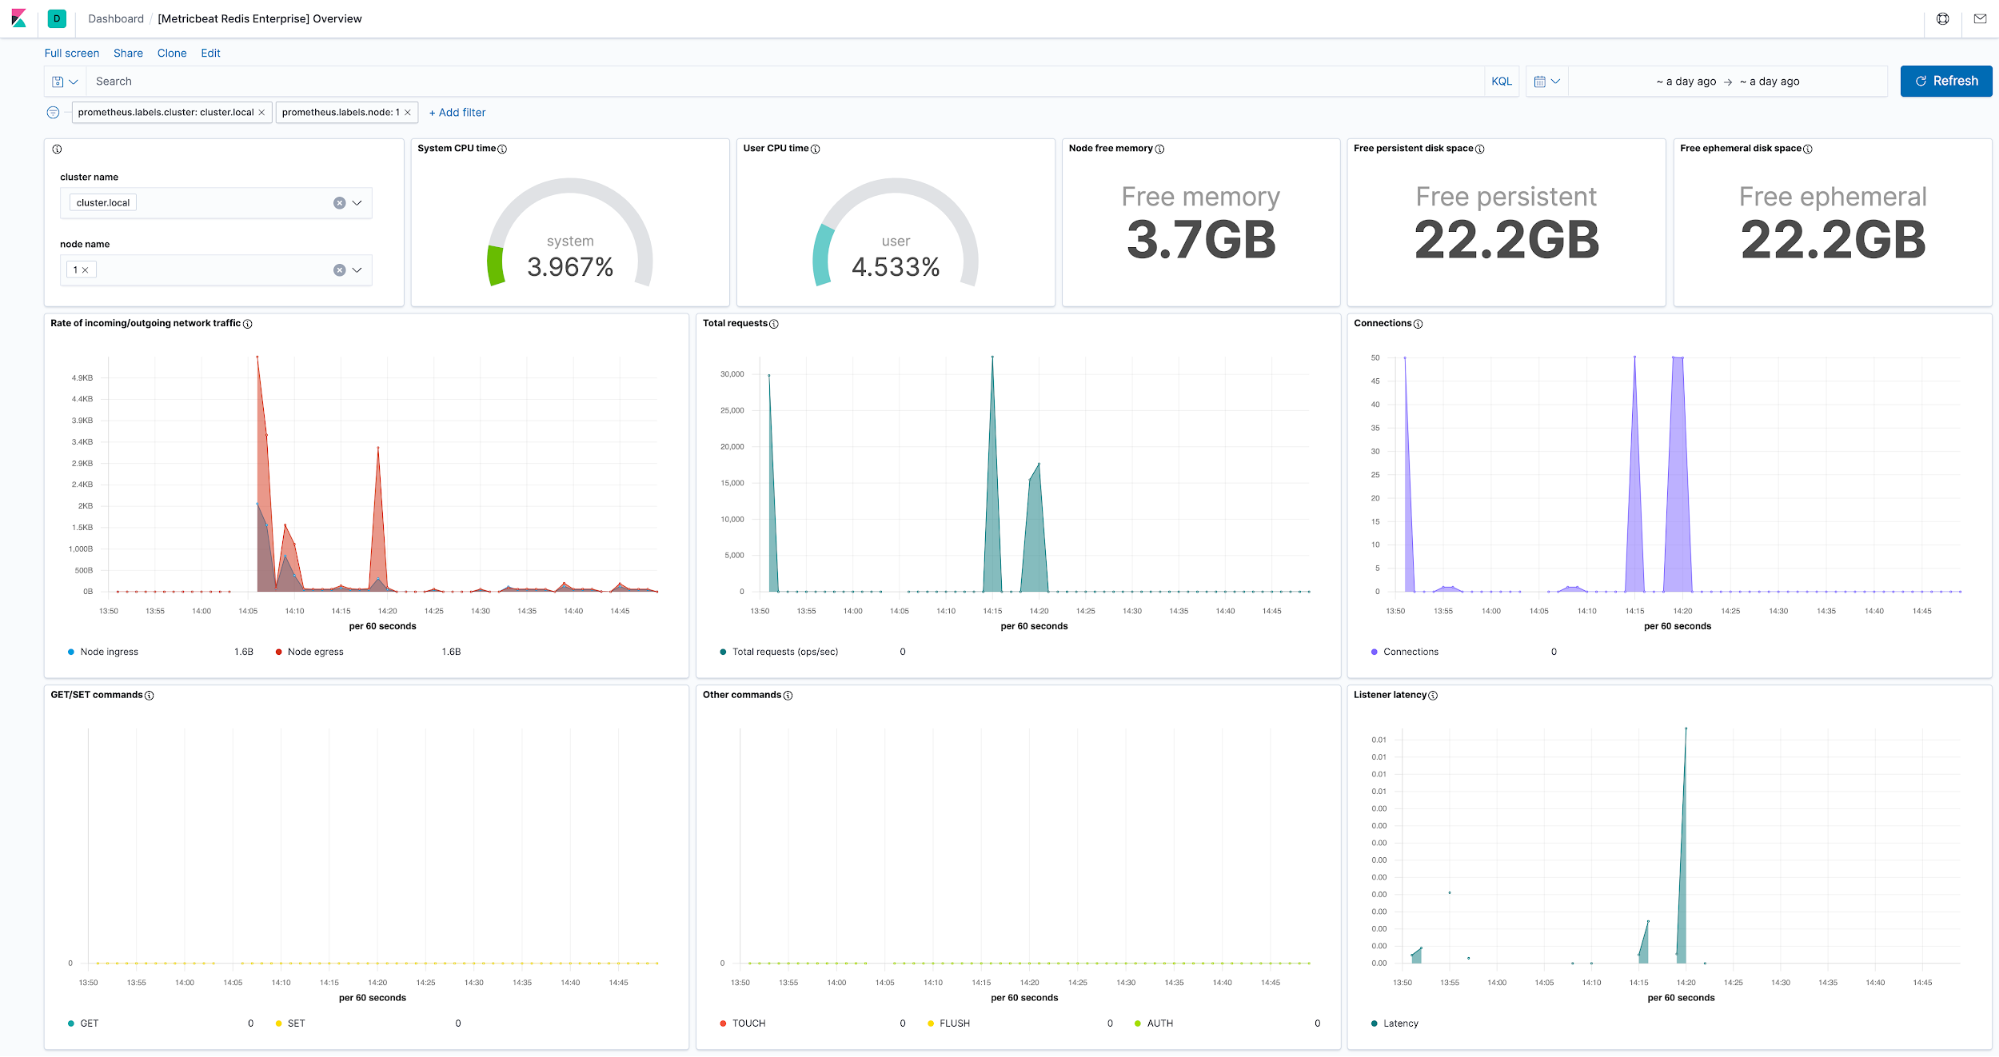
Redis Enterprise monitoring
Redis Enterprise is an enterprise version of the popular Redis database. It adds many enterprise-grade features such as linear scale to hundreds of millions of operations per second, Active-Active global distribution with local latency, and more. This enterprise version of Redis uses nodes and proxies that expose additional sets of metrics. In addition to our existing Redis integration that focuses on the open source version of the database, we’ve added the new Redis Enterprise integration to cover monitoring of the addition feature such as nodes and proxies in a Redis cluster.
Istio monitoring
Istio is an open source service mesh that provides the fundamentals required to successfully run a distributed microservice architecture. In 7.7 we introduced the new Istio integration that allows users to see metrics for service traffic (in, out, and within a service mesh), control-plane metrics for Istio’s Pilot, Galley, Mixer components, and much more. A complete list of available metrics is available here.
Custom metrics for infrastructure views
Inventory maps provide a simple, yet powerful bird-eye view over your entire infrastructure resources such as hosts, VMs, containers or services. All these different maps in your Inventory expose a hardcoded list of the most relevant metrics for the given resource type. While this works well for the majority of cases, it proved to be an unnecessary limitation in some, where visualizing a custom metric for each resource makes more sense.
In 7.7 we’ve added the option to define and visualize custom metrics on an inventory map. A picture is worth a thousand words, so here’s how it looks like in action:
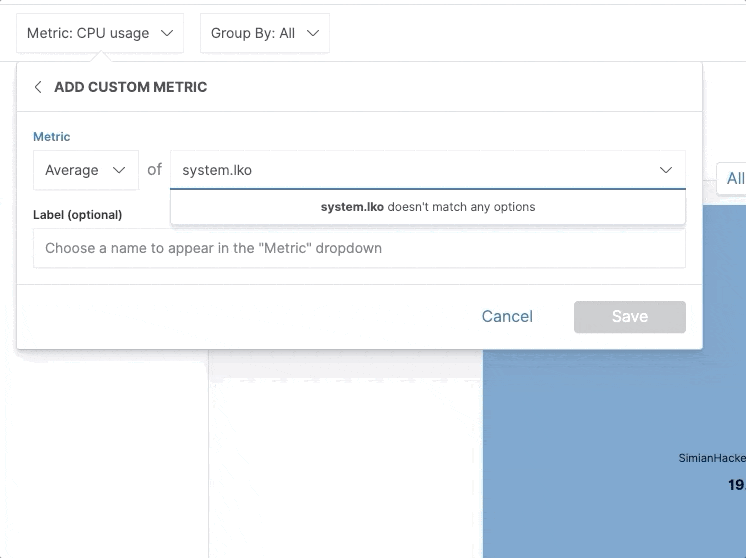
Note, all custom metrics defined this way are ad hoc and can be persisted in custom inventory views.
Make it yours
You access the latest version of the Elastic Metrics app on the Elasticsearch Service on Elastic Cloud by creating a new cluster, or upgrading an existing cluster the day of release, or you can download the Elastic Stack.