Importing 4 billion chess games with speed and scale using Elasticsearch and Universal Profiling


 Share on Twitter
Share on Twitter

 Share on LinkedIn
Share on LinkedIn

 Share on Facebook
Share on Facebook

 Share by Email
Share by Email

 Print this page
Print
This is the first blog post in a series of ones to follow. Chess is a fascinating game. What can happen on those 64 squares can be a disastrous adventure or a wonderful experience. Lichess is a platform that allows you to play chess; luckily for us, it publishes all rated games as archives, starting in 2013. There are a total of over 4 billion games played. Yes, 4 billion matches.
Ingesting 4 billion documents is something that the Elastic Stack can handle easily. However, my custom Python implementation to extract and ship those documents out of Lichess faced severe performance problems. We will use Elastic APM and Universal Profiling to solve those performance problems in my custom Python application.
Let me start by saying that Elastic is an incredibly collaborative workplace. Multiple people from different teams helped me in this situation, and I am very grateful for their help.
PGN: The portable game notation
How is a chess game recorded? The standard is a so-called PGN (portable game notation) format. This is the very first game from Lichess’s archive.
[Event "Rated Classical game"]
[Site "https://lichess.org/j1dkb5dw"]
[White "BFG9k"]
[Black "mamalak"]
[Result "1-0"]
[UTCDate "2012.12.31"]
[UTCTime "23:01:03"]
[WhiteElo "1639"]
[BlackElo "1403"]
[WhiteRatingDiff "+5"]
[BlackRatingDiff "-8"]
[ECO "C00"]
[Opening "French Defense: Normal Variation"]
[TimeControl "600+8"]
[Termination "Normal"]

1. e4 e6 2. d4 b6 3. a3 Bb7 4. Nc3 Nh6 5. Bxh6 gxh6 6. Be2 Qg5 7. Bg4 h5 8. Nf3 Qg6 9. Nh4 Qg5 10. Bxh5 Qxh4 11. Qf3 Kd8 12. Qxf7 Nc6 13. Qe8# 1-0We see a set of headers and turns written in algebraic notation.
What is the goal? I want to get a document for each game looking like this:
{
 "termination": "normal",
 "timecontrol": "180+0",
 "opening": {
   "eco": "C41",
   "name": "Philidor Defense #3"
 },
 "url": {
   "path": "/PNu4tLEV",
   "original": "https://lichess.org/PNu4tLEV",
   "scheme": "https",
   "domain": "lichess.org"
 },
 "result": {
   "white": true,
   "black": null,
   "draw": null,
   "outcome": "1-0"
 },
 "@timestamp": "2014-10-11T00:39:57.000+00:00",
 "data_stream": {
   "namespace": "default",
   "type": "summary",
   "dataset": "chess-games"
 },
 "moves": {
   "original": "1. e4 e5 2. Nf3 d6 3. Bc4 h6 4. d3 Nf6 5. Nc3 Be7 6. Nd5 O-O 7. Nxe7+ Qxe7 8. Be3 c6 9. Qd2 b5 10. Bb3 Ng4 11. h3 Nxe3 12. fxe3 Kh8 13. O-O-O f5 14. g3 fxe4 15. dxe4 Bb7 16. Qxd6 Qxd6 17. Rxd6 Na6 18. Nxe5 Nc5 19. Ng6+ Kh7 20. Nxf8+ Rxf8 21. Rhd1 Nxe4 22. Rd7 Bc8 23. Rxa7 Bxh3 24. Rf7 Re8 25. Rh1 Bg4 26. Rh4 Nf2 27. Kd2 Rd8+ 28. Ke1 Rd1+ 29. Kxf2 Rd2+ 30. Ke1 Re2+ 31. Kf1 Be6 1-0",
   "total_moves": 31,
   "clean": "1. e4 e5 2. Nf3 d6 3. Bc4 h6 4. d3 Nf6 5. Nc3 Be7 6. Nd5 O-O 7. Nxe7+ Qxe7 8. Be3 c6 9. Qd2 b5 10. Bb3 Ng4 11. h3 Nxe3 12. fxe3 Kh8 13. O-O-O f5 14. g3 fxe4 15. dxe4 Bb7 16. Qxd6 Qxd6 17. Rxd6 Na6 18. Nxe5 Nc5 19. Ng6+ Kh7 20. Nxf8+ Rxf8 21. Rhd1 Nxe4 22. Rd7 Bc8 23. Rxa7 Bxh3 24. Rf7 Re8 25. Rh1 Bg4 26. Rh4 Nf2 27. Kd2 Rd8+ 28. Ke1 Rd1+ 29. Kxf2 Rd2+ 30. Ke1 Re2+ 31. Kf1 Be6"
 },
 "name": "Rated Blitz game",
 "event": {
   "ingested": "2023-02-09T10:39:03.832082+00:00"
 },
 "user": {
   "white": {
     "name": "F52",
     "elo": 1505,
     "diff": 15
   },
   "black": {
     "name": "taka6s6",
     "elo": 1615,
     "diff": -15
   }
 },
 "db": "lichess",
 "game_id": "6609efeb4f9b1b300450cb51167ccfdbc602ff825e399278ea420da2089991de"
}Python-chess library and Python
Whenever I am challenged with a problem I cannot solve purely in the Elastic Stack using Agent, Beats, Logstash, Ingest pipelines within Elasticsearch, or any other ingestion method, I must rely on third-party tools. I end up going for something in Python. The Elasticsearch Python language client is compelling and has a ton of helpful helpers.
I searched around and found a library (python-chess) for Python that helps with parsing the PGNs. It lets you play through the entire game and extract each move individually.
So I threw together a script, added a simple open(file) at the beginning, and read through the file using the read_game.
def read_games(file):
    with open(file) as f:
        while True:
            game = chess.pgn.read_game(f)
            if game is None:
                break
            docs = extract_info(game)
yield docsThis read_games is called by helper.bulk. After a few minutes of letting it run, I immediately discovered that it wouldn’t work on this scale.
It was slow — 1,000 games per average of 4 seconds. The December 2022 archive has a whopping 90 million games. Parsing 4 billion games, when limited to 15,000 games per minute, takes 185 days.
I needed to understand what was slow and why. I used the same approach from my Strava APM blog to identify what was slowing me down. Is it the uploading to ES? Is it the extract_info? I am generating a document for every move played.
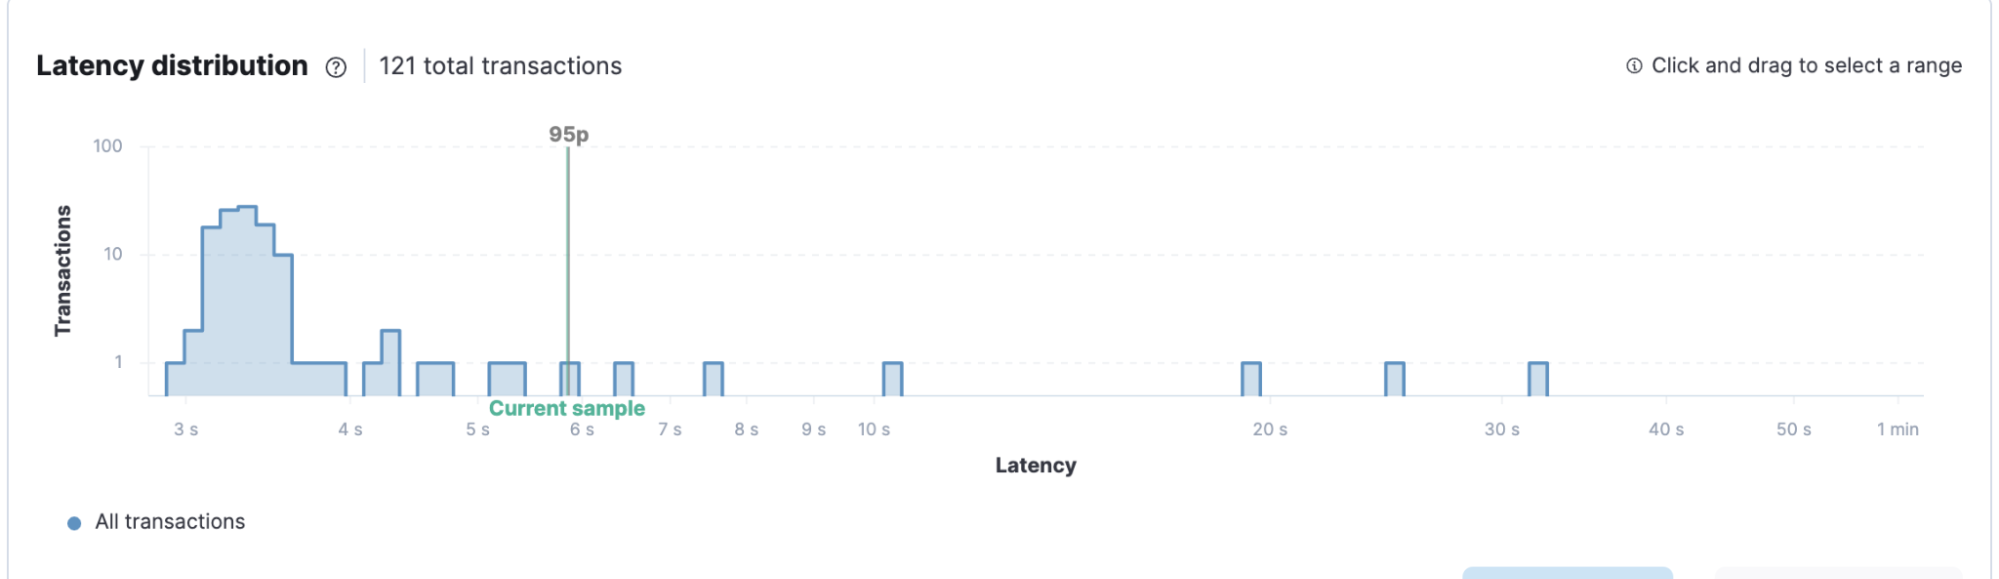
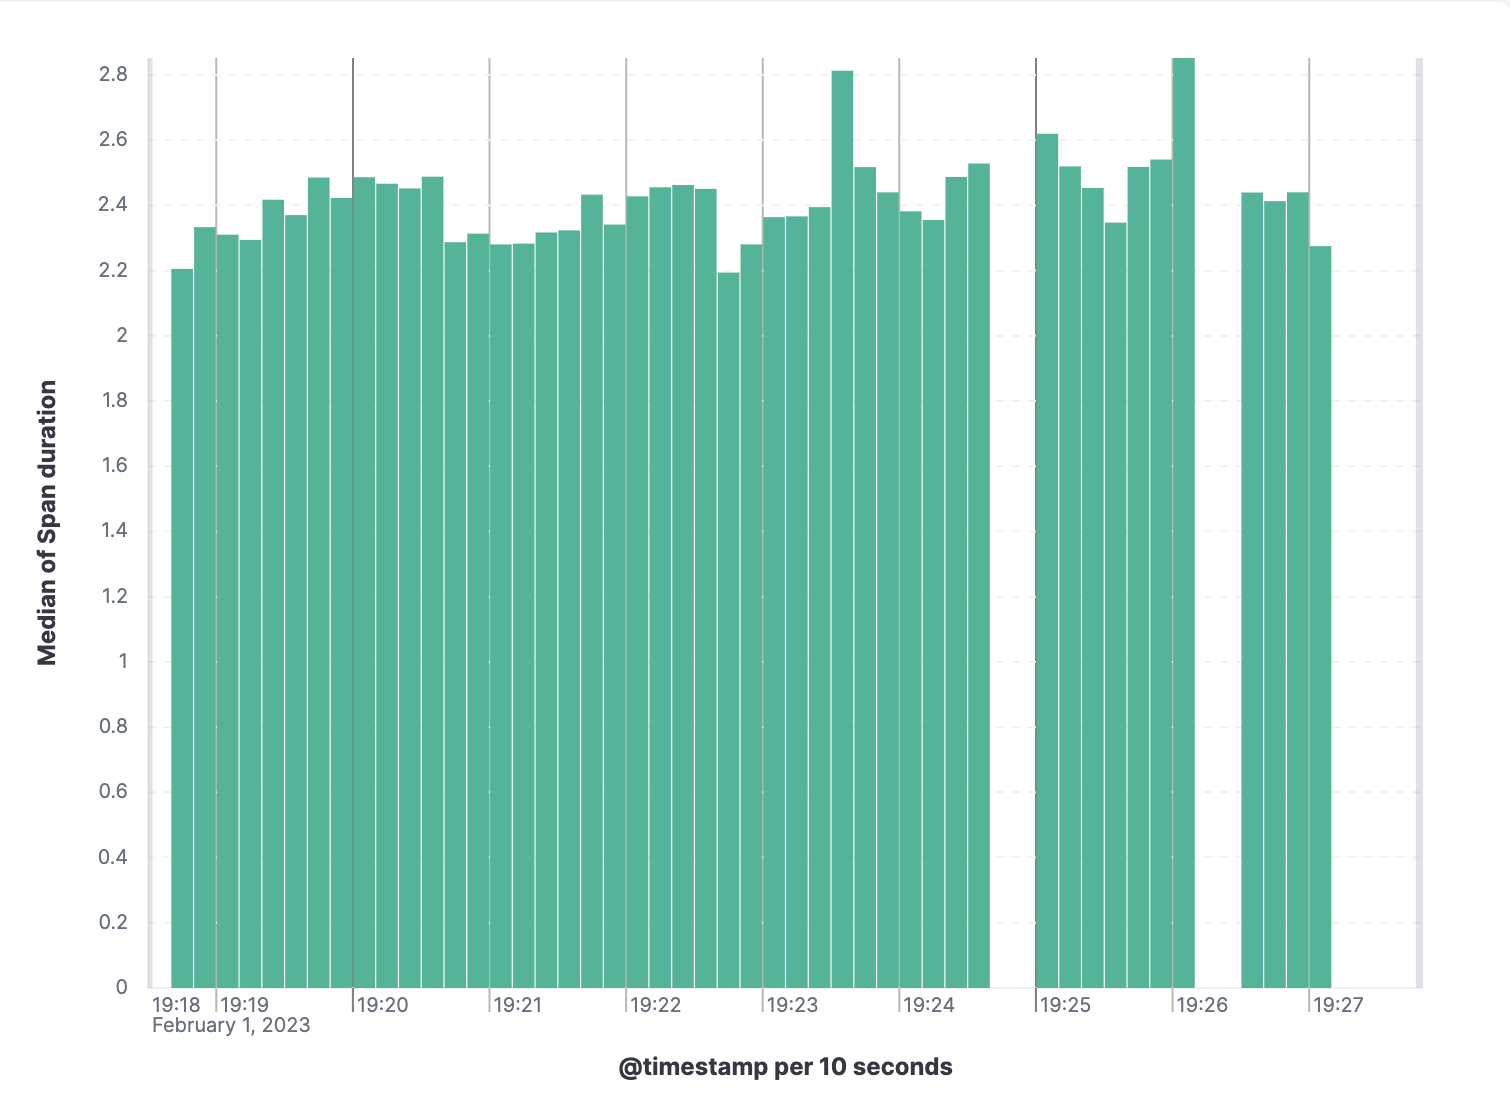
The transactions are for 1,000 games each. We can see that most of them are done in the 3–4 second range. Looking at the spans, where one span represents a game, we see a distribution in each game's 2–4 ms range.
What is now actually slow? Is it my implementation, or am I doing something wrong? Calling expensive functions? Going down that rabbit hole, I ended up profiling it using the Universal ProfilingTM from our profiling team.
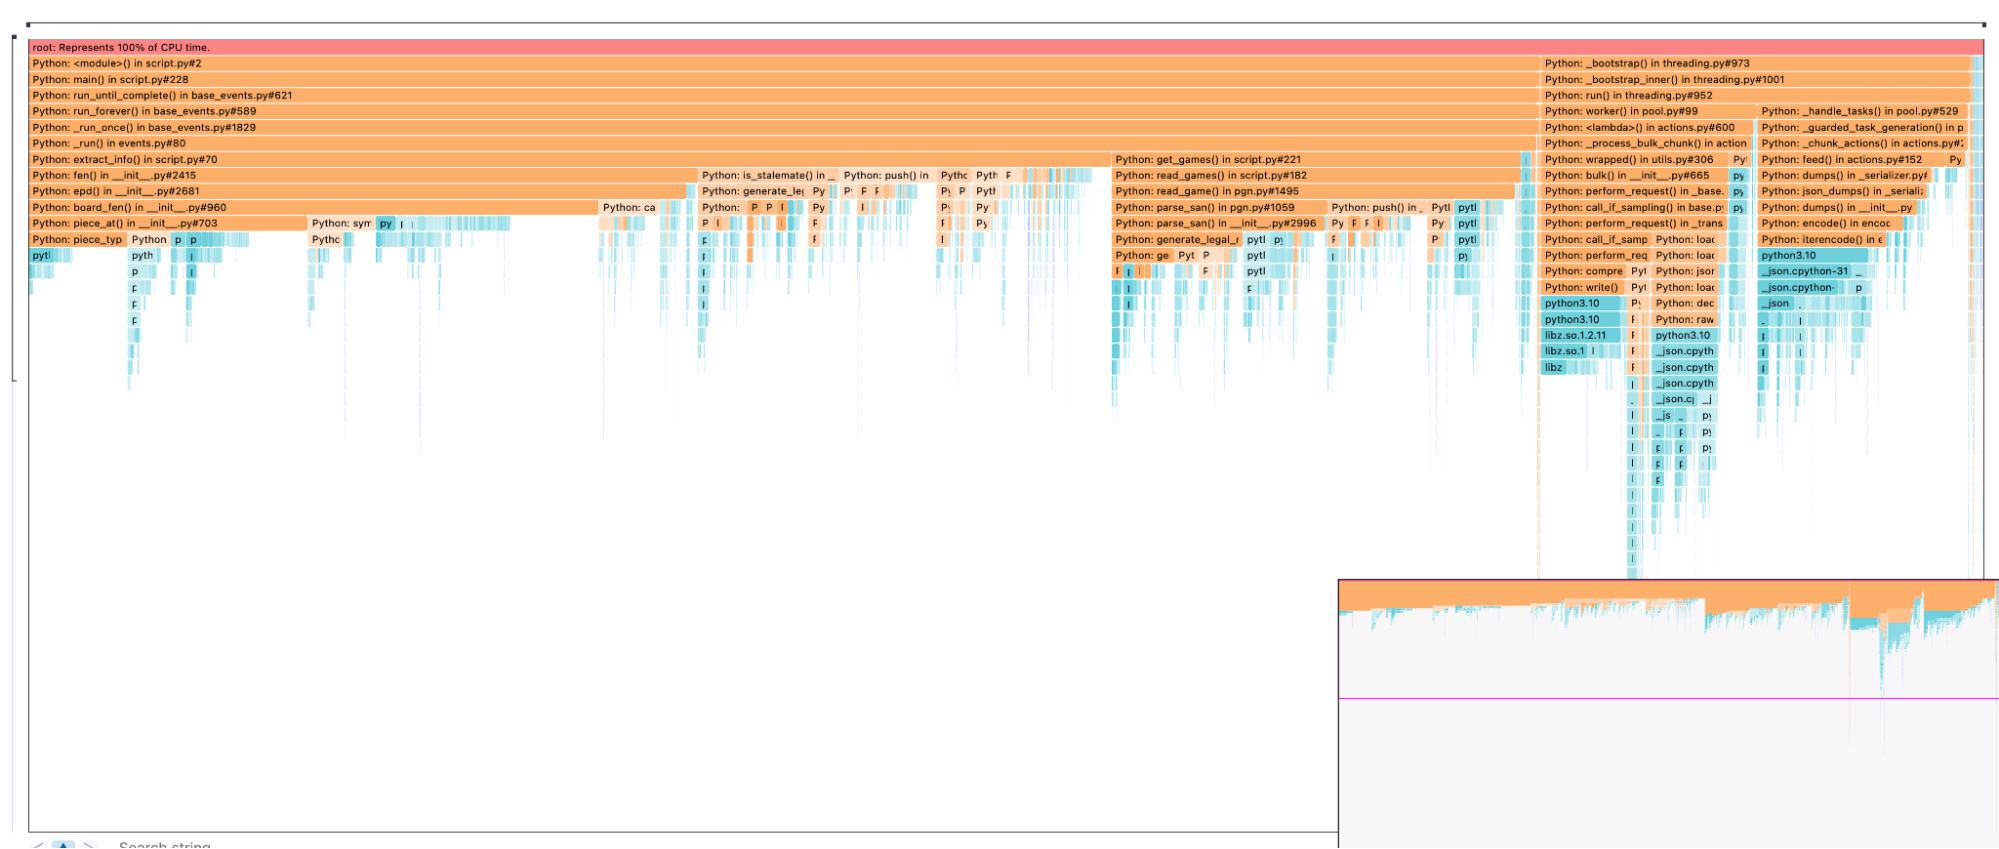
That is interesting. Interpreting a flame graph can be pretty daunting, but it’s easier than it looks. First of all, let’s check the color coding. We have orange and blue bars. The orange represents the Python calls, while the blue calls are system-related. Anything blue is not simply editable by me. The second look should be the width of the bars. In the beginning, we can see that our script is split into two “parts,” one on the left and one on the right. The right one is our helpers.parallel_bulk. We see that the entire indexation takes away roughly 30%.
Now let’s look at the left part covering approximately 70%. Whenever you see multiple bars underneath each other, it is important to note how much they occupy from the parent's bar width.
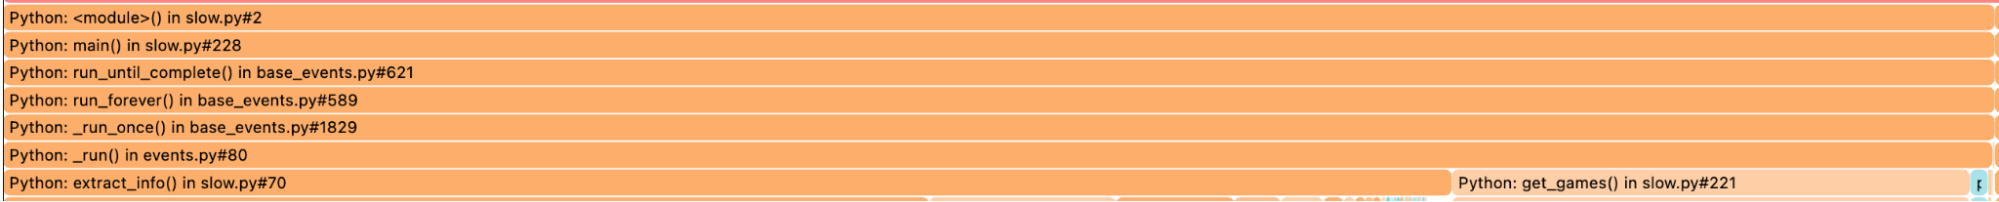
Take this picture as an example. The bars all have nearly the same width. If you are looking for optimizations, there is little to be optimized. Interesting is the first time it is split — in my case, the get_games and extract_info functions.
The next clue you want to look for is the depth of this. How many more bars are there before they turn blue? Remember, we cannot optimize the blue bars. We could, but that would mean rewriting internal Python libraries. To understand where the blue bars spend their time, we must symbolize them. This allows us to identify inefficient data structures and the like. We won’t cover it in this blog post.
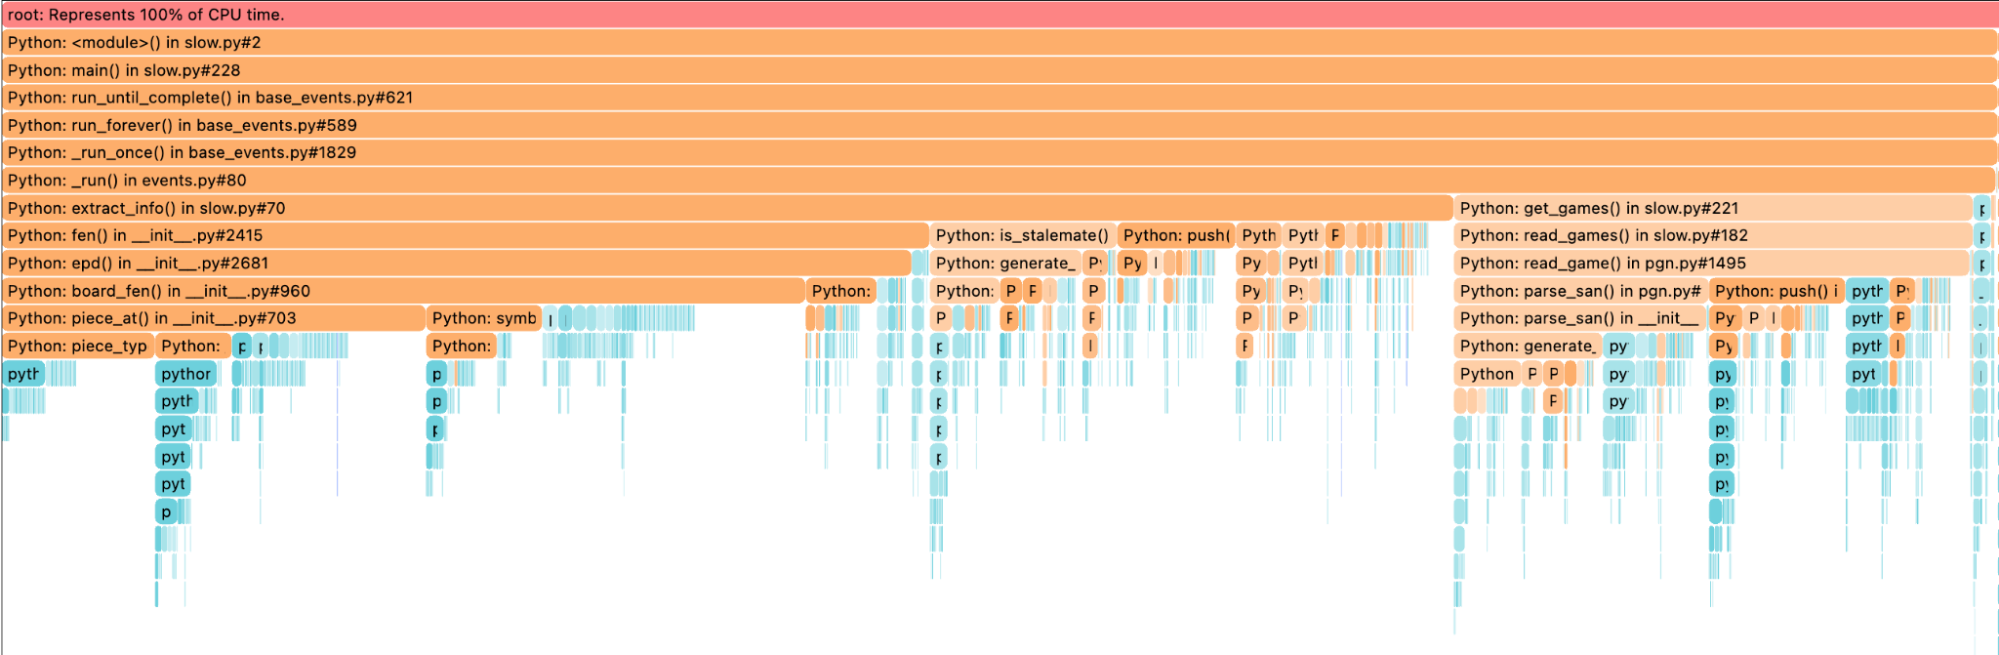
The depth (amount of bars underneath the parent) of get_games is bigger than the one for extract_info. We see again that get_games has multiple sub-function calls that are equally fast. When we reach the read_game function from the python-chess library, indicated by the pgn.py, it is split into various parts to analyze. Let’s dive in.
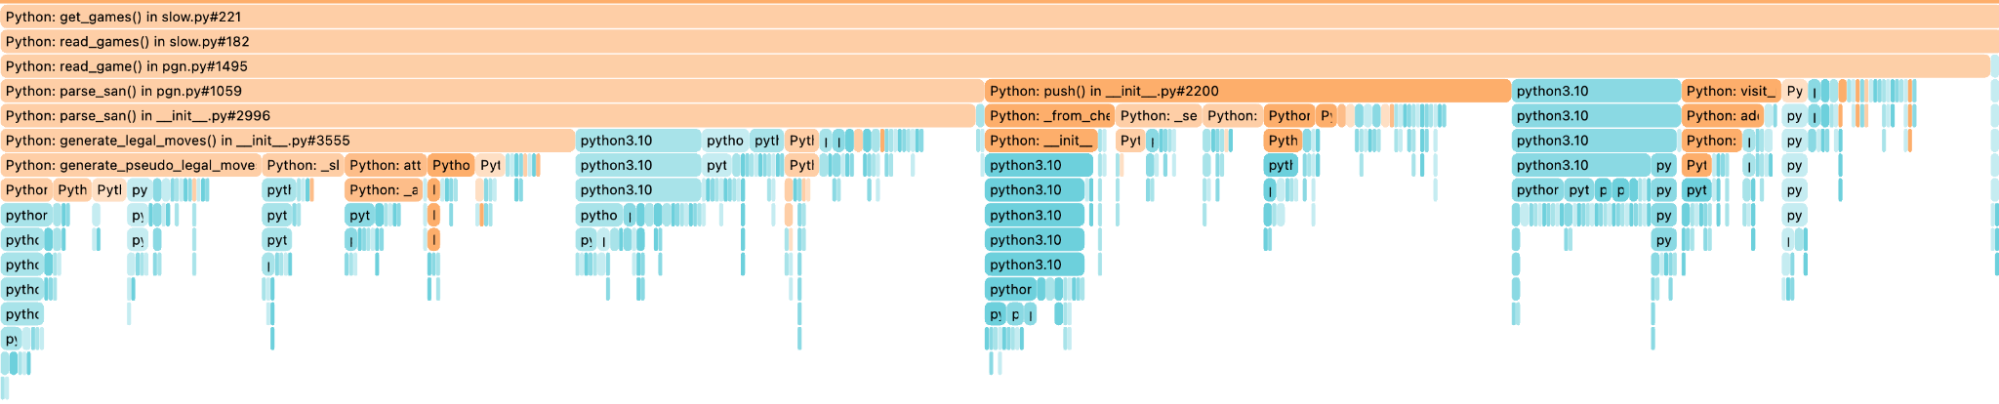
We see that the mistakenly thought simple call chess.pgn.read_game(f) is quite expensive. Again we are using the same principle, depth over breadth. The read_game => parse_san=>parse_san=>generate_legal_moves. Since all of that comes from the python-chess library, I need to optimize the library myself.
Using the library to read the games from the file is not the most efficient way. Changing how we read the game might be an easy win since I don’t need any game validation if the moves played are legal moves. Lichess will and hopefully has taken care of this when creating the PGNs. I could end up gaining 20% CPU time. I will explain CPU% in more detail later because it’s pretty tricky to grasp.
Ok, we identified two things. My script is spending time while indexing and when reading games. What about the very first bar extract_info?
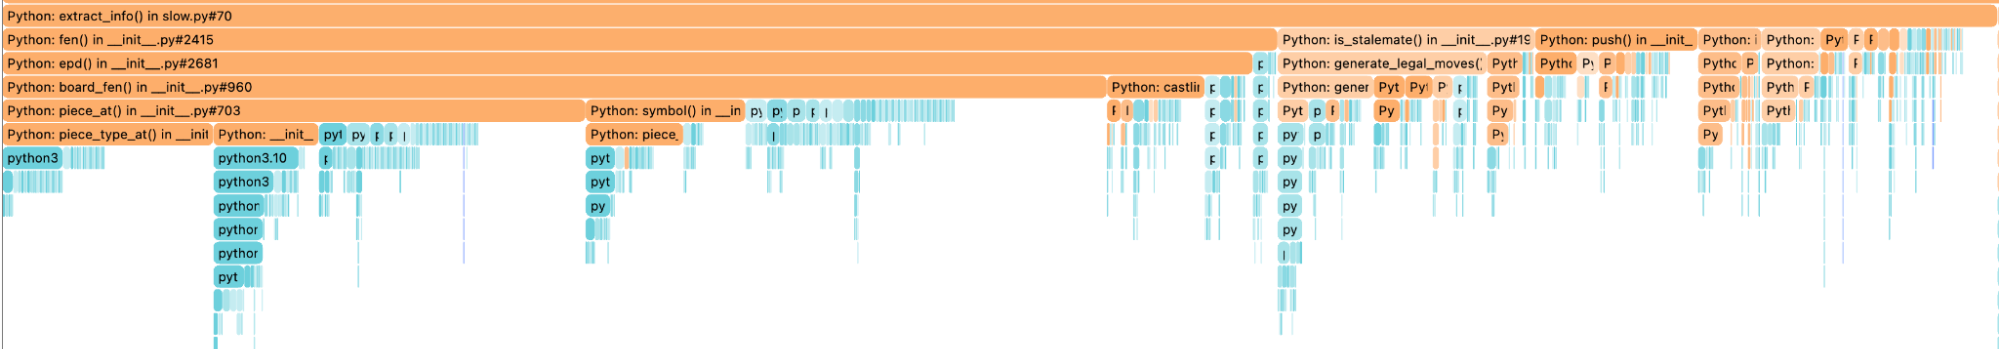
Similar to the approach before, find the most extended vertical action in orange and scan for the broadest function. So when I extract information from the game, I play the game on a board using the python-chess library because I want to try out and find some exciting moves and analyze each move individually. We can see that extract_info calls fen from the python-chess library, and this, in return, calls epd nearly every time. The call stack shows that there are some potential candidates for improvement. Maybe there is some stuff in epd that I can remove since I don’t need it, or I can speed up.
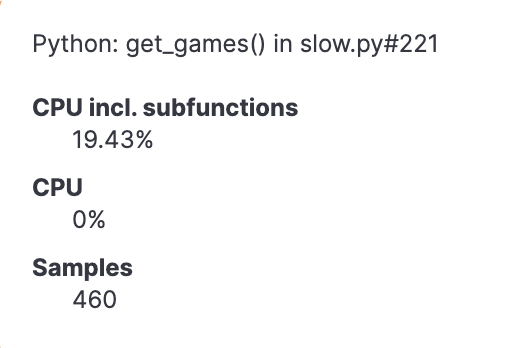
I promised you CPU% as well. The function get_games from before ends up with 19.43%. To put this into perspective, one must understand how our profiler works. Twenty times per second, we ask the CPU what’s going on, and in 20% of all samples that we took, this function get_games was part of this call stack. This means that we are resorting to statistical analysis, and the more instances running our script, the better accuracy we are getting. Remember this when you try out our profiler on a single node. You can read more about this in detail in our other blog post.
Summarizing this analysis lets me know that there are three parts to my slow parsing: the reading of the game, the playing through the game, and the indexing.
Custom parser and microservices
According to the previous summary, I did a few things completely differently. I am no longer relying on the python-chess library to parse the games. Instead, I use a simple line operator to create a game string. This is what it looks like:
games=[]
for line in f:
   if line.startswith("1."):
      temp_str += line
      games.append(temp_str)
      i += 1
      temp_str = ""
    elif line.startswith("["):
      temp_str += line
    elif line.strip() == "":
temp_str += lineNothing spectacular; when I reach 30,000 games in my games array, I send it off to be processed in the read_header function. There I simply parse the text into a dictionary.
header_dict = {}
for line in game.strip().split("\n"):
  if line.startswith("["):
     key, value = line[1:-1].split(' "')
     header_dict[key.strip()] = value.strip('"')
  elif line.startswith("1."):
header_dict["moves"] = line.strip()For the moves, I do something special. I removed all the fancy characters from the algebraic notation since I wanted to compare quickly if the games were very similar.
if header_dict["moves"].find("...") or header_dict["moves"].find("{"):
   # remove all the fancy stuff
   clean = re.sub("\{(.*?)\}", "", header_dict.get("moves"))
   clean = re.sub("(\d+\.{3})", "", clean)
   clean = re.sub("\?!|!\?|\?*|!*", "", clean)
   clean = re.sub("\s+", " ", clean)
clean = re.sub(" (1\/2-1\/2|\d-\d)", "", clean)There are many regexes, not the most performant solution, but it works. In the end, I parsed around 1.6 million games per 1 minute with this method. Continuing the import in a serialized manner, file 1, then file 2, then file 3, would take 2,500 minutes (1 day 18 hours). Nothing stops me from parallelizing it and running 3, 6, 9, or even more imports simultaneously, but that would not reduce the total CPU usage I focus on here.
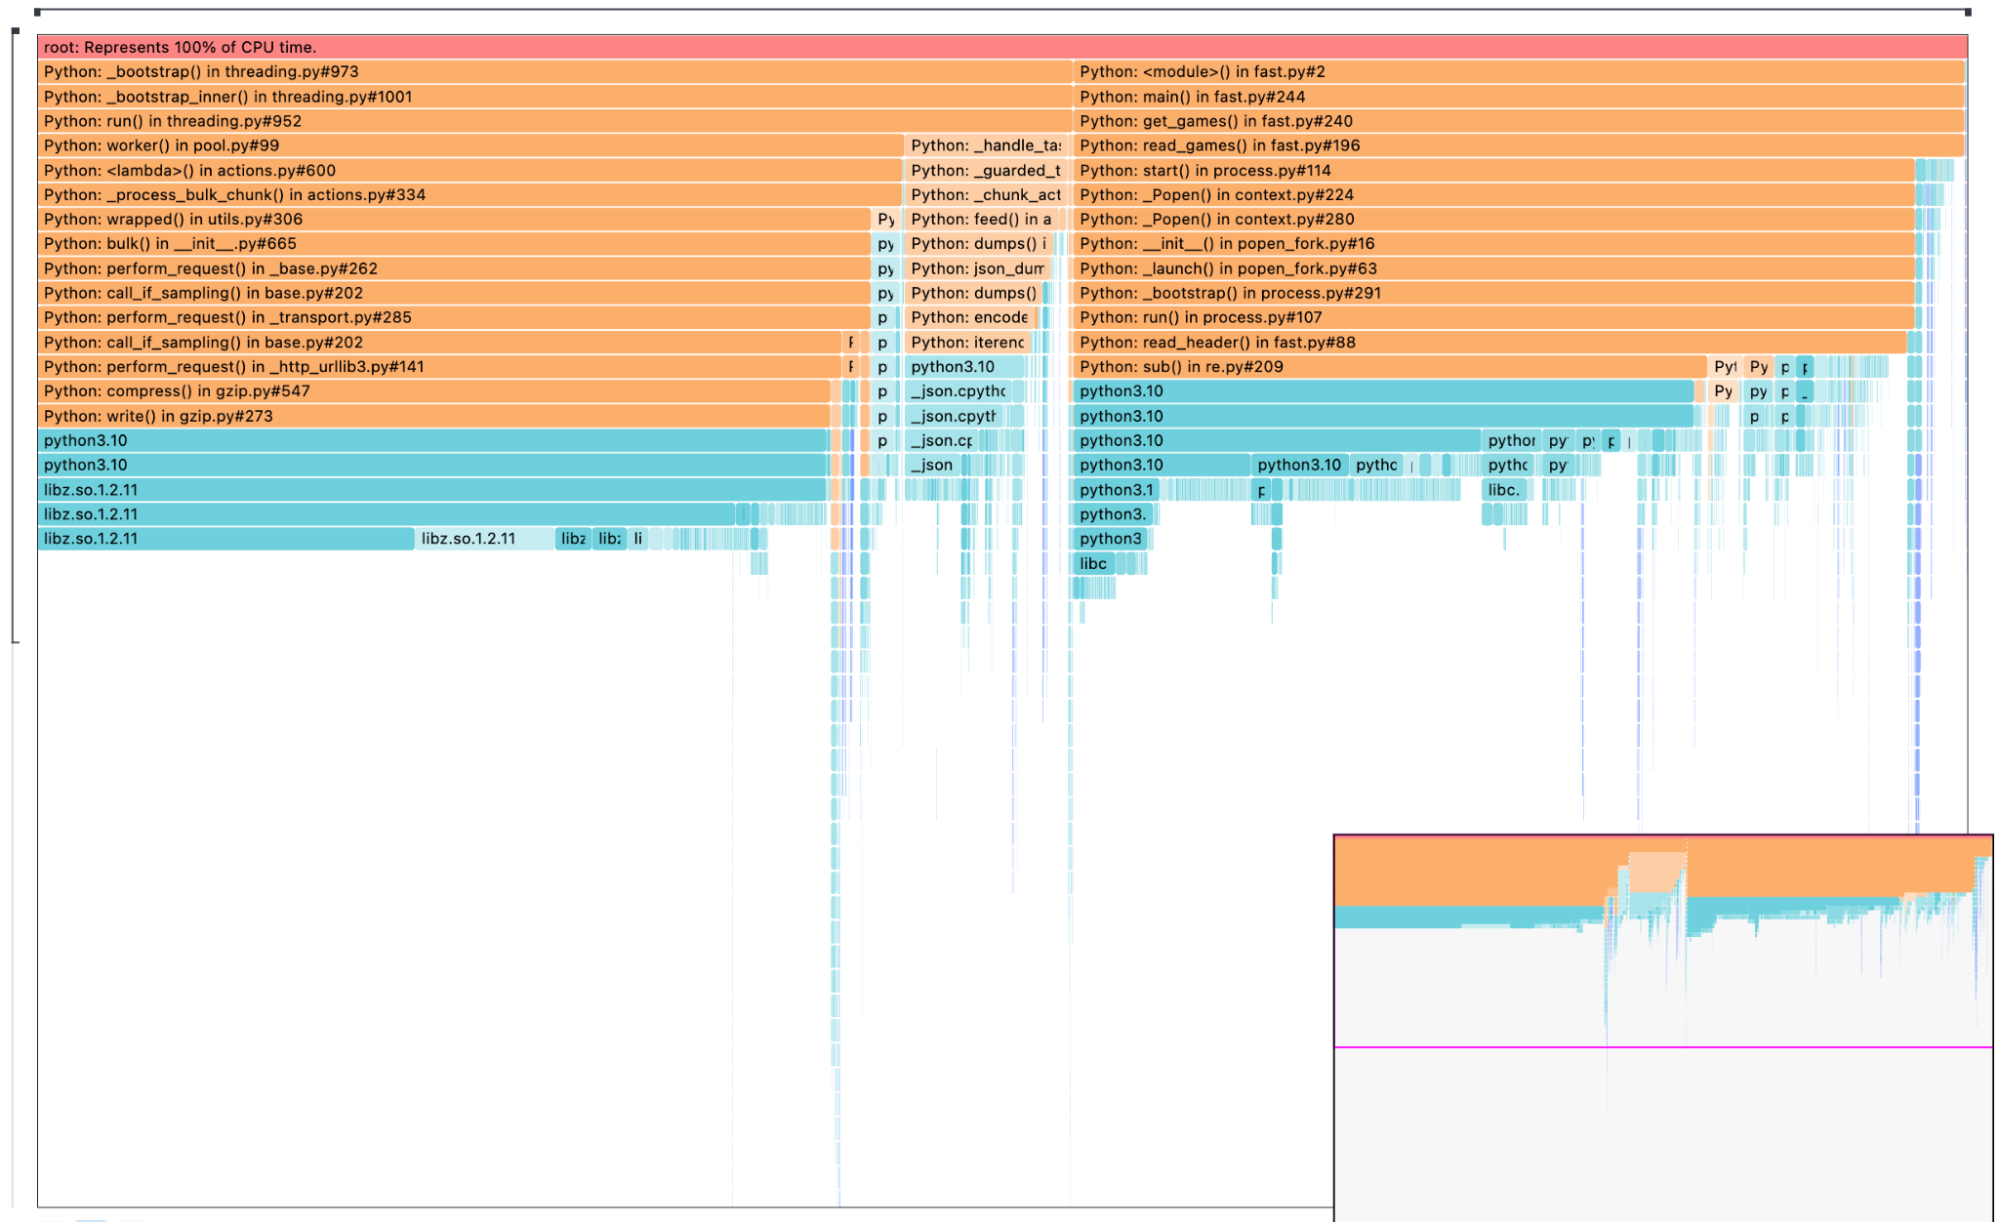
I used the profiler again, and it looks very different. Opposed to before, we can see that the time is spent either analyzing the game or indexing. That is good to know. Following that waterfall, we see compress taking up most of the indexing function.
Last but not least, I want to show you the differential function view:
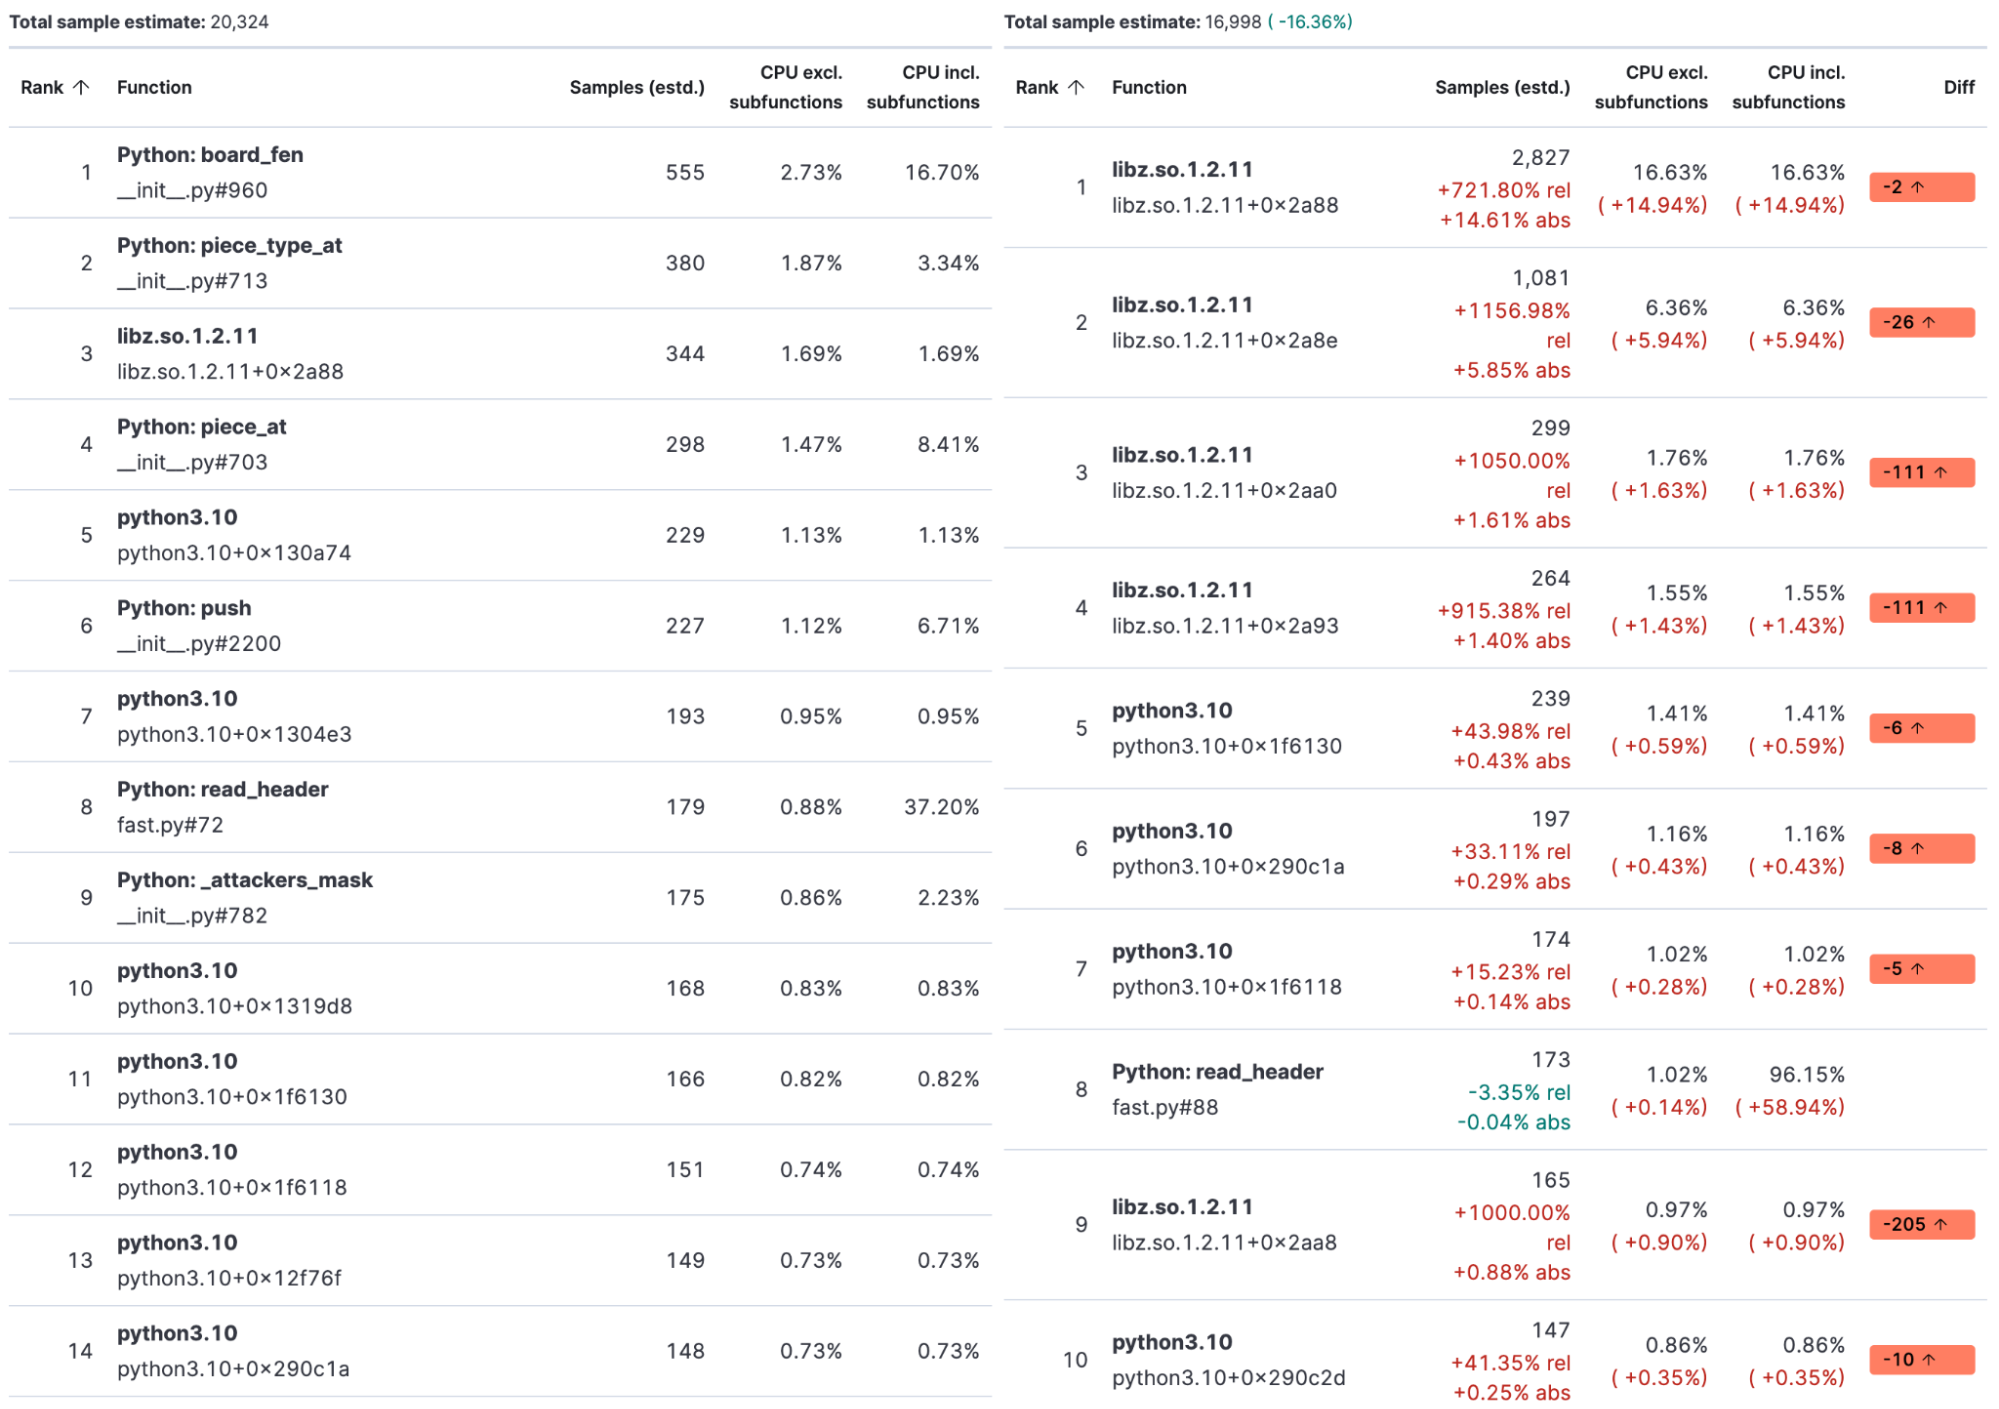
On the left side, we have the slower python-chess implementation; on the right side, the fast one uses the custom parser defined above. As you can see on the right, the first function defined by my script comes into play at spot 8. All other functions are system calls. The top five calls are libz to compress the bulk request. I can do only a little to improve it, deactivate the gzip compression, or reduce the compression level and have higher bandwidth usage.
Summary
In this blog post, we introduced how to read the portable game notation for chess and how Elastic APM and Universal Profiling can help identify bottlenecks in your application. Ultimately, we shipped over 4 billion games to the Elastic Stack and are ready for advanced data analysis.
Ready to get started? Begin a free 14-day trial of Elastic Cloud. Or download the self-managed version of the Elastic Stack for free.
Share
- Share on Twitter
Share on Twitter
- Share on LinkedIn
Share on LinkedIn
- Share on Facebook
Share on Facebook
- Share by Email
Share by Email
- Print this page
Print