Elastic Logs 7.6 released with log categorization and more
We are pleased to announce the release of Elastic Logs 7.6.0 — available on the Elasticsearch Service, or as part of the default distribution of Elastic Stack. This release moves logs anomaly detection one step further through introduction of logs categorization. In addition, we have added support for ingesting from Dockerized applications, AWS VPC flow, and ActiveMQ.
Log categorization led anomaly detection
What is log categorization?
Most software application and infrastructure log message content is constrained to a finite set of patterns, unlike human written content from blogs, reviews, and social media. Let’s take a simplified example of application logs which are written during an application lifecycle.
Reading text ‘foo’ from file ‘bar’ on host ‘host1’
Reading text ‘foo1’ from file ‘bar1’ on ‘host2’
Error: File ‘bar’ on ‘host2’ can not be read
Error: File ‘bar1’ on ‘host2’ can not be read
Database connection ‘conn1’ failed
In this case, log categorization will cluster similar looking messages into a single category even when there is variable content in between. For example, here we have three categories of messages.
Category 1 - Reading*text*from*file*on*host*
Category 2 - Error*File*on*can*not*be*read*
Category 3 - Database*connection*failed
So we reduced the number of messages from five to three, which is the essence of categorization, reducing vast amounts of logs into a smaller number of categories.
Where does anomaly detection fit in categorization?
Our log categorization builds a statistical model by analyzing past logs, and then uses that model to compute expected values of statistical parameters for each category for a future dataset. When the statistical parameter value of an existing category within a new set of logs diverge significantly from expected value, an ML algorithm flags that category as anomalous.
Why is this important?
Estimating expected behavior
In the above example, you may have a built-in retry logic for fault tolerance to account for random infrastructure failures of file readers and database connectors, so you may not care about occasional failures as much. However, you’d be alarmed if the failure rate is higher than normal as it may be a leading indicator of a systemic failure. This distinction between normal and anomalous behavior is where the ML algorithm plays a critical role by predicting expected behavior based on statistical analysis of past dataset.
Finding anomalies without needing to specify log patterns
The second and more important advantage of log categorization is to free users from worrying about needing to know the exact log patterns or maintaining complex regex math to catch these errors and run analytics on them. Log parsing processes are prone to log changes and also require deep knowledge of log message content. Often the folks who write application software and the ones who create analytics dashboards are different, so the process of creating and maintaining dashboards becomes cumbersome.
No ML expertise required
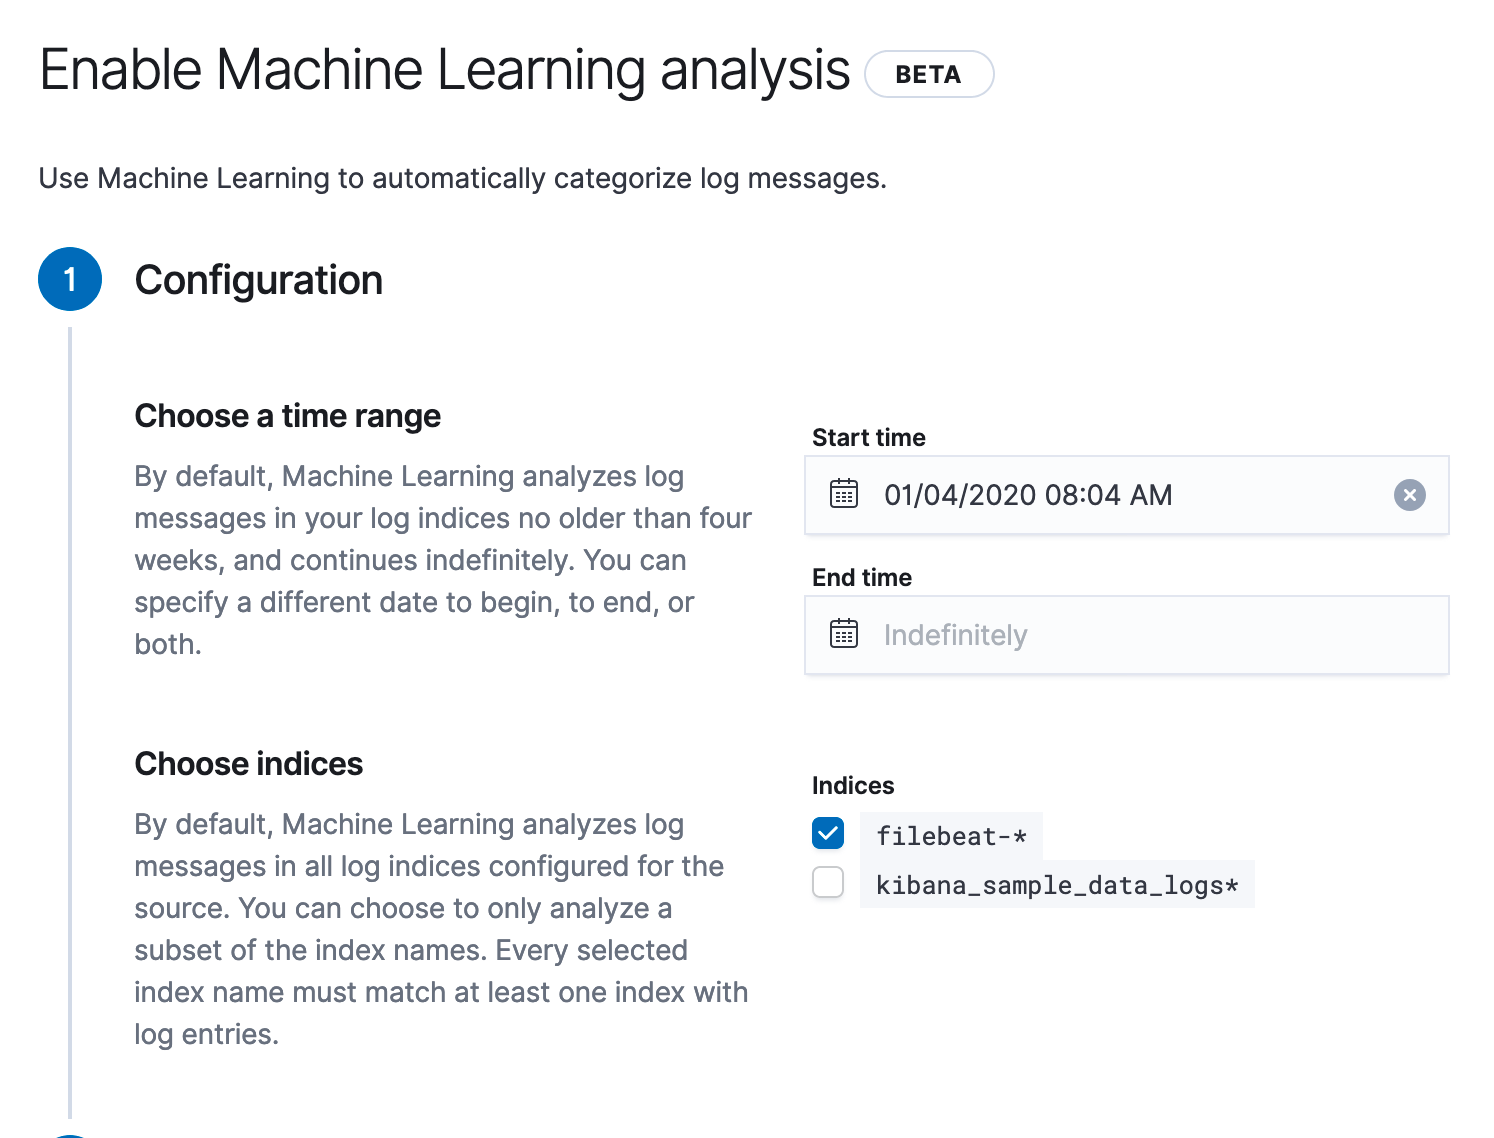
The only inputs that you’d need to provide are the index to search for anomalies and the time window to train the model for. Here is how simple categorization is to set up:
We take care of the required plumbing to integrate with Elastic’s machine learning capabilities to start the machine learning jobs, create detectors, and to find and visualize the anomalies. And we will do much more in future, so that you don’t have to learn yet another thing to do your job better.
The bottom line:
Our log categorization builds categories for your logs and finds anomalous categories, without you needing to tell us what you are looking for, the case of unknown unknowns, and any prerequisite ML experience. That’s quite powerful, isn’t it?
Logs categorization visualization
Alright, now that we got the basics out of the way, let’s look at a real example.
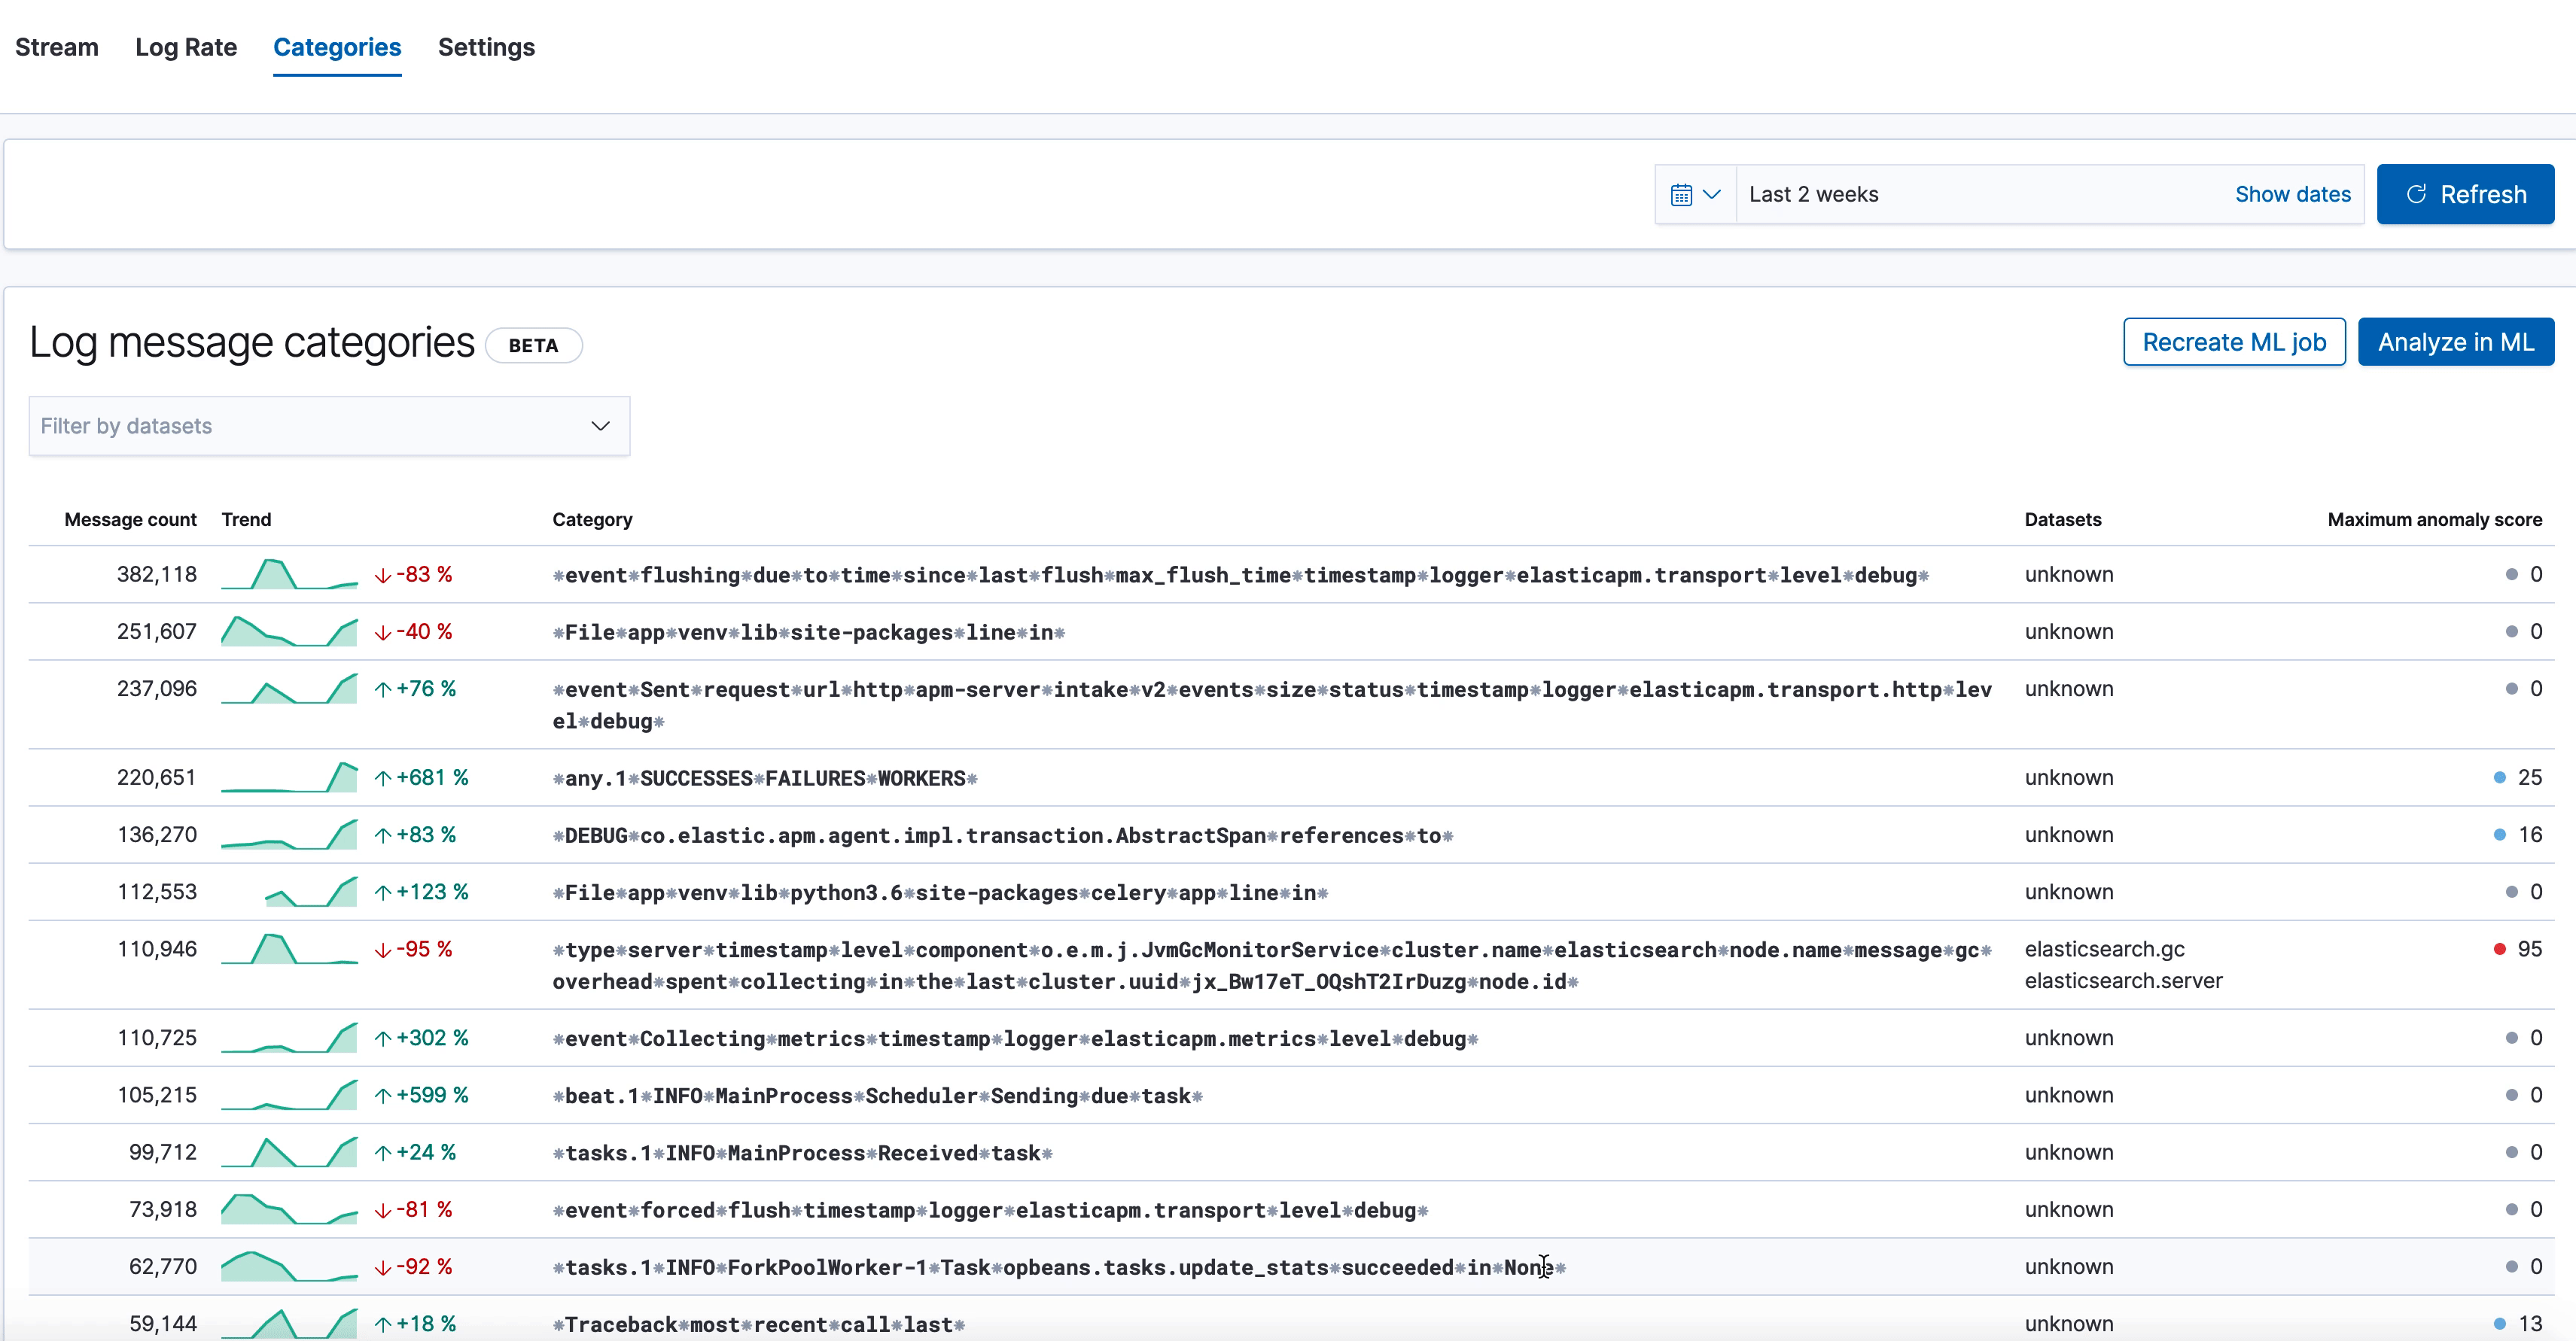
Here we see the new categorization tab in the Logs UI, which shows various log categories from elasticsearch.server logs, along with the anomaly score on the right. The one we've highlighted has a very high anomaly score, and looks like this:
⁕type⁕server⁕timestamp⁕level⁕component⁕o.e.m.j.JvmGcMonitorService⁕cluster.name⁕elasticsearch⁕node.name⁕message⁕gc⁕overhead⁕spent⁕collecting⁕in⁕the⁕last⁕cluster.uuid⁕jx_Bw17eT_OQshT2IrDuzg⁕node.id⁕
And an example of a log line in this category is as follows:
[elasticsearch.server][INFO] {"type": "server", "timestamp": "2020-01-31T22:51:03,633Z", "level": "INFO", "component": "o.e.m.j.JvmGcMonitorService", "cluster.name": "elasticsearch", "node.name": "elasticsearch-master-0", "message": "[gc][411617] overhead, spent [316ms] collecting in the last [1s]", "cluster.uuid": "jx_Bw17eT_OQshT2IrDuzg", "node.id": "JwIW6wI2T6WsgpoaUB3eaA" }
Our log categorization algorithm bubbled up an anomaly indicating an unexpected slow down of garbage collection runs, which may be a leading indicator of low JVM memory problems impacting Elasticsearch performance. Likewise, if you were already alerted about low JVM memory through the monitoring setup, logs categorization will make it trivial to find the root cause behind it by bubbling up the above category of “stopped garbage collection”. So it’s a great tool for both anomaly detection and recovery.
A few things to remember
Good datasets train the models for better categorization results
The categorization algorithms use past datasets to train statistical models and predict expected behavior. Statistically, these models are best trained with two or more weeks of data. But if you know that your logs pattern lifecycle without anomalies lasts more than four weeks, you can choose to go as far as back as you want in the logs categorization set up screen.
Category avalanche!
By design, categorization works well with repeated data patterns in logs. If your logs are free form (think of tweets or comments) then the number of categories will explode. Similarly, if logs consist mostly of dynamic values with a lot of randomness then they are probably not good candidates for categorization.
How to use it
If you are running on a platinum license, you are all set. If not, just start a trial to unleash the power of machine learning on all of your elasticsearch data.
What's next?
We will be working on improving UX of logs rate and categorization to make your anomaly detection and troubleshooting experience more pleasant. Stay tuned!
Expansion of log sources
In addition to log categorization, we have also added support for AWS VPC flow, AWS ELB, ActiveMQ, and easy UX for Dockerized apps to send logs to Elasticsearch.
AWS VPC Flow
What are VPC flow logs?
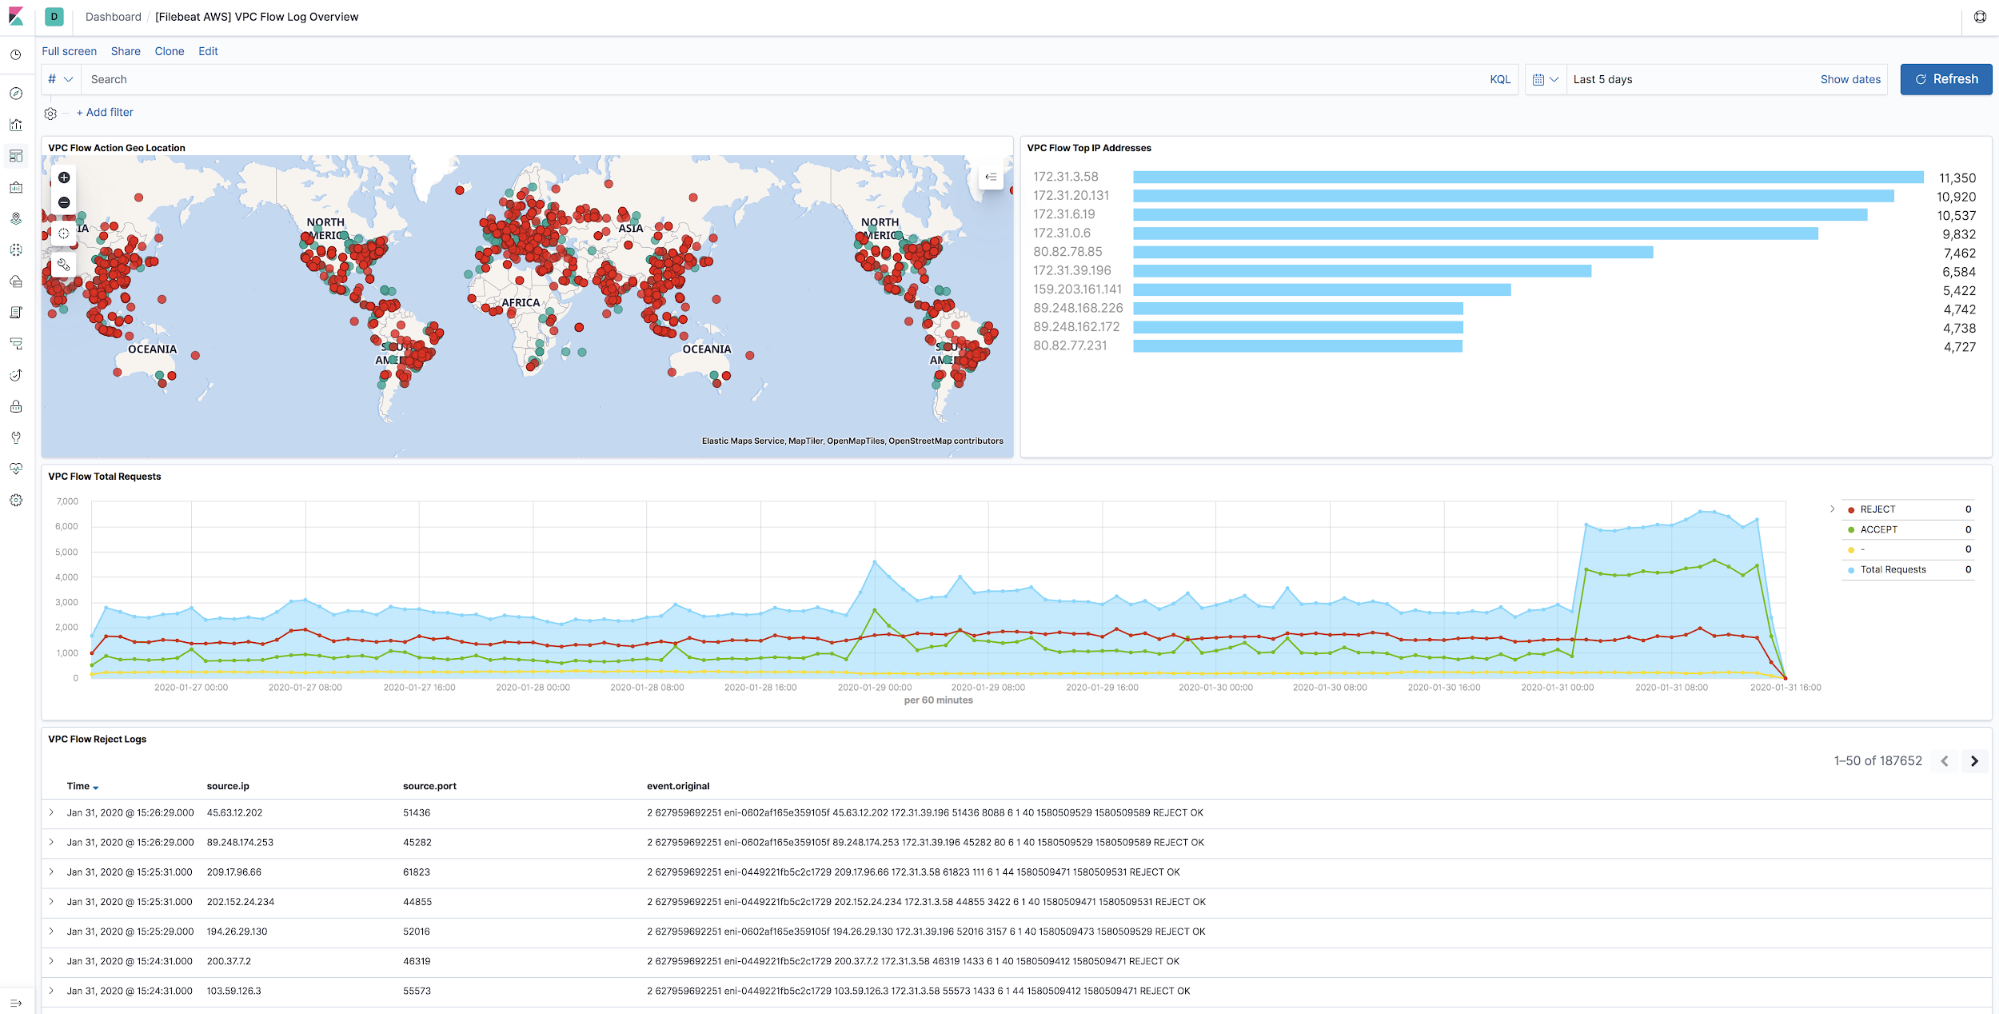
VPC flow logs enable you to capture information about the IP traffic going to and from network interfaces in your AWS virtual private cloud. Flow logs can be published to an Amazon S3 bucket and then shipped to Elasticsearch using SQS and S3 Filebeat.
Why are flow logs important?
They can help you with a number of troubleshooting tasks, such as:
- Diagnosing overly restrictive security group rules
- Monitoring the traffic that is reaching your instance
- Determining the direction of the traffic to and from the network interfaces
We include a built-in Kibana dashboard to help you diagnose some of these problems:
AWS Elastic Load Balancer (ELB)
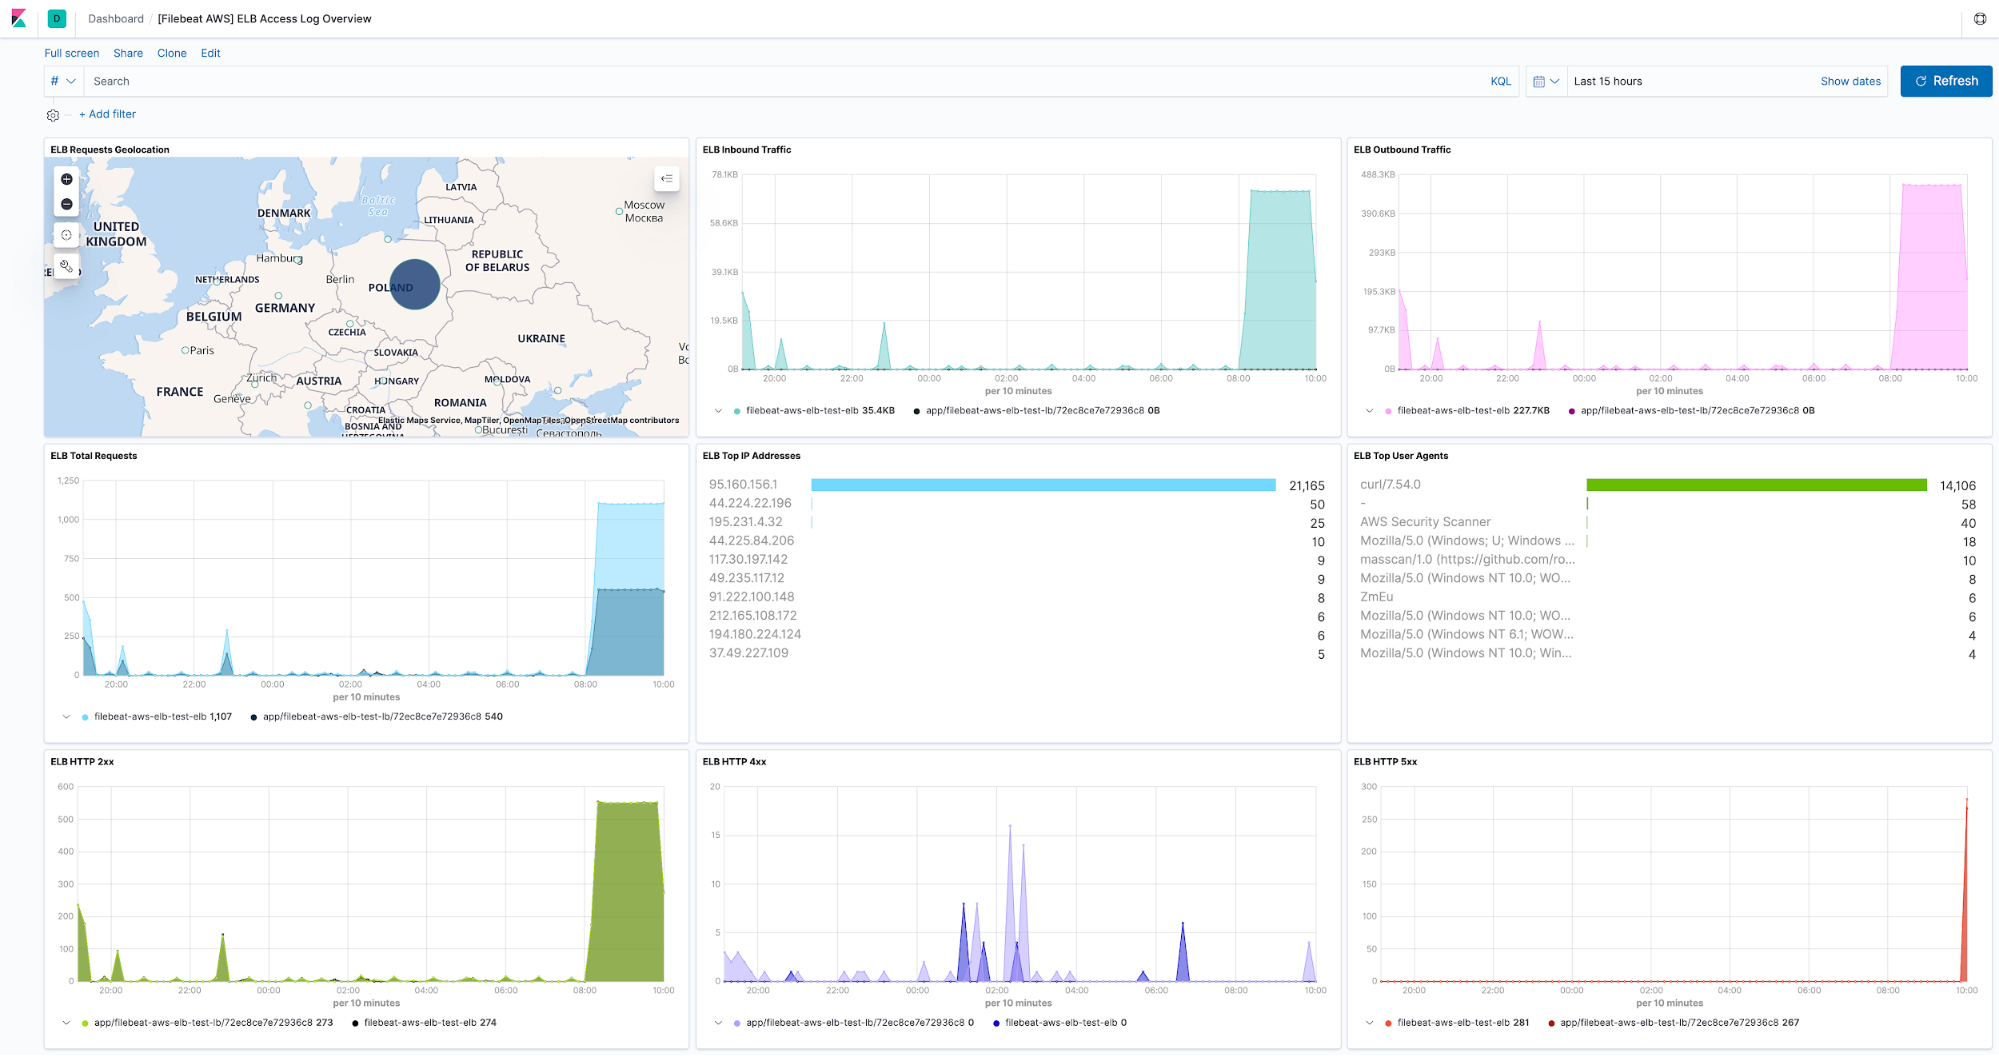
We released beta support for AWS Elastic Load Balancer in 7.5 and today we are happy to announce that it has been promoted to generally available!
It supports three kinds of load balancers offered by AWS: Classic Load Balancer, Application Load Balancer, and Network Load Balancer. We've also included a built-in dashboard for it so that you don’t have to build one.
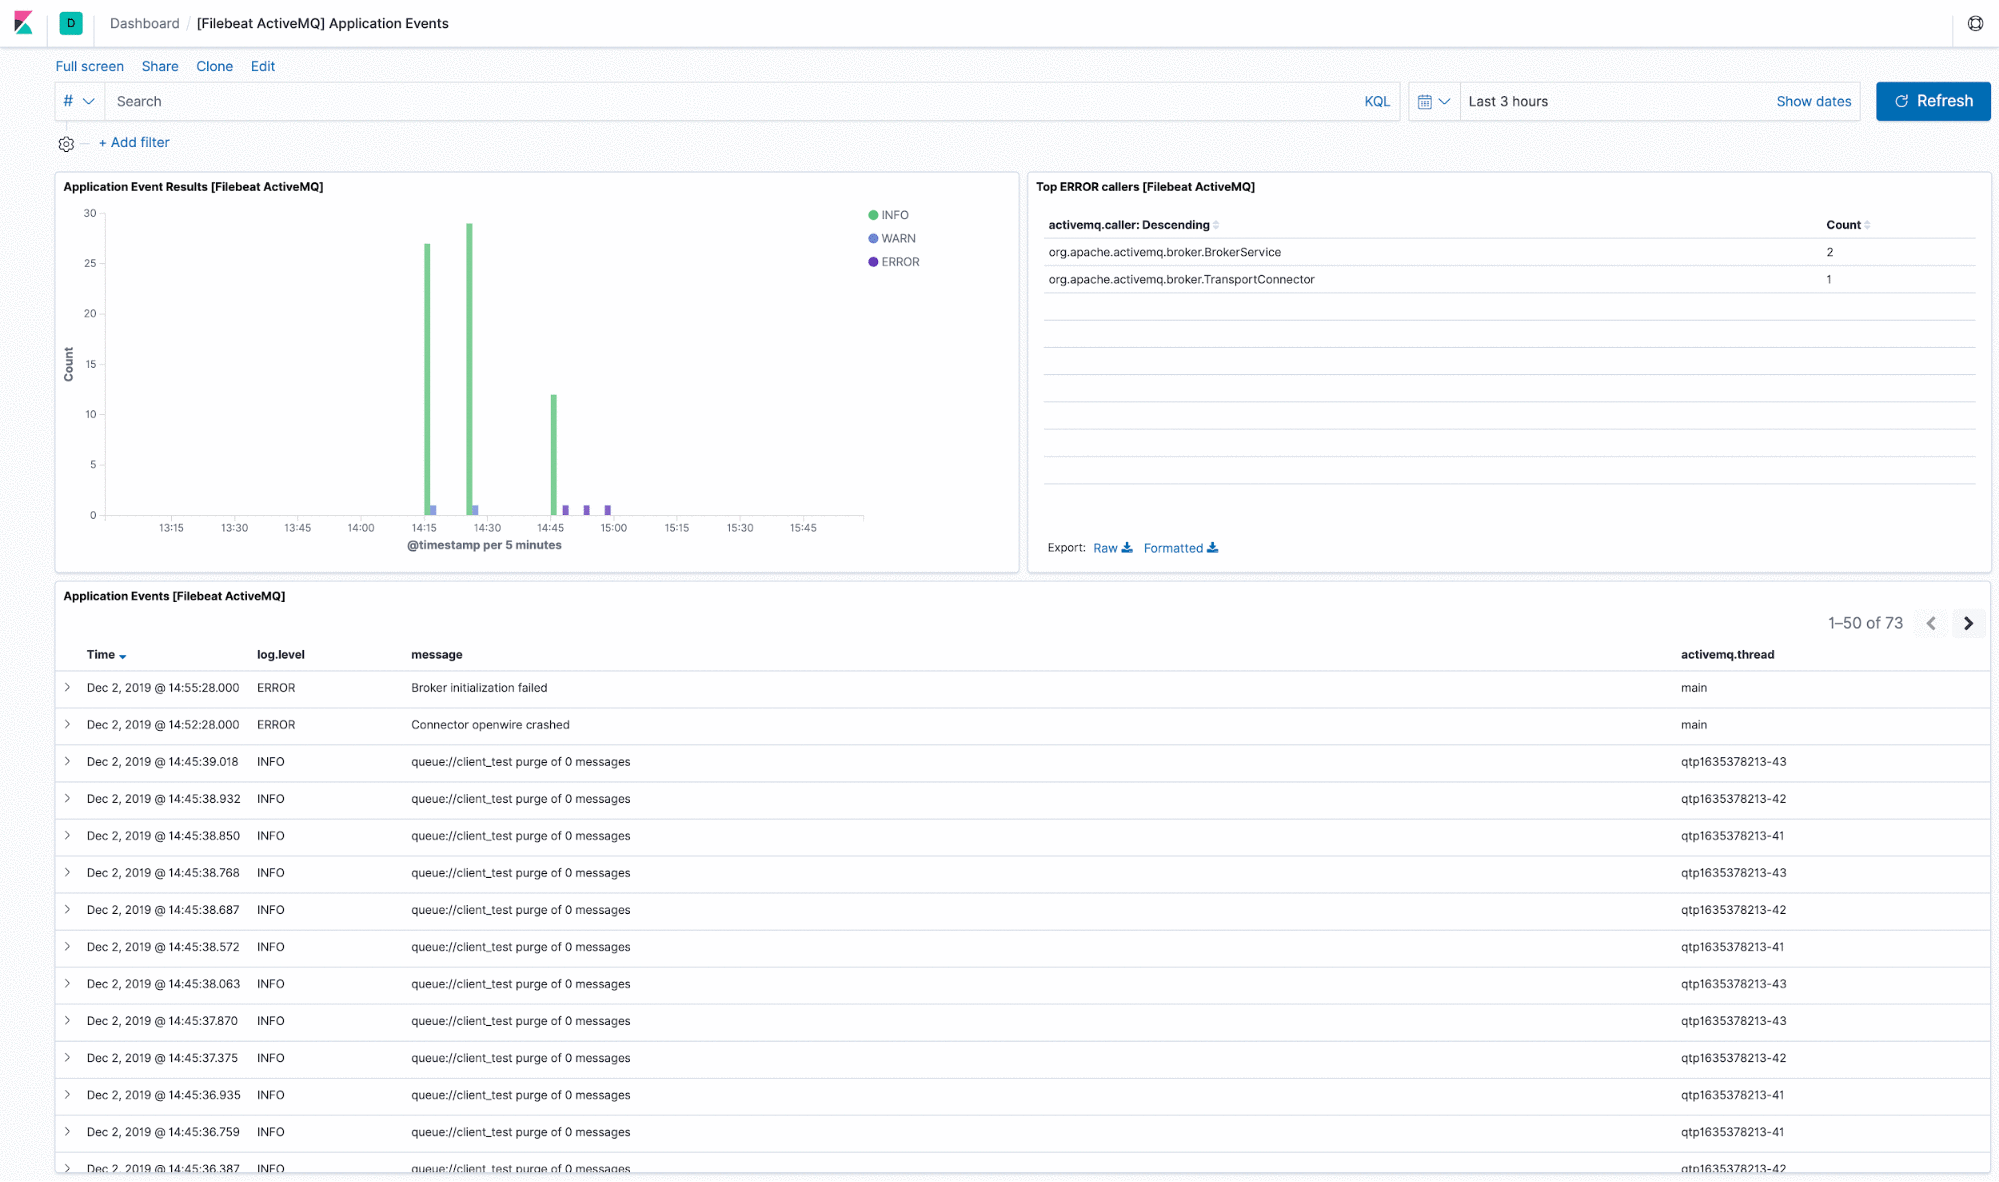
ActiveMQ
We are releasing a beta Apache ActiveMQ Filebeat module to ingest ActiveMQ application and audit logs in Elasticsearch. To help you get up and running in terms of how and what to use them for, we have created built-in ActiveMQ dashboards for application and audit logs, respectively.
Use the application logs dashboard to quickly identify and troubleshoot issues with the messaging stack, identify most problematic platform components, or review recents events presented on a time series graph.
Apart from collecting and watching application events, it’s highly recommended to also observe audit logs. To properly secure an environment, there’s a necessity to record every user’s management action, no matter if it’s made with JMX or WebConsole interface. The predefined audit log dashboard shows all kinds of activity, and includes the username, severity, and a detailed message.
Docker logs
This release also includes an experimental release of the Elastic Logging Plugin on Docker hub to enable an easy logging experience for Docker apps. On any Mac or Linux Docker installation, the driver can be installed with a single command: docker plugin install store/elastic/elastic-logging-plugin:7.6.0. The Elastic Logging Plugin for Docker can be used to forward logs to Elasticsearch, Logstash, Kafka, or Redis, for all Docker containers or on a per-container basis. Unlike other Beats, the Elastic Logging Plugin requires no elevated permissions to read container logs, and installation is done entirely within the Docker CLI.
Functionbeat adds support for GCP
Functionbeat is a project that allows you to run Beats data ingestion code as a function in major cloud providers. Starting with the 7.6 release, Functionbeat can be deployed as a Google Function via Google Cloud Deployment Manager and pull log events from Google PubSub and Google Cloud Storage.
See it in action
You can access the latest version of the Elastic Logs application on the Elasticsearch Service on Elastic Cloud by creating a new cluster or upgrading an existing cluster on the day of release. Or you can download it as part of the default distribution of the Elastic Stack.